Money
Mapped: The Ins and Outs of Remittance Flows
Mapped: The Ins and Outs of Remittance Flows
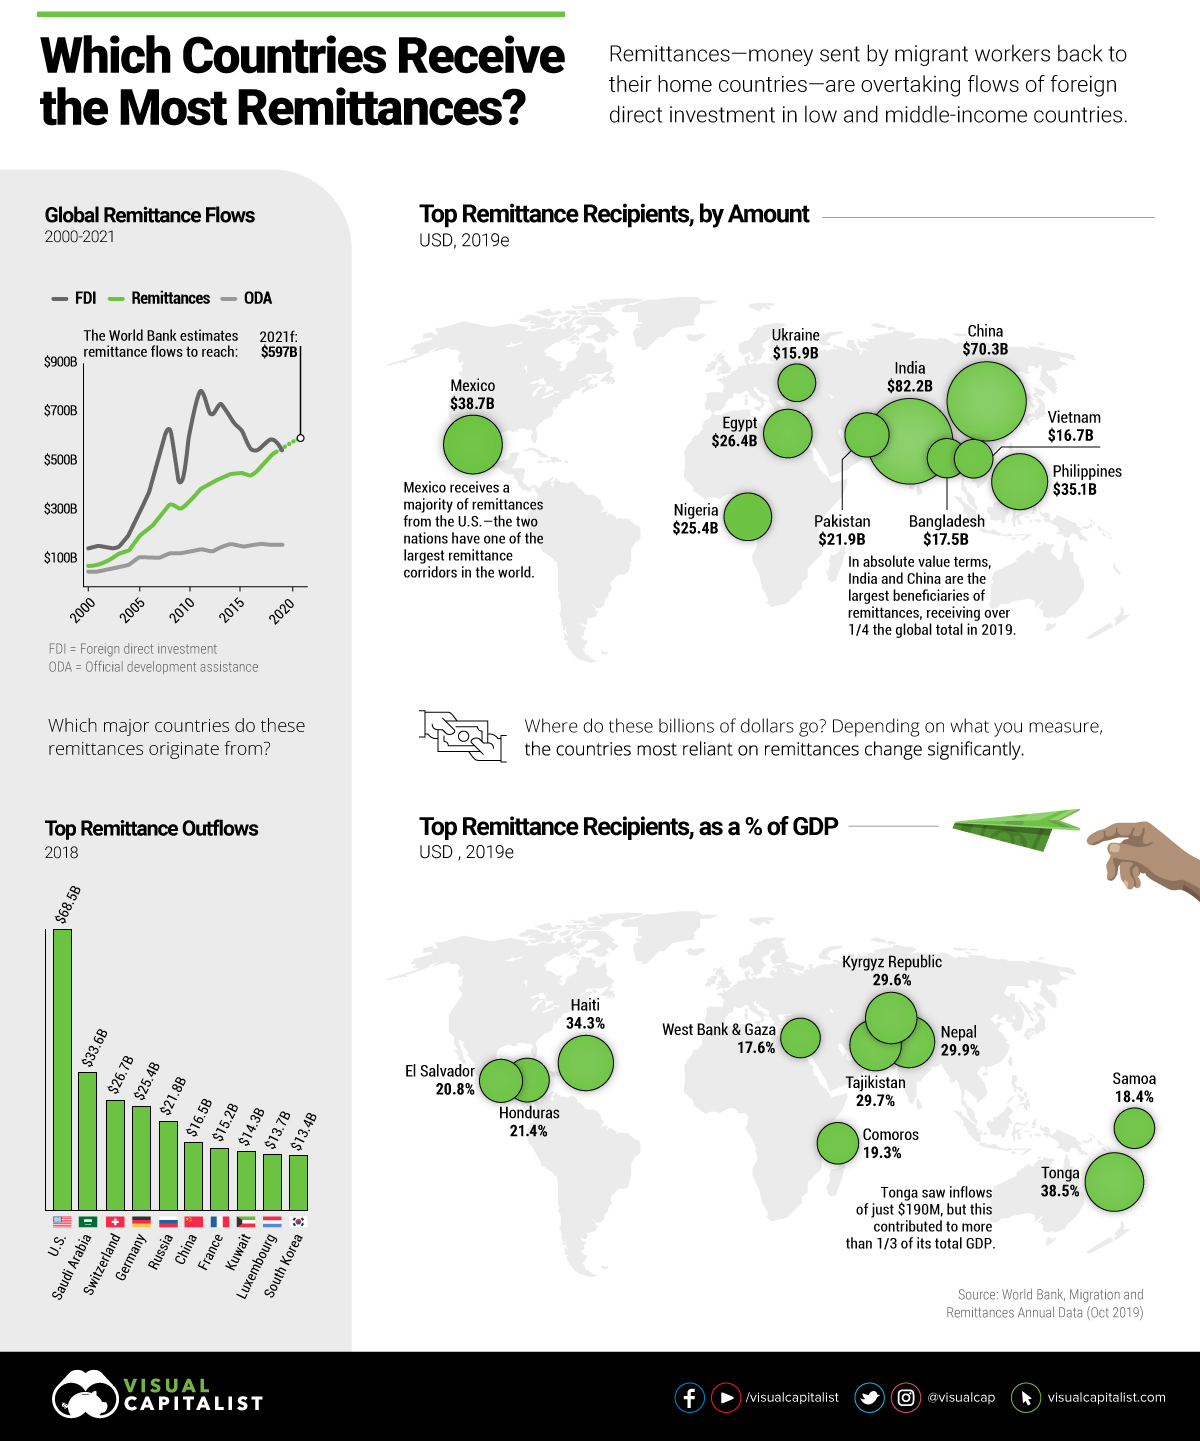
The global immigrant population is growing at a robust pace, and their aggregate force is one to be reckoned with. In 2019, migrants collectively sent $550.5 billion in money back to their home countries—money transfer flows that are also known as remittances.
Remittances serve as an economic lifeline around the world, particularly for low- and middle-income countries (LMICs). Today’s visualization relies on the latest data from the World Bank to create a snapshot of these global remittance flows.
Where do most of these remittances come from, and which countries are the biggest recipients?
Remittances: An Origin Story
Remittances are a type of capital flow, with significant impacts on the places they wind up. These money transfers have surpassed official aid being sent to LMICs for decades, and in this day and age, are rivaling even Foreign Direct Investment (FDI) flows.
Remittance flows mainly help improve basic living standards such as housing, healthcare, and education, with leftover funds going towards other parts of the economy. They can also be a means for increasing the social mobility of family and friends back home.
Altogether, 50% of remittances are sent in either U.S. dollars, or the closely-linked currencies of Gulf Cooperation Council (GCC) countries, such as the Saudi riyal. It’s not surprising then, that the U.S. is the biggest origin country of remittances, contributing $68.5 billion in 2018—more than double that of the next-highest country, Saudi Arabia, at $33.6 billion.
Remittance Flows As A Safety Net
The impact of remittances on LMICs can vary depending on what you measure. In absolute terms, the top 10 LMIC recipients received $350 billion, or nearly 64% of total remittances in 2019.
Top Remittance Recipients in 2019 (USD)
| Rank | Country | Remittance Inflows | % of Nominal GDP |
|---|---|---|---|
| #1 | 🇮🇳 India | $82.2B | 2.8% |
| #2 | 🇨🇳 China | $70.3B | 0.5% |
| #3 | 🇲🇽 Mexico | $38.7B | 3.1% |
| #4 | 🇵🇭 Philippines | $35.1B | 9.8% |
| #5 | 🇪🇬 Egypt | $26.4B | 8.8% |
| #6 | 🇳🇬 Nigeria | $25.4B | 5.7% |
| #7 | 🇵🇰 Pakistan | $21.9B | 7.9% |
| #8 | 🇧🇩 Bangladesh | $17.5B | 5.5% |
| #9 | 🇻🇳 Vietnam | $16.7B | 6.4% |
| #10 | 🇺🇦 Ukraine | $15.9B | 11.8% |
India tops the chart as the largest remittances beneficiary, followed by China and Mexico. Interestingly, these three countries are also the main destinations of remittance flows from the U.S., but in the reverse order. Mexico and the U.S. have one of the most interconnected remittance corridors in the world.
However, the chart above makes it clear that simply counting the dollars is only one part of the picture. Despite these multi-billion dollar numbers, remittances are equal to only a fraction of these economies.
By looking at remittances as a percentage of nominal GDP, it’s clear that they can have an outsize impact on nations, even if the overall value of flows are much lower in comparison.
Top Remittance Recipients in 2019 (% of GDP)
| Rank | Country | Remittance Inflows | % of Nominal GDP |
|---|---|---|---|
| #1 | 🇹🇴 Tonga | $0.19B | 38.5% |
| #2 | 🇭🇹 Haiti | $3.3B | 34.3% |
| #3 | 🇳🇵 Nepal | $8.6B | 29.9% |
| #4 | 🇹🇯 Tajikistan | $2.3B | 29.7% |
| #5 | 🇰🇬 Kyrgyz Republic | $2.4B | 29.6% |
| #6 | 🇭🇳 Honduras | $5.3B | 21.4% |
| #7 | 🇸🇻 El Salvador | $5.6B | 20.8% |
| #8 | 🇰🇲 Comoros | $0.14B | 19.3% |
| #9 | 🇼🇸 Samoa | $0.17B | 18.4% |
| #10 | 🇵🇸 West Bank and Gaza | $2.6B | 17.6% |
It’s clear that the cash influxes provided by remittances are crucial to many smaller countries. Take the Polynesian archipelago of Tonga, for example: even though it only saw $190 million in remittances from abroad, that amount accounts for nearly 40% of the country’s nominal GDP.
Will The Remittance Tides Turn?
The World Bank projects remittance flows to increase to nearly $600 billion by 2021. But are such projections of future remittance flows reliable? The researchers offer two reasons why remittances may ebb and flow.
On one hand, anti-immigration sentiment across major economies could complicate this growth, as evidenced by Brexit. The good news? That doesn’t stop immigration itself from taking place. Instead, where these migrants and their money end up, are constantly in flux.
This means that as immigration steadily grows, so will remittance flows. What’s more, fintech innovations have the potential to bolster this progress, by making money transfers cheaper and easier to access.
Tackling [high transaction costs] is crucial not only for economic and social development, but also for improving financial inclusion.
—UN ESCAP, Oct 2019


Demographics
The Smallest Gender Wage Gaps in OECD Countries
Which OECD countries have the smallest gender wage gaps? We look at the 10 countries with gaps lower than the average.


The Smallest Gender Pay Gaps in OECD Countries
This was originally posted on our Voronoi app. Download the app for free on iOS or Android and discover incredible data-driven charts from a variety of trusted sources.
Among the 38 member countries in the Organization for Economic Cooperation and Development (OECD), several have made significant strides in addressing income inequality between men and women.
In this graphic we’ve ranked the OECD countries with the 10 smallest gender pay gaps, using the latest data from the OECD for 2022.
The gender pay gap is calculated as the difference between median full-time earnings for men and women divided by the median full-time earnings of men.
Which Countries Have the Smallest Gender Pay Gaps?
Luxembourg’s gender pay gap is the lowest among OECD members at only 0.4%—well below the OECD average of 11.6%.
| Rank | Country | Percentage Difference in Men's & Women's Full-time Earnings |
|---|---|---|
| 1 | 🇱🇺 Luxembourg | 0.4% |
| 2 | 🇧🇪 Belgium | 1.1% |
| 3 | 🇨🇷 Costa Rica | 1.4% |
| 4 | 🇨🇴 Colombia | 1.9% |
| 5 | 🇮🇪 Ireland | 2.0% |
| 6 | 🇭🇷 Croatia | 3.2% |
| 7 | 🇮🇹 Italy | 3.3% |
| 8 | 🇳🇴 Norway | 4.5% |
| 9 | 🇩🇰 Denmark | 5.8% |
| 10 | 🇵🇹 Portugal | 6.1% |
| OECD Average | 11.6% |
Notably, eight of the top 10 countries with the smallest gender pay gaps are located in Europe, as labor equality laws designed to target gender differences have begun to pay off.
The two other countries that made the list were Costa Rica (1.4%) and Colombia (1.9%), which came in third and fourth place, respectively.
How Did Luxembourg (Nearly) Eliminate its Gender Wage Gap?
Luxembourg’s virtually-non-existent gender wage gap in 2020 can be traced back to its diligent efforts to prioritize equal pay. Since 2016, firms that have not complied with the Labor Code’s equal pay laws have been subjected to penalizing fines ranging from €251 to €25,000.
Higher female education rates also contribute to the diminishing pay gap, with Luxembourg tied for first in the educational attainment rankings of the World Economic Forum’s Global Gender Gap Index Report for 2023.
See More Graphics about Demographics and Money
While these 10 countries are well below the OECD’s average gender pay gap of 11.6%, many OECD member countries including the U.S. are significantly above the average. To see the full list of the top 10 OECD countries with the largest gender pay gaps, check out this visualization.

-

 Mining2 weeks ago
Charted: The Value Gap Between the Gold Price and Gold Miners
-

 Real Estate1 week ago
Ranked: The Most Valuable Housing Markets in America
-

 Business1 week ago
Charted: Big Four Market Share by S&P 500 Audits
-

 AI1 week ago
The Stock Performance of U.S. Chipmakers So Far in 2024
-

 Misc1 week ago
Almost Every EV Stock is Down After Q1 2024
-

 Money2 weeks ago
Where Does One U.S. Tax Dollar Go?
-

 Green2 weeks ago
Ranked: Top Countries by Total Forest Loss Since 2001
-

 Real Estate2 weeks ago
Visualizing America’s Shortage of Affordable Homes