Markets
Animation: Mapping the Recovery from the Global Recession of 2020
How to Use: The below maps will animate automatically. To pause, move your cursor on the image. Arrows on left/right navigate.

Animated gif version, All three maps (Static)


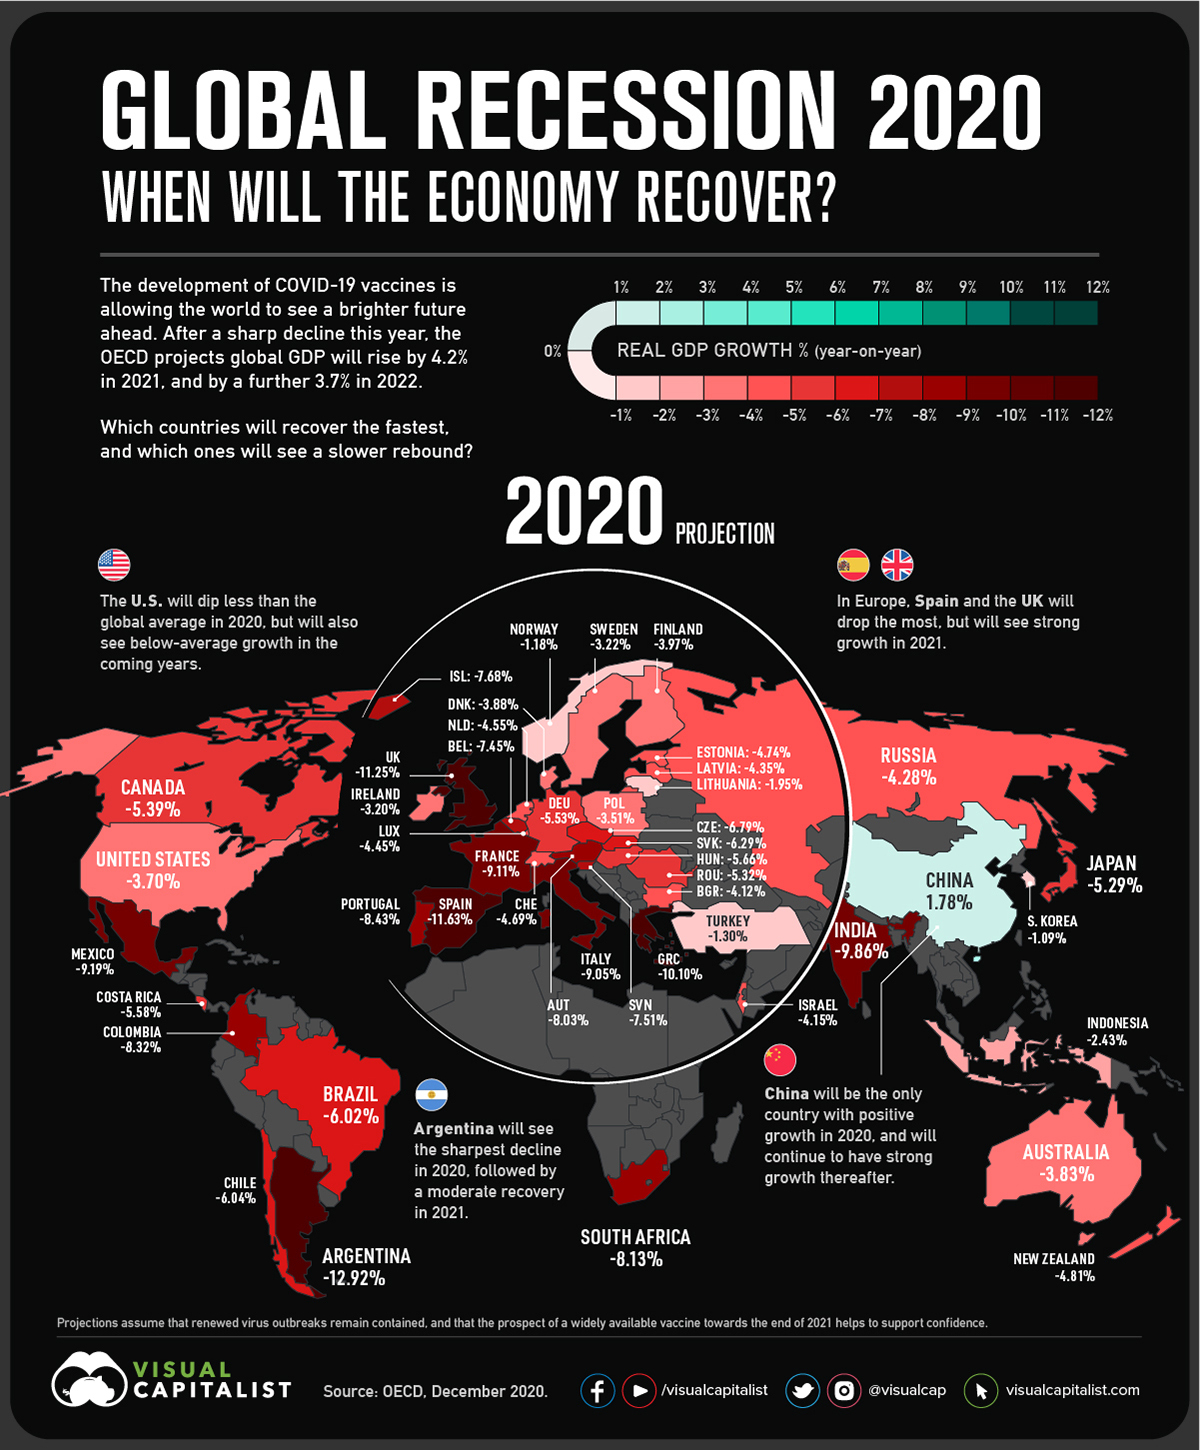
Global Recession 2020: When Will the Economy Recover?
With 2020 nearly behind us, many are eagerly looking ahead to what 2021 will bring. COVID-19 vaccinations have begun, and hope is on the horizon for a stronger economy going forward.
The Organization for Economic Co-operation and Development (OECD) projects that after a 4.2% drop this year, the global economy will reach pre-pandemic levels in 2021. This animation, which uses data from the OECD, shows which countries will recover the fastest from the global recession in 2020.
Economic Forecast by Country
The projections assume that renewed virus outbreaks remain contained, and that a widely available vaccine near the end of 2021 helps to support confidence. Information used in the projections, such as monetary and fiscal policies, is as of November 27, 2020.
Here is how the economic forecasts break down for both OECD and non-OECD countries, sorted by projected real GDP growth in 2021:
| Country | 2020P | 2021P | 2022P |
|---|---|---|---|
| 🇨🇳 China | 1.78 | 8.04 | 4.95 |
| 🇮🇳 India | -9.86 | 7.90 | 4.83 |
| 🇫🇷 France | -9.11 | 6.03 | 3.27 |
| 🇪🇸 Spain | -11.63 | 5.00 | 3.99 |
| 🇧🇪 Belgium | -7.45 | 4.69 | 2.68 |
| 🇮🇹 Italy | -9.05 | 4.29 | 3.17 |
| 🇨🇱 Chile | -6.04 | 4.25 | 2.96 |
| 🇬🇧 United Kingdom | -11.25 | 4.20 | 4.10 |
| 🇮🇩 Indonesia | -2.43 | 3.96 | 5.05 |
| 🇦🇷 Argentina | -12.92 | 3.71 | 4.55 |
| Mexico | -9.19 | 3.56 | 3.43 |
| Canada | -5.39 | 3.47 | 2.01 |
| Colombia | -8.32 | 3.47 | 3.73 |
| Slovenia | -7.51 | 3.44 | 3.54 |
| Estonia | -4.74 | 3.42 | 3.33 |
| Bulgaria | -4.12 | 3.31 | 3.71 |
| Sweden | -3.22 | 3.27 | 3.31 |
| Australia | -3.83 | 3.24 | 3.06 |
| Norway | -1.18 | 3.23 | 1.55 |
| United States | -3.70 | 3.19 | 3.46 |
| South Africa | -8.13 | 3.09 | 2.53 |
| Iceland | -7.68 | 3.00 | 3.20 |
| Poland | -3.51 | 2.92 | 3.82 |
| Turkey | -1.30 | 2.92 | 3.20 |
| Russia | -4.28 | 2.85 | 2.23 |
| South Korea | -1.09 | 2.84 | 3.36 |
| Germany | -5.53 | 2.80 | 3.31 |
| New Zealand | -4.81 | 2.73 | 2.63 |
| Slovakia | -6.29 | 2.68 | 4.34 |
| Lithuania | -1.95 | 2.67 | 3.14 |
| Brazil | -6.02 | 2.62 | 2.16 |
| Hungary | -5.66 | 2.55 | 3.40 |
| Latvia | -4.35 | 2.40 | 4.01 |
| Japan | -5.29 | 2.32 | 1.49 |
| Israel | -4.15 | 2.27 | 4.20 |
| Switzerland | -4.69 | 2.16 | 3.38 |
| Romania | -5.32 | 2.01 | 4.41 |
| Costa Rica | -5.58 | 1.99 | 3.84 |
| Denmark | -3.88 | 1.80 | 2.51 |
| Portugal | -8.43 | 1.72 | 1.87 |
| Finland | -3.97 | 1.54 | 1.83 |
| Czech Republic | -6.79 | 1.50 | 3.27 |
| Luxembourg | -4.45 | 1.47 | 3.76 |
| Austria | -8.03 | 1.38 | 2.31 |
| Greece | -10.1 | 0.90 | 6.58 |
| Netherlands | -4.55 | 0.82 | 2.95 |
| Ireland | -3.20 | 0.11 | 4.27 |
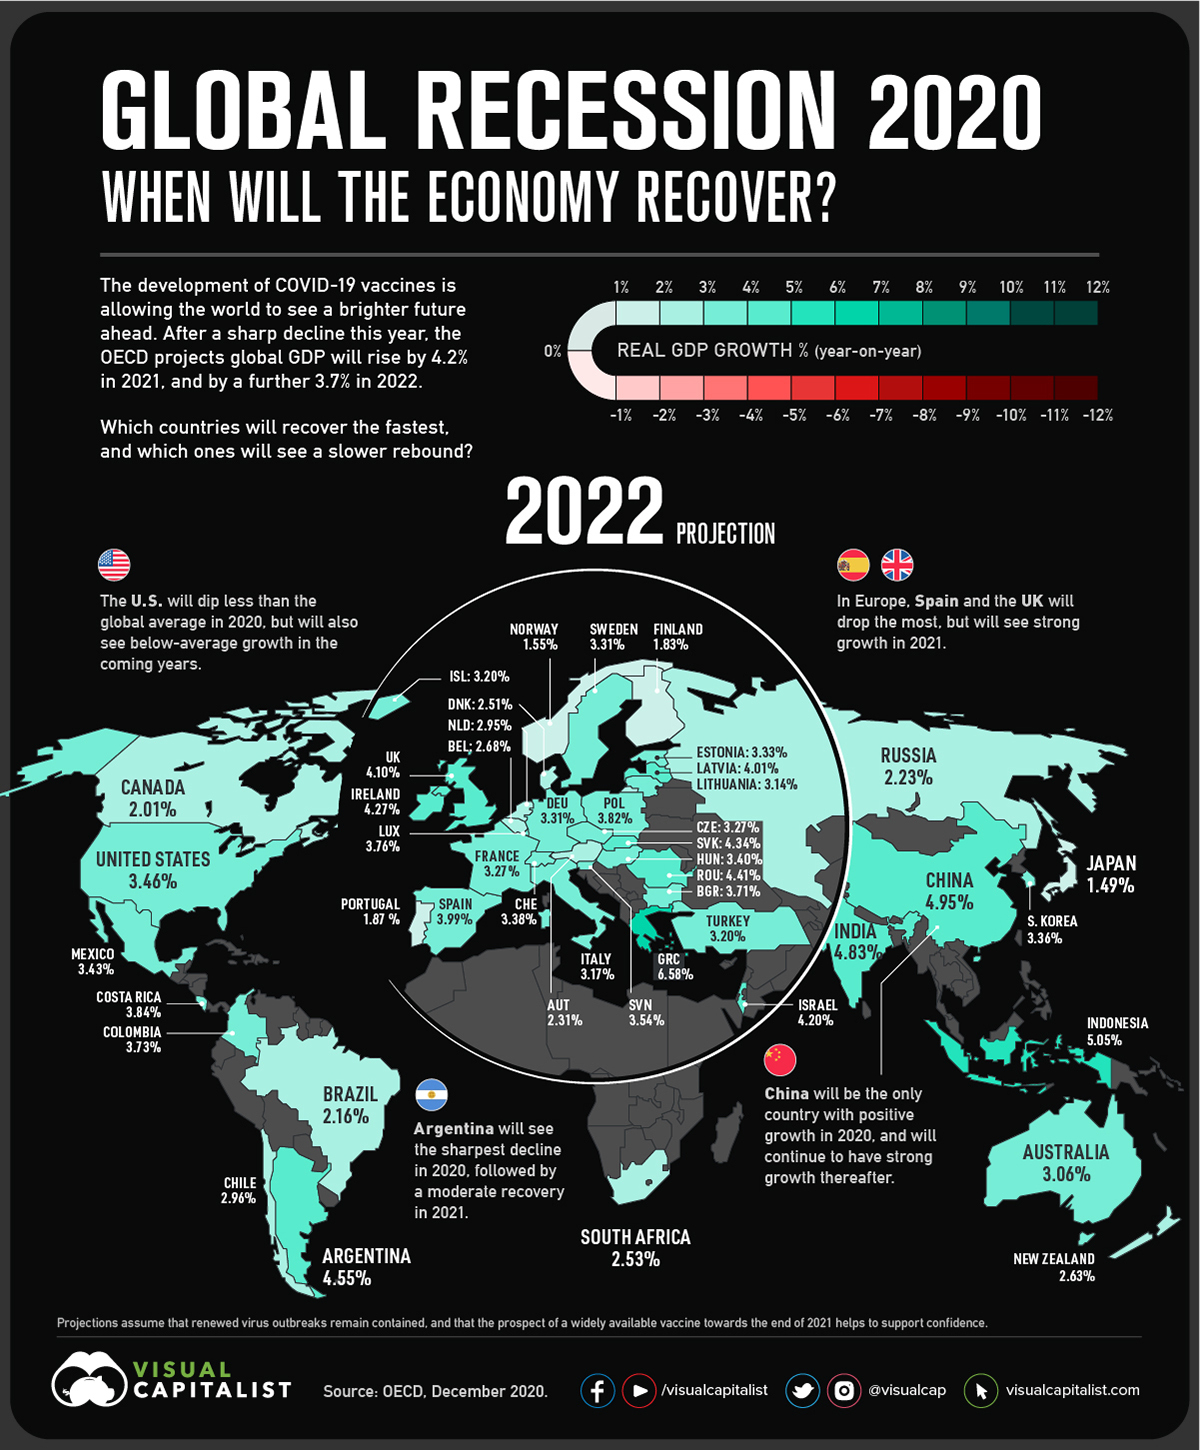
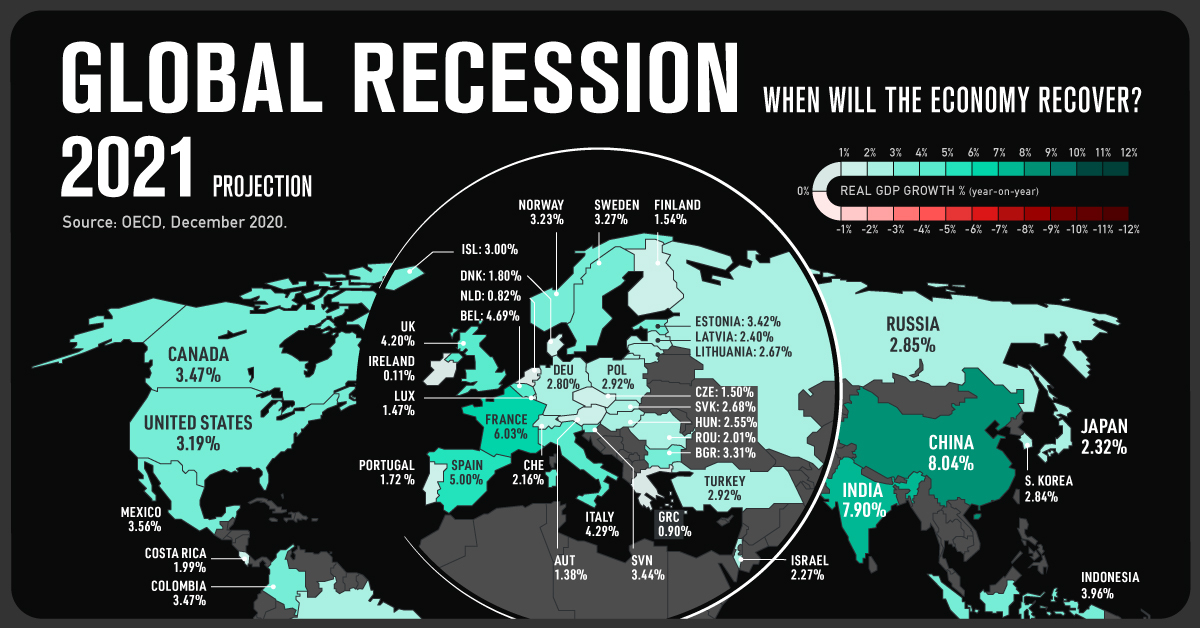
China started recovering earlier than most countries, and is projected to be the only country with positive GDP growth in 2020. Strong growth will continue in 2021, when China will account for over one-third of global economic growth.
Meanwhile, India experienced one of the world’s tightest lockdowns and will see a large GDP drop in 2020. The decline has exacerbated inequality, as school closures disrupt meal programmes and prompt dropouts by disadvantaged children. While the economy is forecast to grow from 2021-2022, it may take almost two years for GDP to fully recover.
Out of the countries measured in OECD’s forecast, Argentina will see the biggest GDP decline in 2021. Rising unemployment and inflationary pressures have contributed to the decline.
New Zealand’s GDP loss was similar to the OECD average, despite a larger drop in mobility, from the last quarter of 2019 to the second quarter of 2020. A recovery will partially depend on travel restrictions, as tourism accounted for 20% of the country’s total employment in 2019.
A Fragile Recovery
Considerable uncertainty about near-term GDP projections remain—$7 trillion of uncertainty, to be exact.
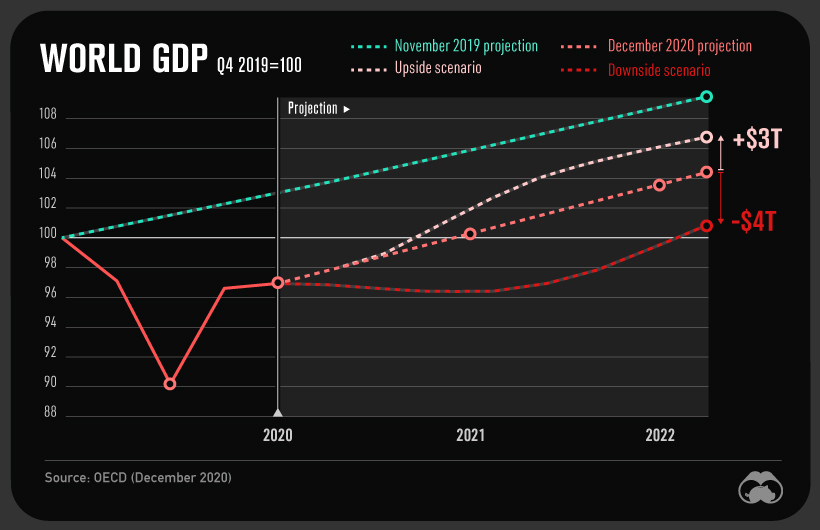
A downside scenario would be caused by delayed vaccinations or new outbreaks, and would lead to a $4 trillion GDP loss by 2022 compared to current projections. An upside scenario, spurred by fast vaccine rollout and boosted consumer and business confidence, could add $3 trillion to the global economy.
However, it is likely that the pandemic has caused permanent losses no matter the scenario.
As we wait for vaccines to be widely available, the OECD recommends that governments implement clear COVID-19 containment measures. While debt-to-GDP ratios have risen substantially due to stimulus packages, the organization also recommends that governments maintain strong fiscal support.
In particular, policies should be directed towards the most vulnerable, such as low-skilled workers, small businesses, and children. This may foster a more even recovery from the global recession of 2020.


Markets
U.S. Debt Interest Payments Reach $1 Trillion
U.S. debt interest payments have surged past the $1 trillion dollar mark, amid high interest rates and an ever-expanding debt burden.


U.S. Debt Interest Payments Reach $1 Trillion
This was originally posted on our Voronoi app. Download the app for free on iOS or Android and discover incredible data-driven charts from a variety of trusted sources.
The cost of paying for America’s national debt crossed the $1 trillion dollar mark in 2023, driven by high interest rates and a record $34 trillion mountain of debt.
Over the last decade, U.S. debt interest payments have more than doubled amid vast government spending during the pandemic crisis. As debt payments continue to soar, the Congressional Budget Office (CBO) reported that debt servicing costs surpassed defense spending for the first time ever this year.
This graphic shows the sharp rise in U.S. debt payments, based on data from the Federal Reserve.
A $1 Trillion Interest Bill, and Growing
Below, we show how U.S. debt interest payments have risen at a faster pace than at another time in modern history:
| Date | Interest Payments | U.S. National Debt |
|---|---|---|
| 2023 | $1.0T | $34.0T |
| 2022 | $830B | $31.4T |
| 2021 | $612B | $29.6T |
| 2020 | $518B | $27.7T |
| 2019 | $564B | $23.2T |
| 2018 | $571B | $22.0T |
| 2017 | $493B | $20.5T |
| 2016 | $460B | $20.0T |
| 2015 | $435B | $18.9T |
| 2014 | $442B | $18.1T |
| 2013 | $425B | $17.2T |
| 2012 | $417B | $16.4T |
| 2011 | $433B | $15.2T |
| 2010 | $400B | $14.0T |
| 2009 | $354B | $12.3T |
| 2008 | $380B | $10.7T |
| 2007 | $414B | $9.2T |
| 2006 | $387B | $8.7T |
| 2005 | $355B | $8.2T |
| 2004 | $318B | $7.6T |
| 2003 | $294B | $7.0T |
| 2002 | $298B | $6.4T |
| 2001 | $318B | $5.9T |
| 2000 | $353B | $5.7T |
| 1999 | $353B | $5.8T |
| 1998 | $360B | $5.6T |
| 1997 | $368B | $5.5T |
| 1996 | $362B | $5.3T |
| 1995 | $357B | $5.0T |
| 1994 | $334B | $4.8T |
| 1993 | $311B | $4.5T |
| 1992 | $306B | $4.2T |
| 1991 | $308B | $3.8T |
| 1990 | $298B | $3.4T |
| 1989 | $275B | $3.0T |
| 1988 | $254B | $2.7T |
| 1987 | $240B | $2.4T |
| 1986 | $225B | $2.2T |
| 1985 | $219B | $1.9T |
| 1984 | $205B | $1.7T |
| 1983 | $176B | $1.4T |
| 1982 | $157B | $1.2T |
| 1981 | $142B | $1.0T |
| 1980 | $113B | $930.2B |
| 1979 | $96B | $845.1B |
| 1978 | $84B | $789.2B |
| 1977 | $69B | $718.9B |
| 1976 | $61B | $653.5B |
| 1975 | $55B | $576.6B |
| 1974 | $50B | $492.7B |
| 1973 | $45B | $469.1B |
| 1972 | $39B | $448.5B |
| 1971 | $36B | $424.1B |
| 1970 | $35B | $389.2B |
| 1969 | $30B | $368.2B |
| 1968 | $25B | $358.0B |
| 1967 | $23B | $344.7B |
| 1966 | $21B | $329.3B |
Interest payments represent seasonally adjusted annual rate at the end of Q4.
At current rates, the U.S. national debt is growing by a remarkable $1 trillion about every 100 days, equal to roughly $3.6 trillion per year.
As the national debt has ballooned, debt payments even exceeded Medicaid outlays in 2023—one of the government’s largest expenditures. On average, the U.S. spent more than $2 billion per day on interest costs last year. Going further, the U.S. government is projected to spend a historic $12.4 trillion on interest payments over the next decade, averaging about $37,100 per American.
Exacerbating matters is that the U.S. is running a steep deficit, which stood at $1.1 trillion for the first six months of fiscal 2024. This has accelerated due to the 43% increase in debt servicing costs along with a $31 billion dollar increase in defense spending from a year earlier. Additionally, a $30 billion increase in funding for the Federal Deposit Insurance Corporation in light of the regional banking crisis last year was a major contributor to the deficit increase.
Overall, the CBO forecasts that roughly 75% of the federal deficit’s increase will be due to interest costs by 2034.

-

 Green2 weeks ago
Ranked: Top Countries by Total Forest Loss Since 2001
-

 Travel1 week ago
Ranked: The World’s Top Flight Routes, by Revenue
-

 Technology2 weeks ago
Ranked: Semiconductor Companies by Industry Revenue Share
-

 Money2 weeks ago
Which States Have the Highest Minimum Wage in America?
-

 Real Estate2 weeks ago
Ranked: The Most Valuable Housing Markets in America
-

 Markets2 weeks ago
Charted: Big Four Market Share by S&P 500 Audits
-

 AI2 weeks ago
The Stock Performance of U.S. Chipmakers So Far in 2024
-

 Automotive2 weeks ago
Almost Every EV Stock is Down After Q1 2024