Politics
The Global Inequality Gap, and How It’s Changed Over 200 Years
How the Global Inequality Gap Has Changed In 200 Years
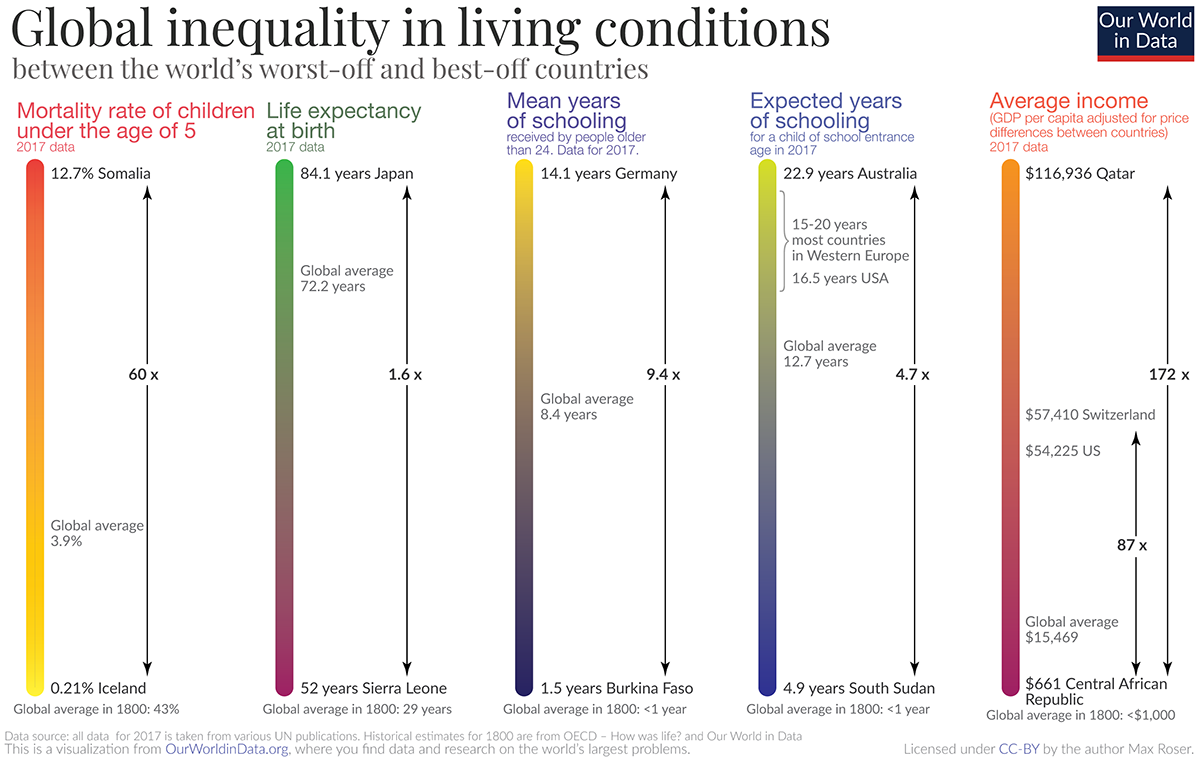
What makes a person healthy, wealthy, and wise? The UN’s Human Development Index (HDI) measures this by one’s life expectancy, average income, and years of education.
However, the value of each metric varies greatly depending on where you live. Today’s data visualization from Max Roser at Our World in Data summarizes five basic dimensions of development across countries—and how our average standards of living have evolved since 1800.
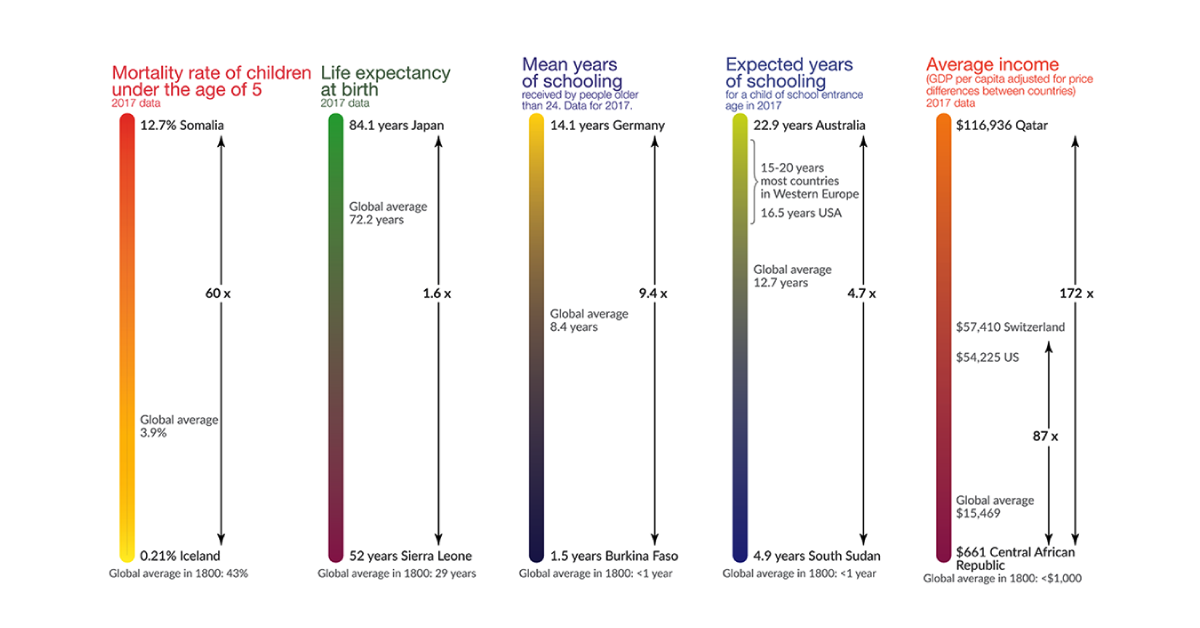
Health: Mortality Rates and Life Expectancy
Child mortality rates and life expectancy at birth are telltale signs of a country’s overall standard of living, as they indicate a population’s ability to access healthcare services.
Iceland stood at the top of these ranks in 2017, with only a 0.21% mortality rate for children under five years old. On the other end of the spectrum, Somalia had the highest child mortality rate of 12.7%—over three times the current global average.
While there’s a stark contrast between the best and worst performing countries, it’s clear that even Somalia has made significant strides since 1800. At that time, the global average child mortality rate was a whopping 43%.
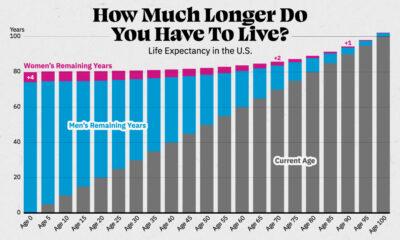
Lower child mortality is also tied to higher life expectancy. In 1800, the average life expectancy was that of today’s millennial—only 29 years old:
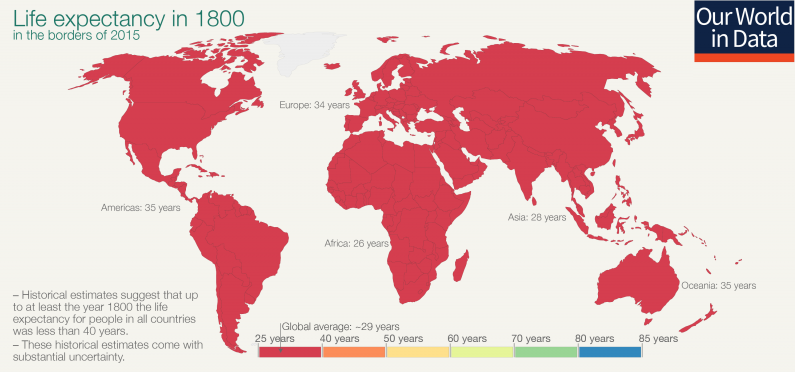
Today, the global average has shot up to 72.2 years, with areas like Japan exceeding this benchmark by more than a decade.
Education: Mean and Expected Years of Schooling
Education levels are measured in two distinct ways:
- Mean years: the average number of years a person aged 25+ receives in their lifetime
- Expected years: the total years a 2-year old child is likely to spend in school
In the 1800s, the mean and expected years of education were both less than a year—only 78 days to be precise. Low attendance rates occurred because children were expected to work during harvests, or contracted long-term illnesses that kept them at home.
Since then, education levels have drastically improved:
| Mean Years of Schooling | Expected Years of schooling | |
|---|---|---|
| Highest | Germany 🇩🇪: 14.1 years | Australia 🇦🇺: 22.9 years |
| Lowest | Burkina Faso 🇧🇫: 1.5 years | South Sudan 🇸🇸: 4.9 years |
| Global Average | 8.4 years | 12.7 years |
Research shows that investing in education can greatly narrow the inequality gap. Just one additional year of school can:
- Raise a person’s income by up to 10%
- Raise average annual GDP growth by 0.37%
- Reduce the probability of motherhood by 7.3%
- Reduce the likelihood of child marriage by >5 percentage points
Education has a strong correlation with individual wealth, which cascades into national wealth. Not surprisingly, average income has ballooned significantly in two centuries as well.
Wealth: Average GDP Per Capita
Global inequality levels are the most stark when it comes to GDP per capita. While the U.S. stands at $54,225 per person in 2017, resource-rich Qatar brings in more than double this amount—an immense $116,936 per person.
The global average GDP per capita is $15,469, but inequality heavily skews the bottom end of these values. In the Central African Republic, GDP per capita is only $661 today—similar to the average income two hundred years ago.
A Virtuous Cycle
These measures of development clearly feed into one another. Rising life expectancies are an indication of a society’s growing access to healthcare options. Compounded with more years of education, especially for women, this has had a ripple effect on declining fertility rates, contributing to higher per capita incomes.
People largely agree on what goes into human well-being: life, health, sustenance, prosperity, peace, freedom, safety, knowledge, leisure, happiness… If they have improved over time, that, I submit, is progress.
As technology accelerates the pace of change across these indicators, will the global inequality gap narrow more, or expand even wider?


War
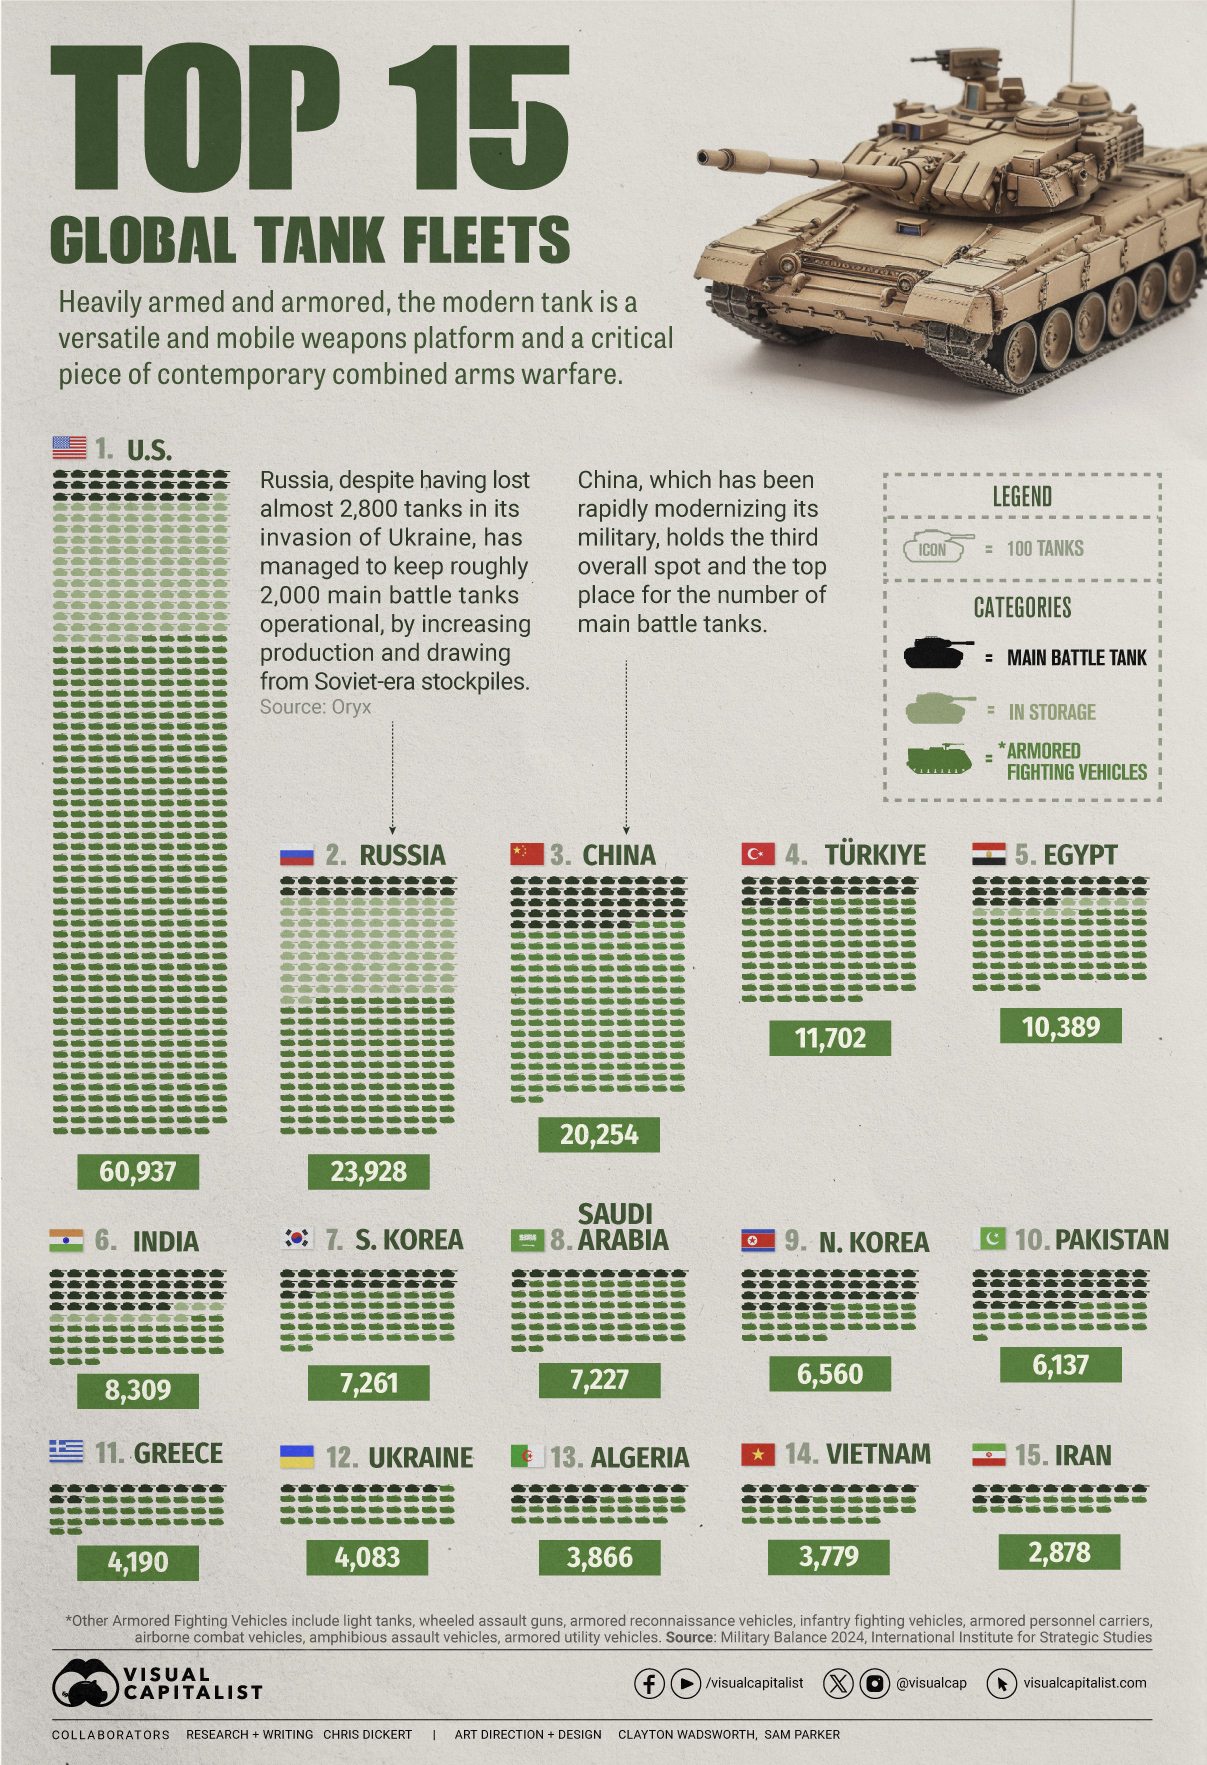
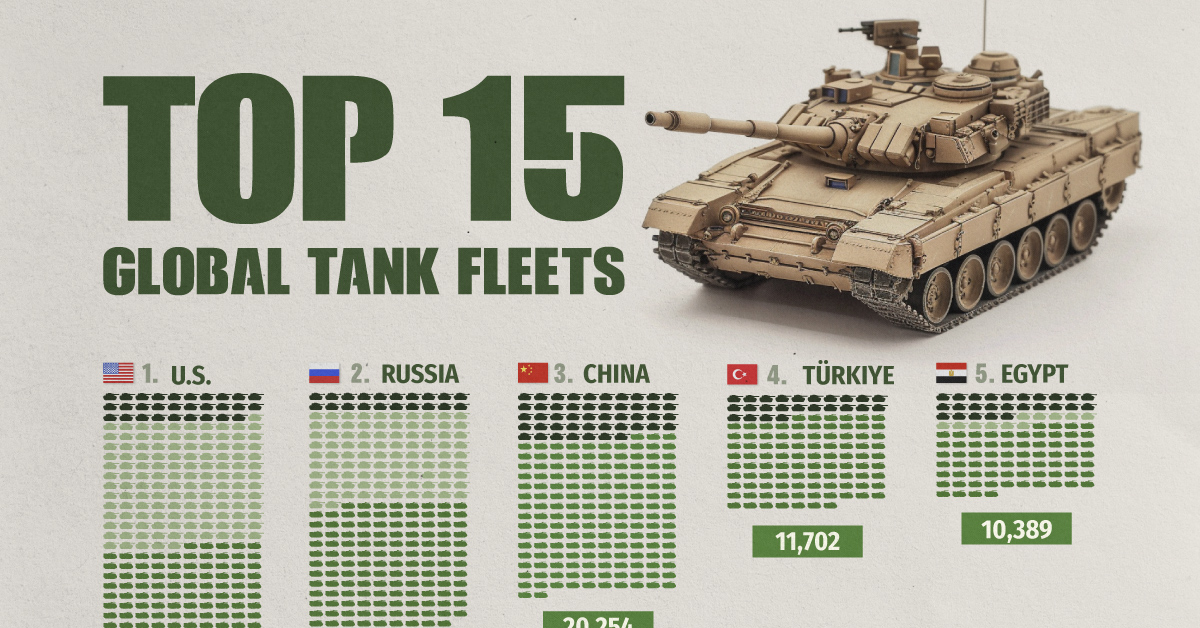
Visualized: Top 15 Global Tank Fleets
Heavily armed and armored, the modern tank is a versatile and mobile weapons platform, and a critical piece of contemporary warfare.
The Top 15 Global Tank Fleets
This was originally posted on our Voronoi app. Download the app for free on iOS or Android and discover incredible data-driven charts from a variety of trusted sources.
Heavily armed and armored, the modern tank is a versatile and mobile weapons platform, and a critical piece of contemporary warfare.
This visualization shows the top 15 global tank fleets, using data from the 2024 Military Balance report from the International Institute for Strategic Studies (IISS).
Let’s take an in-depth look at the top three fleets:
1. United States
As the world’s pre-eminent military power, it’s perhaps no surprise that the United States also has the largest tank fleet, by a wide margin.
In total, they have just over 45,000 armored fighting vehicles in operation, along with 2,640 main battle tanks (MBTs), and 12,800 vehicles in storage, of which 2,000 are main battle tanks.
| Category | Vehicles | Global rank |
|---|---|---|
| Main battle tanks | 2,640 | 4 |
| Armored reconnaissance | 1,745 | 1 |
| Infantry fighting vehicles | 3,262 | 3 |
| Armored personnel carriers | 10,644 | 1 |
| Amphibious assault vehicles | 1,401 | 1 |
| Armored utility vehicles | 28,445 | 1 |
| Storage | 12,800 | 1 |
| Total | 60,937 | 1 |
The U.S. is internalizing the lessons from the ongoing invasion of Ukraine, where Western-supplied anti-tank weapons and massed Ukrainian artillery have been cutting Russian tanks to pieces. As a result, the U.S. recently canceled an upgrade of the M1 Abrams in favor of a more ambitious upgrade.
Meanwhile, the U.S. is nervously eyeing a more confident China and a potential clash over Taiwan, where air and naval forces will be critical. However, a recent war game showed that Taiwanese mechanized ground forces, kitted out with American-made tanks and armored fighting vehicles, were critical in keeping the island autonomous.
2. Russia
According to Oryx, a Dutch open-source intelligence defense website, at time of writing, Russia has lost almost 2,800 main battle tanks since invading Ukraine. Considering that in the 2022 edition of the Military Balance, Russia was estimated to have 2,927 MBTs in operation, those are some hefty losses.
Russia has been able to maintain about 2,000 MBTs in the field, in part, by increasing domestic production. Many defense plants have been taken over by state-owned Rostec and now operate around the clock. Russia is also now spending a full third of their budget on defense, equivalent to about 7.5% of GDP.
At the same time, they’ve also been drawing down their Soviet-era stockpiles, which are modernized before being sent to the front. Just how long they can keep this up is an open question; their stockpiles are large, but not limitless. Here is what their storage levels look like:
| Category | 2023 | 2024 | YOY change |
|---|---|---|---|
| Main battle tanks | 5,000 | 4,000 | -20.0% |
| Armored reconnaissance | 1,000 | 100 | -90.0% |
| Infantry fighting vehicles | 4,000 | 2,800 | -30.0% |
| Armored personnel carriers | 6,000 | 2,300 | -61.7% |
| Total | 16,000 | 9,200 | -42.5% |
3. China
China holds the third overall spot and top place globally for the number of main battle tanks in operation. Untypically, the People’s Liberation Army has no armored vehicles in storage, which perhaps isn’t surprising when you consider that China has been rapidly modernizing its military and that stockpiles usually contain older models.
China also has one of the world’s largest fleets of armored fighting vehicles, second only to the United States. Breaking down that headline number, we can also see that they have the largest number of light tanks, wheeled guns, and infantry fighting vehicles.
| Category | Vehicles | Global rank |
|---|---|---|
| Main battle tanks | 4,700 | 1 |
| Light tanks | 1,330 | 1 |
| Wheeled guns | 1,250 | 1 |
| Infantry fighting vehicles | 8,200 | 1 |
| Armored personnel carriers | 3,604 | 5 |
| Airborne combat vehicles | 180 | 2 |
| Amphibious assault vehicles | 990 | 2 |
| Total | 20,254 | 3 |
This is equipment that would be integral if China were to make an attempt to reunify Taiwan with the mainland by force, where lightly armored mechanized units need to move with speed to occupy the island before Western allies can enter the fray. It’s worth noting that China also has one of the world’s largest fleets of amphibious assault vehicles.
End of the Tank?
Many commentators at the outset of Russia’s invasion of Ukraine, were quick to predict the end of the tank, however, to paraphrase Mark Twain, reports of the tank’s demise are greatly exaggerated.
With the U.S. and China both developing remote and autonomous armored vehicles, tanks could be quite different in the future, but there is nothing else that matches them for firepower, mobility, and survivability on the modern battlefield today.

-

 Green1 week ago
Ranked: The Countries With the Most Air Pollution in 2023
-

 Automotive2 weeks ago
Almost Every EV Stock is Down After Q1 2024
-

 AI2 weeks ago
The Stock Performance of U.S. Chipmakers So Far in 2024
-

 Markets2 weeks ago
Charted: Big Four Market Share by S&P 500 Audits
-

 Real Estate2 weeks ago
Ranked: The Most Valuable Housing Markets in America
-

 Money2 weeks ago
Which States Have the Highest Minimum Wage in America?
-

 AI2 weeks ago
Ranked: Semiconductor Companies by Industry Revenue Share
-

 Travel2 weeks ago
Ranked: The World’s Top Flight Routes, by Revenue