Economy
How Global Health and Wealth Has Changed Over Two Centuries
How Global Health and Wealth Has Changed Over 221 Years
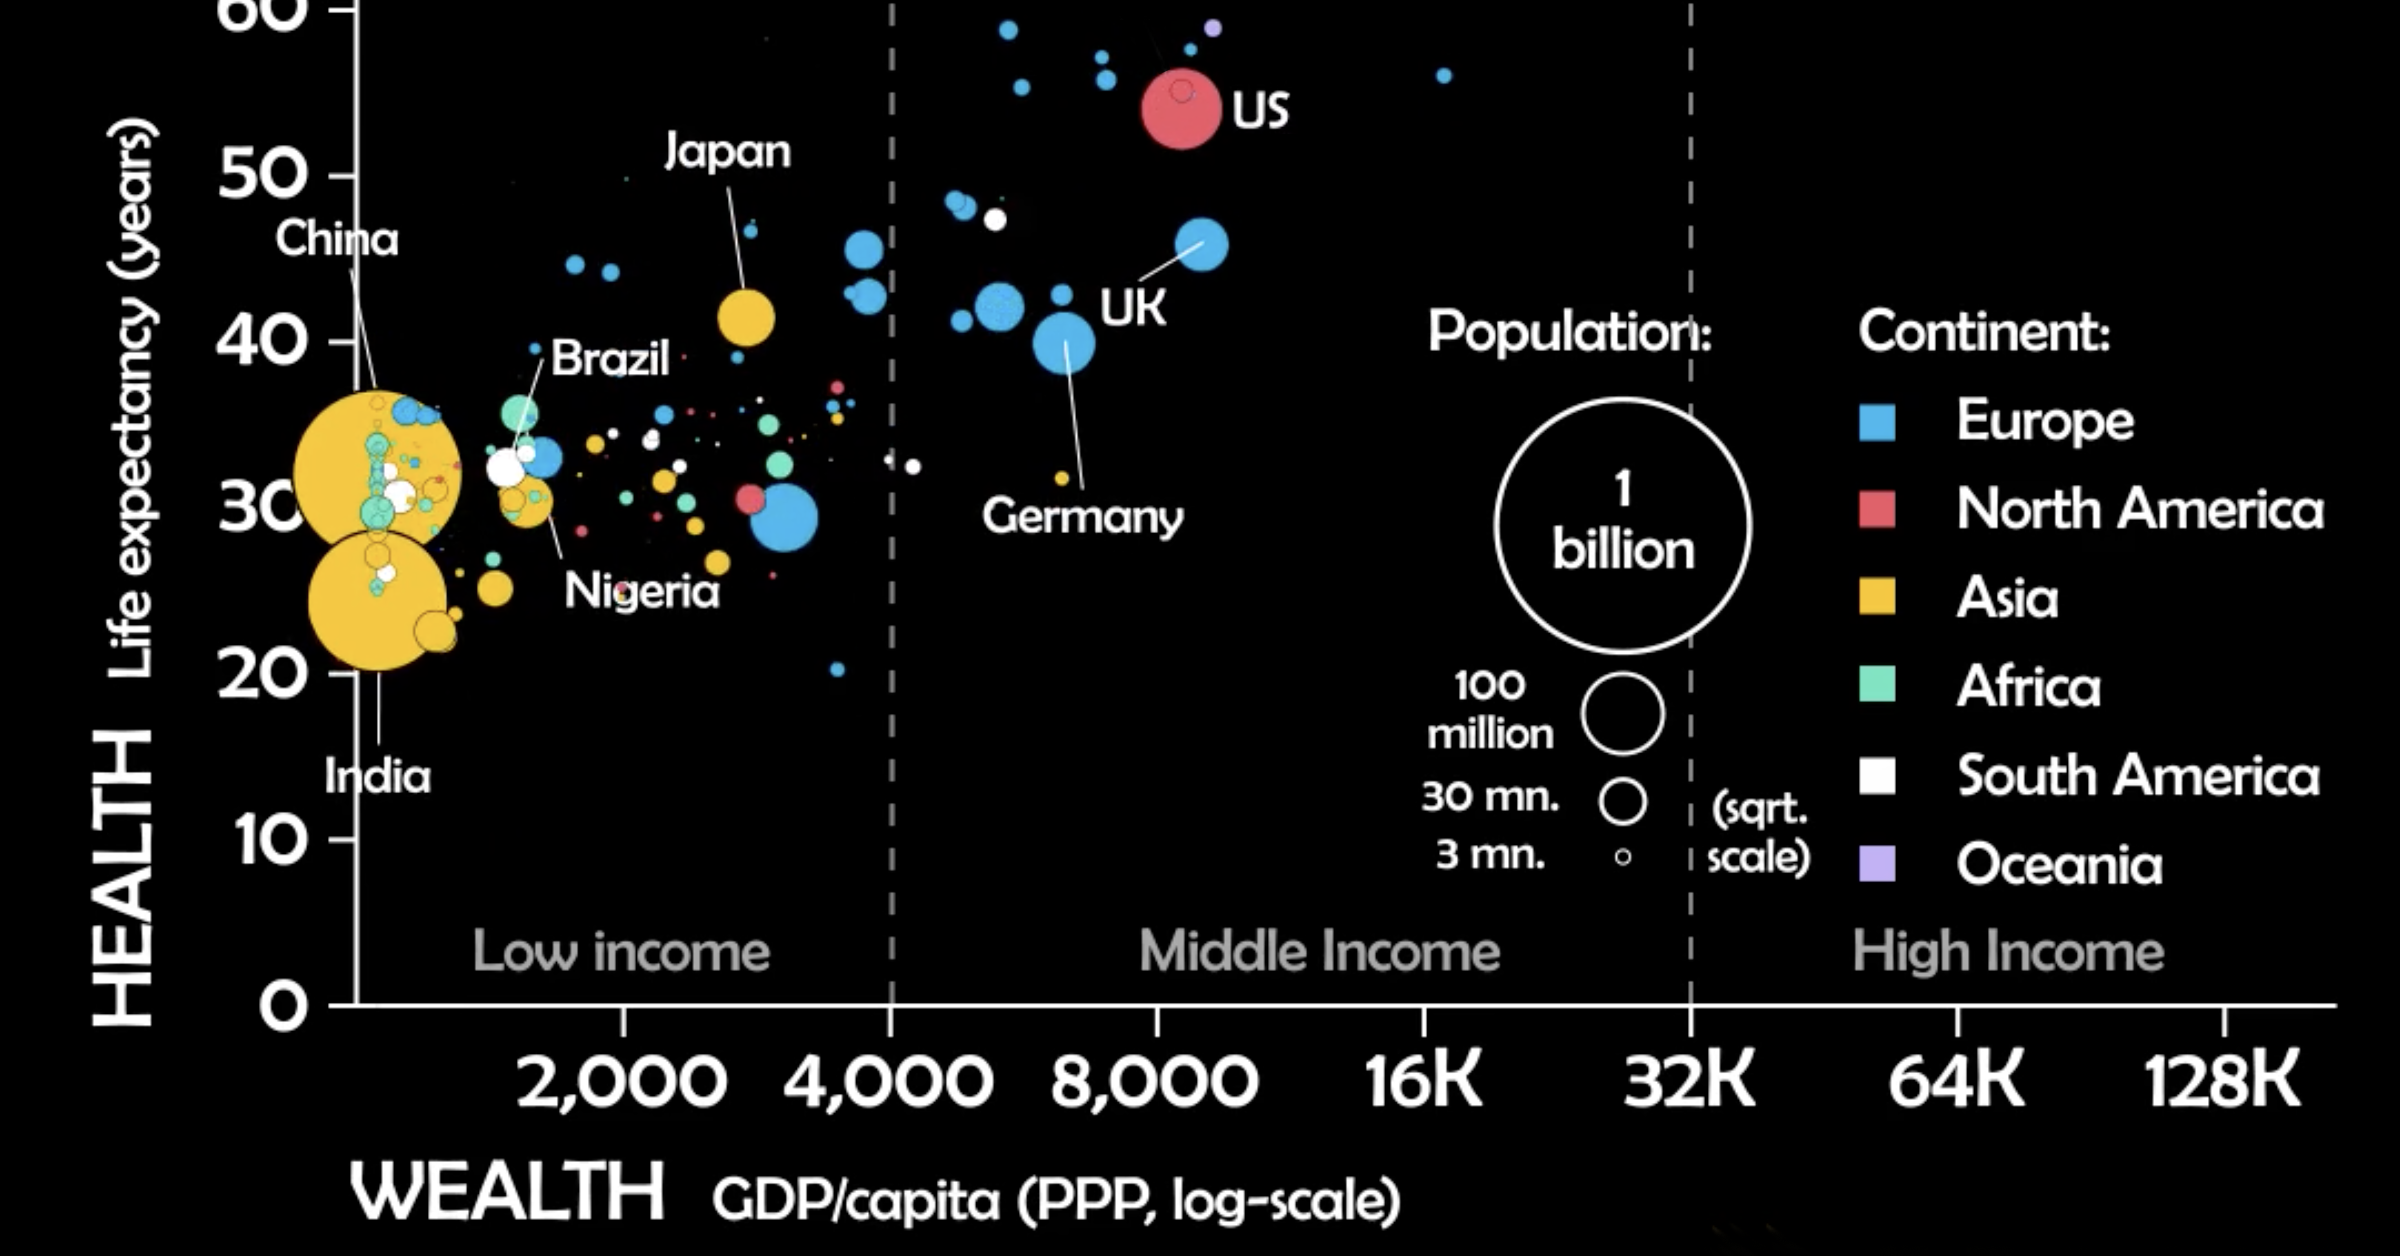
At the dawn of the 19th century, global life expectancy was only 28.5 years.
Outbreaks, war, and famine would still kill millions of people at regular intervals. These issues are still stubbornly present in 21st century society, but broadly speaking, the situation around the world has vastly improved. Today, most of humanity lives in countries where the life expectancy is above the typical retirement age of 65.
At the same time, while inequality remains a hot button topic within countries, income disparity between countries is slowing beginning to narrow.
This animated visualization, created by James Eagle, tracks the evolution of health and wealth factors in countries around the world. For further exploration, Gapminder also has a fantastic interactive chart that showcases the same dataset.
The Journey to the Upper-Right Quadrant
In general terms, history has seen health practices improve and countries become increasingly wealthy–trends that are reflected in this visualization. In fact, most countries drift towards the upper-right quadrant over the 221 years covered in the dataset.
However, that path to the top-right, which indicates high levels of both life expectancy and GDP per capita, is rarely a linear journey. Here are some of the noteworthy events and milestones to watch out for while viewing the animation.
1880s: Breaking the 50-Year Barrier
In the late 19th century, Nordic countries such as Sweden and Norway already found themselves past the 50-year life expectancy mark. This was a significant milestone considering the global life expectancy was a full 20 years shorter at the time. It wasn’t until the year 1960 that the global life expectancy would catch up.
1918: The Spanish Flu and WWI
At times, a confluence of factors can impact health and wealth in countries and regions. In this case, World War I coincided with one of the deadliest pandemics in history, leading to global implications. In the animation, this is abundantly clear as the entire cluster of circles takes a nose dive for a short period of time.
1933, 1960: Communist Famines
At various points in history, human decisions can have catastrophic consequences. This was the case in the Soviet Union (1933) and the People’s Republic of China (1960), where life expectancy plummeted during famines that killed millions of people. These extreme events are easy to spot in the animation due to the large populations of the countries in question.
1960s: Oil Economies Kick into High Gear
During this time, Iran, Iraq, and Saudi Arabia all experience massive booms in wealth, and in the following decade, smaller countries such as the United Arab Emirates and Kuwait rocket to the right edge of the visualization.
In following decades, both Iran and Iraq can be seen experiencing wild fluctuations in both health and wealth as regime changes and conflict begin to destabilize the region.
1990s: AIDS in Africa
In the animation, a number of countries plummet in unison at the end of the 20th century. These are sub-Saharan African countries that were hit hard by the AIDS pandemic. At its peak in the early ’00s, the disease accounted for more than half of deaths in some countries.
1995: Breaking the 65-Year Barrier
Global life expectancy reaches retirement age. At this point in time, there is a clear divide in both health and wealth between African and South Asian countries and the rest of the world. Thankfully, that gap is would continue to narrow in coming years.
1990-2000s: China’s Economic Rise
With a population well over a billion people, it’s impossible to ignore China in any global overview. Starting from the early ’90s, China begins its march from the left to right side of the chart, highlighting the unprecedented economic growth it experienced during that time.
What the Future Holds
If current trends continue, global life expectancy is expected to surpass the 80-year mark by 2100. And, sub-Saharan Africa, which has the lowest life expectancy today, is expected to mostly close the gap, reaching 75 years of age.
Wealth is also expected to increase nearly across the board, with the biggest gains coming from places like Vietnam, Nigeria, and the Philippines. Some experts are projecting the world economy as a whole to double in size by 2050.
There are always bumps along the way, but it appears that the journey to the upper-right quadrant is still very much underway.


Copper
Brass Rods: The Secure Choice
This graphic shows why brass rods are the secure choice for precision-machined and forged parts.


Brass Rods: The Secure Choice
The unique combination of machinability and recyclability makes brass rods the secure choice for manufacturers seeking future-proof raw material solutions.
This infographic, from the Copper Development Association, shows three ways brass rods give manufacturers greater control and a license to grow in the competitive market for precision-machined and forged products.
Future-Proof Investments in New Machine Tools
A material’s machinability directly impacts machine throughput, which typically has the largest impact on machine shop profitability.
The high-speed machining capabilities of brass rods maximize machine tool performance, allowing manufacturers to run the material faster and longer without sacrificing tool life, chip formation, or surface quality.
The high machining efficiency of brass leads to reduced per-part costs, quicker return on investment (ROI) for new machine tools, and expanded production capacity for new projects.
Supply Security Through Closed Loop Recycling
Brass, like its parent element copper, can be infinitely recycled.
In 2022, brass- and wire-rod mills accounted for the majority of the 830,000 tonnes of copper recycled from scrap in the United States.
Given that scrap ratios for machined parts typically range from 60-70% by weight, producing mills benefit from a secure and steady supply of clean scrap returned directly from customers, which is recycled to create new brass rods.
The high residual value of brass scrap creates a strong recycling incentive. Scrap buy back programs give manufacturers greater control over raw material net costs as scrap value is often factored into supplier purchase agreements.
Next Generation Alloys for a Lead-Free Future
Increasingly stringent global regulations continue to pressure manufacturers to minimize the use of materials containing trace amounts of lead and other harmful impurities.
The latest generation of brass-rod alloys is engineered to meet the most demanding criteria for lead leaching in drinking water and other sensitive applications.
Seven brass-rod alloys passed rigorous testing to become the only ‘Acceptable Materials’ against lower lead leaching criteria recently adopted in the national U.S. drinking water quality standard, NSF 61.
Learn more about the advantages of brass rods solutions.

-

 Base Metals1 year ago
Ranked: The World’s Largest Copper Producers
Many new technologies critical to the energy transition rely on copper. Here are the world’s largest copper producers.
-

 Silver2 years ago
Mapped: Solar Power by Country in 2021
In 2020, solar power saw its largest-ever annual capacity expansion at 127 gigawatts. Here’s a snapshot of solar power capacity by country.
-

 Batteries5 years ago
Visualizing Copper’s Role in the Transition to Clean Energy
A clean energy transition is underway as wind, solar, and batteries take center stage. Here’s how copper plays the critical role in these technologies.
-

 Science5 years ago
Everything You Need to Know on VMS Deposits
Deep below the ocean’s waves, VMS deposits spew out massive amounts of minerals like copper, zinc, and gold, making them a key source of the metals…
-
 Copper5 years ago
How Much Copper is in an Electric Vehicle?
Have you ever wondered how much copper is in an electric vehicle? This infographic shows the metal’s properties as well as the quantity of copper used.
-
 Copper6 years ago
Copper: Driving the Green Energy Revolution
Renewable energy is set to fuel a new era of copper demand – here’s how much copper is used in green applications from EVs to photovoltaics.


-

 Real Estate2 weeks ago
Visualizing America’s Shortage of Affordable Homes
-

 Technology1 week ago
Ranked: Semiconductor Companies by Industry Revenue Share
-

 Money1 week ago
Which States Have the Highest Minimum Wage in America?
-

 Real Estate1 week ago
Ranked: The Most Valuable Housing Markets in America
-

 Business2 weeks ago
Charted: Big Four Market Share by S&P 500 Audits
-

 AI2 weeks ago
The Stock Performance of U.S. Chipmakers So Far in 2024
-

 Misc2 weeks ago
Almost Every EV Stock is Down After Q1 2024
-

 Money2 weeks ago
Where Does One U.S. Tax Dollar Go?