Economy
You’re Grounded: The COVID-19 Effect on Global Flight Capacity


You’re Grounded: The COVID-19 Effect on Flight Capacity
It’s not an exaggeration to say that the COVID-19 pandemic has thrown the world into a tailspin.
As the number of new cases continues to surge in parts of the world, numbers are beginning to decline in others as public health officials and governments tirelessly work to slow the contagion and reach of the virus.
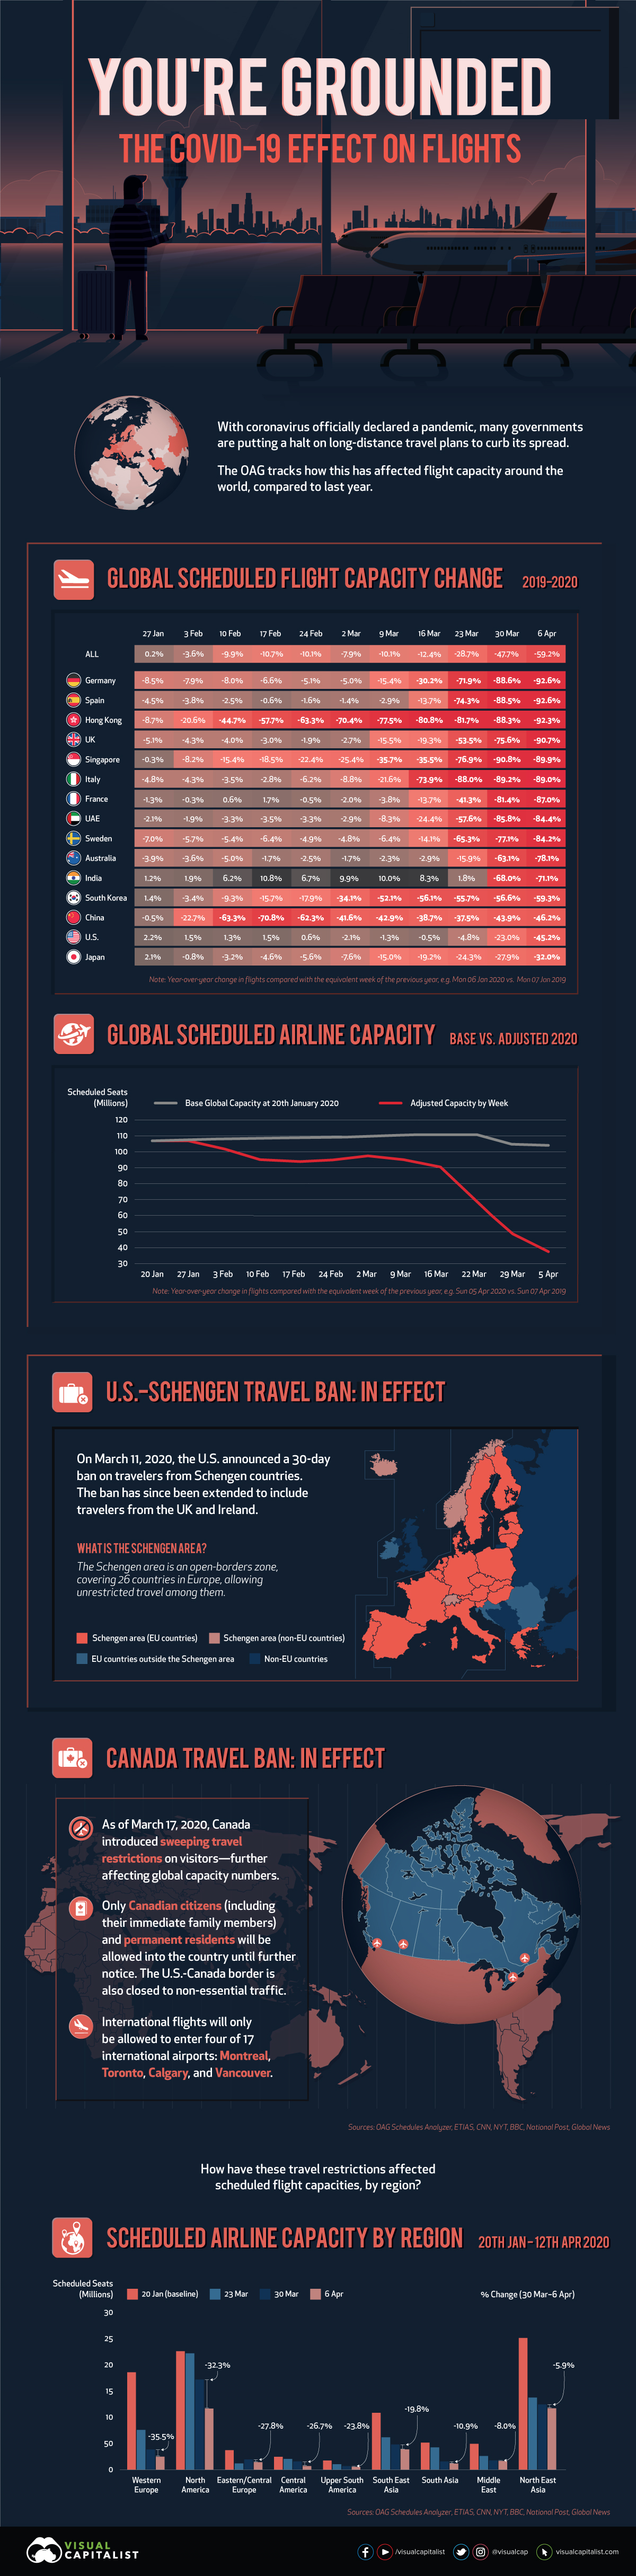
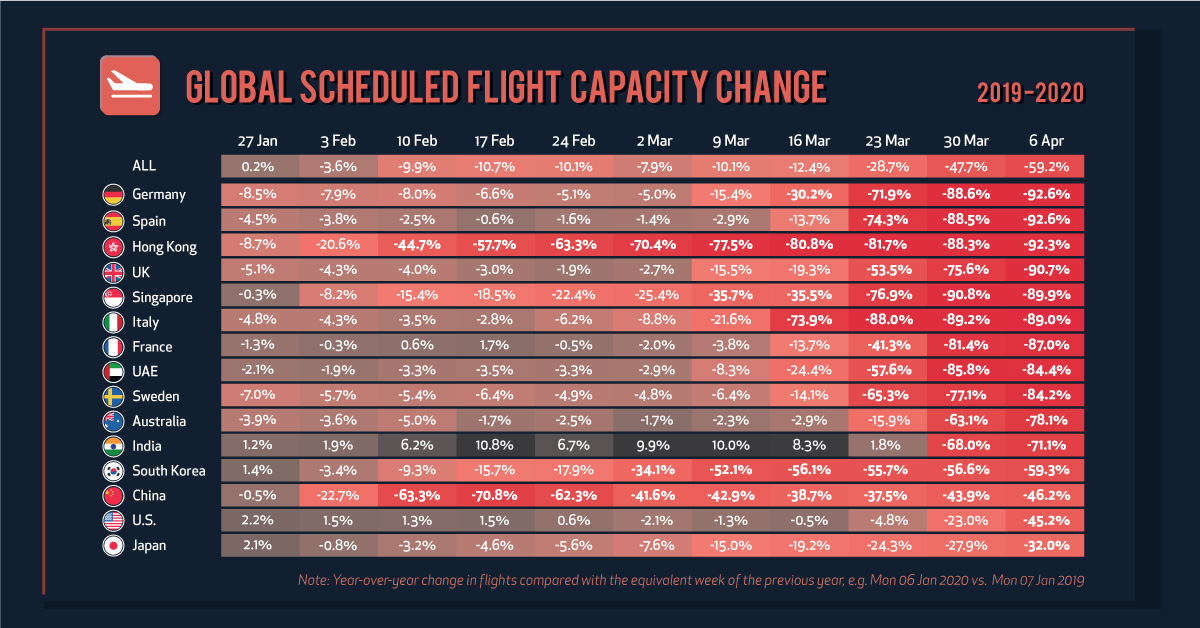
The potent combination of trip cancellations and country-specific restrictions on international flights has had a staggering impact on the $880 billion global airline industry. Today’s visualization highlights data from the OAG Aviation Worldwide, which tracks how global flight capacity differs from last year’s numbers.
Note: this post has been updated on April 7, 2020 to reflect the latest data.
Asia Faced the First Hard Landing
Nearly all countries have some type of travel advisory in place, with many encouraging people to avoid non-essential travel even before COVID-19 was officially considered a pandemic by the World Health Organization (WHO).
The earliest impacts of these were felt in February, as flight capacity in and out of China dropped sharply around Lunar New Year. Also, the country’s sharpest year-over-year drop was recorded on February 17, 2020, with a 71% drop in flights compared to the same date in 2019. However, there’s some good news: life in China is slowly returning back to normal, as Wuhan eases its lockdown after almost two and a half months.
Flight capacity for Hong Kong, which was already seeing its traveler numbers declining due to months-long protests, continues its slump. As of April 6, 2020, scheduled flights were down by an immense 92.3% compared to 2019—the most of any Asian jurisdiction represented in the data.
India showed one of the most drastic declines, from 1.8% down to -68% on March 30, 2020. This resulted from a 21-day lockdown order on March 24, 2020—with only four hours of notice for its 1.3 billion citizens.
Monitoring the Situation Elsewhere
Meanwhile in Europe, Italy saw a 22% drop in flights coinciding with the announcement of a national lockdown March 9, 2020. Now that the situation has intensified, flights to and from Italy have plummeted 89% from their normal rates.
Germany and Spain are seeing the highest declines in scheduled flights worldwide, with approximately 92.6% less capacity as of April 6, 2020. Flight capacity in the region has plummeted thanks to widespread restrictions.
On March 11, 2020, the U.S. enforced a 30-day ban on travelers from the Schengen Area, a free-travel zone consisting of 26 countries in Europe, and has since extended to include the UK and Ireland. As a result, U.S. flight capacity is beginning its descent, dropping 45.2% by April 6, 2020 as the ban may be extended, and to even more countries.
Meanwhile, as of March 17, the U.S.-Canada border is closed for all non-essential travel. This follows a previous announcement from the Canadian government that it would be curbing entry to only Canadian citizens, family members, permanent residents, diplomats, and Americans.
Broadly speaking, countries around the world are taking similar actions to limit the spread of the virus and “flatten the curve”:
| Measure Taken | Example Countries* |
|---|---|
| Suspending flights from specific countries | 🇺🇸United States, 🇹🇷Turkey |
| Returning citizens must enter through specific airports | 🇨🇦Canada, 🇺🇸United States |
| Mandatory screening | 🇮🇹Italy, 🇧🇴Bolivia |
| 14 day self-quarantine | 🇮🇱Israel, 🇬🇷Greece |
| Complete closure of borders | 🇬🇹Guatemala, 🇵🇪Peru |
*As of March 17, 2020
More Turbulent Times Ahead?
As both COVID-19 and the global response to it continues to evolve, here are the largest flight capacity reductions across different regions in the past few weeks, compared to a baseline from Jan 20, 2020:
| Region | 20 Jan 2020 Flights | 23 Mar 2020 Flights | 30 Mar 2020 Flights | 06 Apr 2020 Flights | % Change (6 Apr vs 30 Mar) |
|---|---|---|---|---|---|
| Western Europe | 18,606,424 | 7,595,264 | 3,840,536 | 2,476,034 | -35.5% |
| North America | 22,644,121 | 22,236,625 | 17,221,751 | 11,658,243 | -32.3% |
| Eastern/Central Europe | 3,701,241 | 1,176,139 | 1,930,546 | 1,393,600 | -27.8% |
| Central America | 2,444,383 | 2,040,677 | 1,548,458 | 1,135,163 | -26.7% |
| Upper South America | 1,737,713 | 1,011,930 | 673,016 | 513,056 | -23.8% |
| Southeast Asia | 10,866,623 | 6,177,093 | 4,810,945 | 3,856,977 | -19.8% |
| South Asia | 5,160,958 | 4,245,635 | 1,538,918 | 1,371,156 | -10.9% |
| Middle East | 4,930,030 | 2,580,466 | 1,760,809 | 1,619,546 | -8.0% |
| Northeast Asia | 25,278,594 | 13,782,879 | 12,465,267 | 11,730,667 | -5.9% |
Source: OAG
Naturally, the economic impact on airlines has been immense. Many airlines worldwide face the threat of bankruptcy in coming months, if these declining trends continue. To hedge against these domino effects of the outbreak, U.S. airlines are requesting upwards of $60 billion in bailouts and direct assistance from the government.
COVID-19 is throwing everything up in the air—including the fate of airline companies. It’s not yet clear when these stringent travel restrictions may be lifted, but one can only hope that these airlines do not have to continue to weather the storm much longer.


Copper
Brass Rods: The Secure Choice
This graphic shows why brass rods are the secure choice for precision-machined and forged parts.


Brass Rods: The Secure Choice
The unique combination of machinability and recyclability makes brass rods the secure choice for manufacturers seeking future-proof raw material solutions.
This infographic, from the Copper Development Association, shows three ways brass rods give manufacturers greater control and a license to grow in the competitive market for precision-machined and forged products.
Future-Proof Investments in New Machine Tools
A material’s machinability directly impacts machine throughput, which typically has the largest impact on machine shop profitability.
The high-speed machining capabilities of brass rods maximize machine tool performance, allowing manufacturers to run the material faster and longer without sacrificing tool life, chip formation, or surface quality.
The high machining efficiency of brass leads to reduced per-part costs, quicker return on investment (ROI) for new machine tools, and expanded production capacity for new projects.
Supply Security Through Closed Loop Recycling
Brass, like its parent element copper, can be infinitely recycled.
In 2022, brass- and wire-rod mills accounted for the majority of the 830,000 tonnes of copper recycled from scrap in the United States.
Given that scrap ratios for machined parts typically range from 60-70% by weight, producing mills benefit from a secure and steady supply of clean scrap returned directly from customers, which is recycled to create new brass rods.
The high residual value of brass scrap creates a strong recycling incentive. Scrap buy back programs give manufacturers greater control over raw material net costs as scrap value is often factored into supplier purchase agreements.
Next Generation Alloys for a Lead-Free Future
Increasingly stringent global regulations continue to pressure manufacturers to minimize the use of materials containing trace amounts of lead and other harmful impurities.
The latest generation of brass-rod alloys is engineered to meet the most demanding criteria for lead leaching in drinking water and other sensitive applications.
Seven brass-rod alloys passed rigorous testing to become the only ‘Acceptable Materials’ against lower lead leaching criteria recently adopted in the national U.S. drinking water quality standard, NSF 61.
Learn more about the advantages of brass rods solutions.

-

 Base Metals1 year ago
Ranked: The World’s Largest Copper Producers
Many new technologies critical to the energy transition rely on copper. Here are the world’s largest copper producers.
-

 Silver2 years ago
Mapped: Solar Power by Country in 2021
In 2020, solar power saw its largest-ever annual capacity expansion at 127 gigawatts. Here’s a snapshot of solar power capacity by country.
-

 Batteries5 years ago
Visualizing Copper’s Role in the Transition to Clean Energy
A clean energy transition is underway as wind, solar, and batteries take center stage. Here’s how copper plays the critical role in these technologies.
-

 Science5 years ago
Everything You Need to Know on VMS Deposits
Deep below the ocean’s waves, VMS deposits spew out massive amounts of minerals like copper, zinc, and gold, making them a key source of the metals…
-
 Copper5 years ago
How Much Copper is in an Electric Vehicle?
Have you ever wondered how much copper is in an electric vehicle? This infographic shows the metal’s properties as well as the quantity of copper used.
-
 Copper6 years ago
Copper: Driving the Green Energy Revolution
Renewable energy is set to fuel a new era of copper demand – here’s how much copper is used in green applications from EVs to photovoltaics.

-

 Markets1 week ago
Ranked: The Largest U.S. Corporations by Number of Employees
-

 Green3 weeks ago
Ranked: Top Countries by Total Forest Loss Since 2001
-

 Money2 weeks ago
Where Does One U.S. Tax Dollar Go?
-

 Automotive2 weeks ago
Almost Every EV Stock is Down After Q1 2024
-

 AI2 weeks ago
The Stock Performance of U.S. Chipmakers So Far in 2024
-

 Markets2 weeks ago
Charted: Big Four Market Share by S&P 500 Audits
-

 Real Estate2 weeks ago
Ranked: The Most Valuable Housing Markets in America
-

 Money2 weeks ago
Which States Have the Highest Minimum Wage in America?