Misc
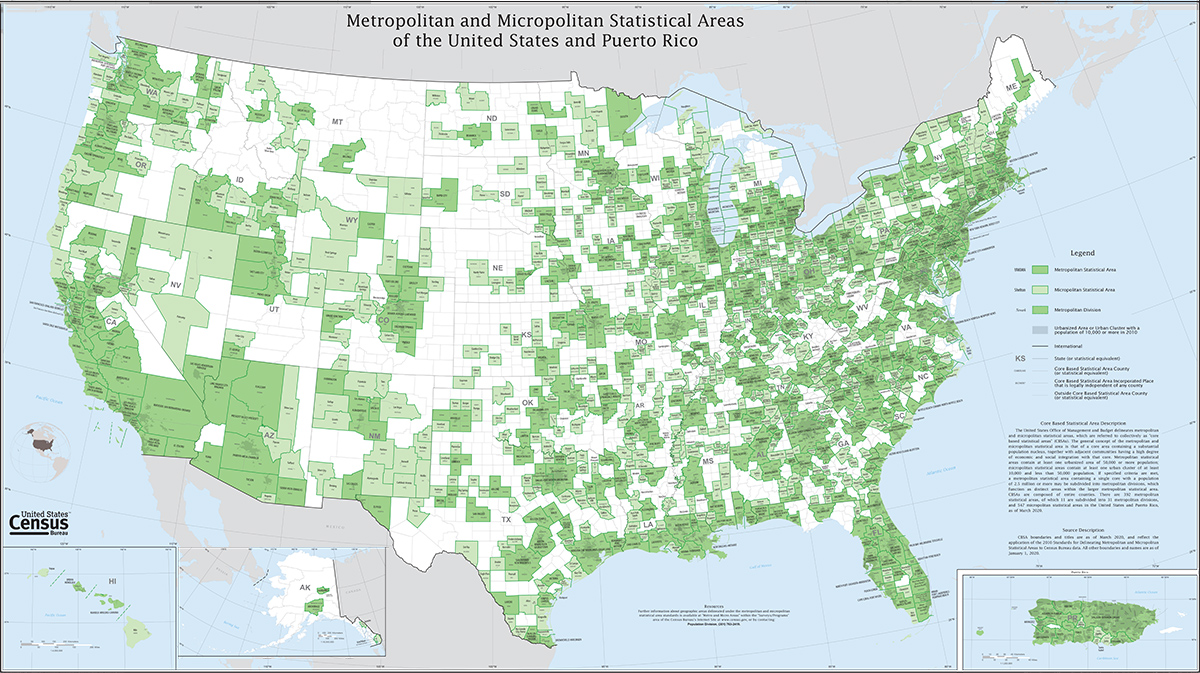
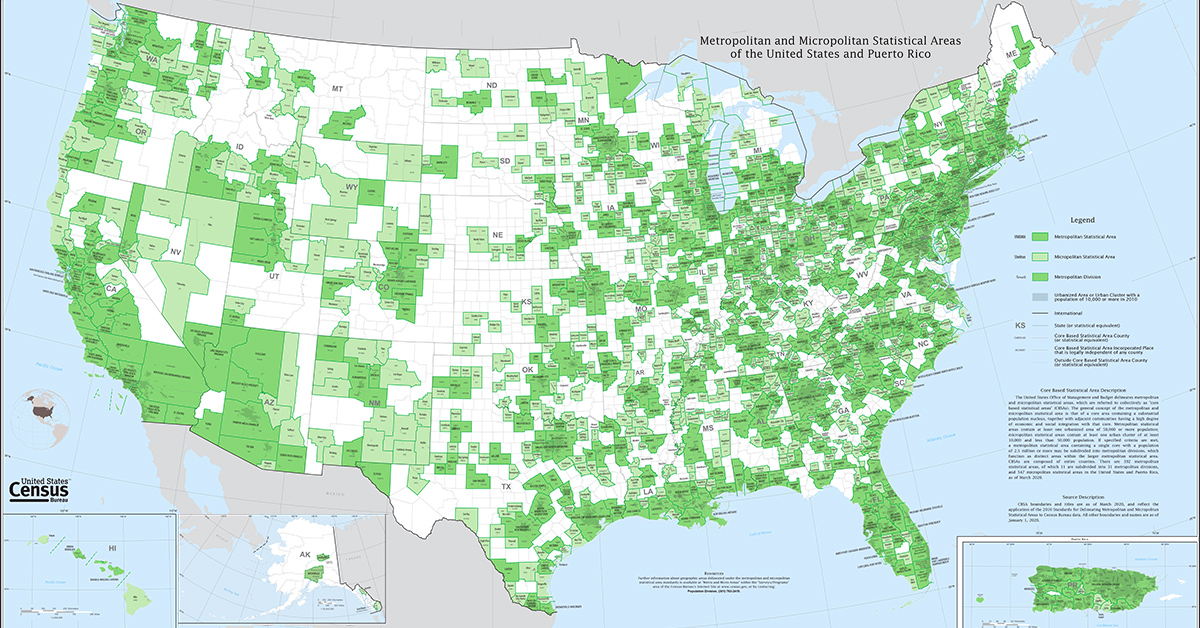
This Giant Map Shows All the Metropolitan Areas in the U.S.
This Giant Map Shows All the Metropolitan Areas in the U.S.
The United States is the third most populous country in the world, made up of close to 20,000 cities and towns, and 333 million individuals.
Dividing these population clusters into a coherent framework of statistical areas is no small feat, and the U.S. Census Bureau’s latest map shows just how complex of a task it is.
This enormous map—which covers the entire country, including Puerto Rico—includes 392 metropolitan statistical areas and 547 micropolitan statistical areas.
For reference, here are all the current metropolitan statistical areas in the United States, organized by population:
| Rank | Metropolitan statistical area | Population (2020) | Change since 2010 |
|---|---|---|---|
| 1 | New York-Newark-Jersey City, NY-NJ-PA MSA | 20,140,470 | 6.58% |
| 2 | Los Angeles-Long Beach-Anaheim, CA MSA | 13,200,998 | 2.90% |
| 3 | Chicago-Naperville-Elgin, IL-IN-WI MSA | 9,618,502 | 1.66% |
| 4 | Dallas-Fort Worth-Arlington, TX MSA | 7,637,387 | 19.96% |
| 5 | Houston-The Woodlands-Sugar Land, TX MSA | 7,122,240 | 20.30% |
| 6 | Washington-Arlington-Alexandria, DC-VA-MD-WV MSA | 6,385,162 | 13.02% |
| 7 | Philadelphia-Camden-Wilmington, PA-NJ-DE-MD MSA | 6,245,051 | 4.69% |
| 8 | Miami-Fort Lauderdale-West Palm Beach, FL MSA | 6,138,333 | 10.31% |
| 9 | Atlanta-Sandy Springs-Alpharetta, GA MSA | 6,089,815 | 15.19% |
| 10 | Boston-Cambridge-Newton, MA-NH MSA | 4,941,632 | 8.55% |
| 11 | Phoenix-Mesa-Chandler, AZ MSA | 4,845,832 | 15.57% |
| 12 | San Francisco-Oakland-Berkeley, CA MSA | 4,749,008 | 9.54% |
| 13 | Riverside-San Bernardino-Ontario, CA MSA | 4,599,839 | 8.88% |
| 14 | Detroit–Warren–Dearborn, MI MSA | 4,392,041 | 2.23% |
| 15 | Seattle-Tacoma-Bellevue, WA MSA | 4,018,762 | 16.83% |
| 16 | Minneapolis-St. Paul-Bloomington, MN-WI MSA | 3,690,261 | 10.26% |
| 17 | San Diego-Chula Vista-Carlsbad, CA MSA | 3,298,634 | 6.57% |
| 18 | Tampa-St. Petersburg-Clearwater, FL MSA | 3,175,275 | 14.09% |
| 19 | Denver-Aurora-Lakewood, CO MSA | 2,963,821 | 16.53% |
| 20 | Baltimore-Columbia-Towson, MD MSA | 2,844,510 | 4.94% |
| 21 | St. Louis, MO-IL MSA | 2,820,253 | 1.17% |
| 22 | Orlando-Kissimmee-Sanford, FL MSA | 2,673,376 | 25.25% |
| 23 | Charlotte-Concord-Gastonia, NC-SC MSA | 2,660,329 | 18.56% |
| 24 | San Antonio-New Braunfels, TX MSA | 2,558,143 | 19.40% |
| 25 | Portland-Vancouver-Hillsboro, OR-WA MSA | 2,512,859 | 12.89% |
| 26 | Sacramento-Roseville-Folsom, CA MSA | 2,397,382 | 11.55% |
| 27 | Pittsburgh, PA MSA | 2,370,930 | 0.62% |
| 28 | Austin-Round Rock-Georgetown, TX MSA | 2,283,371 | 33.04% |
| 29 | Las Vegas-Henderson-Paradise, NV MSA | 2,265,461 | 16.10% |
| 30 | Cincinnati, OH-KY-IN MSA | 2,256,884 | 5.58% |
| 31 | Kansas City, MO-KS MSA | 2,192,035 | 9.09% |
| 32 | Columbus, OH MSA | 2,138,926 | 12.46% |
| 33 | Indianapolis-Carmel-Anderson, IN MSA | 2,111,040 | 11.82% |
| 34 | Cleveland-Elyria, OH MSA | 2,088,251 | 0.53% |
| 35 | San Juan-Bayamón-Caguas, PR Metropolitan Statistical Area | 2,002,906 | -14.77% |
| 36 | San Jose-Sunnyvale-Santa Clara, CA MSA | 2,000,468 | 8.90% |
| 37 | Nashville-Davidson–Murfreesboro–Franklin, TN MSA | 1,989,519 | 20.86% |
| 38 | Virginia Beach-Norfolk-Newport News, VA-NC MSA | 1,799,674 | 5.00% |
| 39 | Providence-Warwick, RI-MA MSA | 1,676,579 | 4.73% |
| 40 | Jacksonville, FL MSA | 1,605,848 | 19.34% |
| 41 | Milwaukee-Waukesha, WI MSA | 1,574,731 | 1.21% |
| 42 | Oklahoma City, OK MSA | 1,425,695 | 13.78% |
| 43 | Raleigh-Cary, NC MSA | 1,413,982 | 25.08% |
| 44 | Memphis, TN-MS-AR MSA | 1,337,779 | 1.65% |
| 45 | Richmond, VA MSA | 1,314,434 | 10.78% |
| 46 | Louisville/Jefferson County, KY-IN MSA | 1,285,439 | 6.88% |
| 47 | New Orleans-Metairie, LA MSA | 1,271,845 | 6.89% |
| 48 | Salt Lake City, UT MSA | 1,257,936 | 15.63% |
| 49 | Hartford-East Hartford-Middletown, CT MSA | 1,213,531 | 0.09% |
| 50 | Buffalo-Niagara Falls, NY MSA | 1,166,902 | 2.76% |
| 51 | Birmingham-Hoover, AL MSA | 1,115,289 | 5.11% |
| 52 | Rochester, NY MSA | 1,090,135 | 0.97% |
| 53 | Grand Rapids-Kentwood, MI MSA | 1,087,592 | 9.45% |
| 54 | Tucson, AZ MSA | 1,043,433 | 6.44% |
| 55 | Urban Honolulu, HI MSA | 1,016,508 | 6.64% |
| 56 | Tulsa, OK MSA | 1,015,331 | 8.30% |
| 57 | Fresno, CA MSA | 1,008,654 | 8.40% |
| 58 | Worcester, MA-CT MSA | 978,529 | 6.71% |
| 59 | Omaha-Council Bluffs, NE-IA MSA | 967,604 | 11.82% |
| 60 | Bridgeport-Stamford-Norwalk, CT MSA | 957,419 | 4.43% |
| 61 | Greenville-Anderson, SC MSA | 928,195 | 12.63% |
| 62 | Albuquerque, NM MSA | 916,528 | 3.32% |
| 63 | Bakersfield, CA MSA | 909,235 | 8.29% |
| 64 | Albany-Schenectady-Troy, NY MSA | 899,262 | 3.28% |
| 65 | Knoxville, TN MSA | 879,773 | 7.96% |
| 66 | McAllen-Edinburg-Mission, TX MSA | 870,781 | 12.39% |
| 67 | Baton Rouge, LA MSA | 870,569 | 5.41% |
| 68 | El Paso, TX MSA | 868,859 | 8.05% |
| 69 | New Haven-Milford, CT MSA | 864,835 | 0.27% |
| 70 | Allentown-Bethlehem-Easton, PA-NJ MSA | 861,889 | 4.96% |
| 71 | Oxnard-Thousand Oaks-Ventura, CA MSA | 843,843 | 2.49% |
| 72 | North Port-Sarasota-Bradenton, FL MSA | 833,716 | 18.72% |
| 73 | Columbia, SC MSA | 829,470 | 8.06% |
| 74 | Dayton-Kettering, OH MSA | 814,049 | 1.85% |
| 75 | Charleston-North Charleston, SC MSA | 799,636 | 20.32% |
| 76 | Stockton, CA MSA | 779,233 | 13.71% |
| 77 | Greensboro-High Point, NC MSA | 776,566 | 7.29% |
| 78 | Boise City, ID MSA | 764,718 | 24.03% |
| 79 | Cape Coral-Fort Myers, FL MSA | 760,822 | 22.96% |
| 80 | Colorado Springs, CO MSA | 755,105 | 16.96% |
| 81 | Little Rock-North Little Rock-Conway, AR MSA | 748,031 | 6.90% |
| 82 | Lakeland-Winter Haven, FL MSA | 725,046 | 20.42% |
| 83 | Des Moines-West Des Moines, IA MSA | 709,466 | 16.98% |
| 84 | Akron, OH MSA | 702,219 | -0.14% |
| 85 | Springfield, MA MSA | 699,162 | 0.90% |
| 86 | Poughkeepsie-Newburgh-Middletown, NY MSA | 697,221 | 4.02% |
| 87 | Ogden-Clearfield, UT MSA | 694,863 | 16.36% |
| 88 | Madison, WI MSA | 680,796 | 12.45% |
| 89 | Winston-Salem, NC MSA | 675,966 | 5.52% |
| 90 | Provo-Orem, UT MSA | 671,185 | 27.41% |
| 91 | Deltona-Daytona Beach-Ormond Beach, FL MSA | 668,921 | 13.32% |
| 92 | Syracuse, NY MSA | 662,057 | -0.08% |
| 93 | Durham-Chapel Hill, NC MSA | 649,903 | 15.18% |
| 94 | Wichita, KS MSA | 647,610 | 3.94% |
| 95 | Toledo, OH MSA | 646,604 | -0.74% |
| 96 | Augusta-Richmond County, GA-SC MSA | 611,000 | 8.17% |
| 97 | Palm Bay-Melbourne-Titusville, FL MSA | 606,612 | 11.64% |
| 98 | Jackson, MS MSA | 591,978 | 0.97% |
| 99 | Harrisburg-Carlisle, PA MSA | 591,712 | 7.69% |
| 100 | Spokane-Spokane Valley, WA MSA | 585,784 | 13.80% |
| 101 | Scranton–Wilkes-Barre, PA MSA | 567,559 | 0.70% |
| 102 | Chattanooga, TN-GA MSA | 562,647 | 6.53% |
| 103 | Lancaster, PA MSA | 552,984 | 6.46% |
| 104 | Modesto, CA MSA | 552,878 | 7.47% |
| 105 | Portland-South Portland, ME MSA | 551,740 | 7.32% |
| 106 | Fayetteville-Springdale-Rogers, AR MSA | 546,725 | 24.22% |
| 107 | Lansing-East Lansing, MI MSA | 541,297 | 1.24% |
| 108 | Youngstown-Warren-Boardman, OH-PA MSA | 541,243 | -4.34% |
| 109 | Fayetteville, NC MSA | 520,378 | 8.17% |
| 110 | Lexington-Fayette, KY MSA | 516,811 | 9.47% |
| 111 | Pensacola-Ferry Pass-Brent, FL MSA | 509,905 | 13.57% |
| 112 | Huntsville, AL MSA | 491,723 | 17.75% |
| 113 | Reno, NV MSA | 490,596 | 15.32% |
| 114 | Santa Rosa-Petaluma, CA MSA | 488,863 | 1.03% |
| 115 | Myrtle Beach-Conway-North Myrtle Beach, SC-NC MSA | 487,722 | 29.46% |
| 116 | Port St. Lucie, FL MSA | 487,657 | 14.98% |
| 117 | Lafayette, LA MSA | 478,384 | 2.49% |
| 118 | Springfield, MO MSA | 475,432 | 8.87% |
| 119 | Killeen-Temple, TX MSA | 475,367 | 17.29% |
| 120 | Visalia, CA MSA | 473,117 | 7.00% |
| 121 | Asheville, NC MSA | 469,015 | 10.39% |
| 122 | York-Hanover, PA MSA | 456,438 | 4.94% |
| 123 | Vallejo, CA MSA | 453,491 | 9.71% |
| 124 | Santa Maria-Santa Barbara, CA MSA | 448,229 | 5.74% |
| 125 | Salinas, CA MSA | 439,035 | 5.78% |
| 126 | Salem, OR MSA | 433,353 | 10.91% |
| 127 | Mobile, AL MSA | 430,197 | -0.09% |
| 128 | Reading, PA MSA | 428,849 | 4.23% |
| 129 | Manchester-Nashua, NH MSA | 422,937 | 5.54% |
| 130 | Corpus Christi, TX MSA | 421,933 | 4.17% |
| 131 | Brownsville-Harlingen, TX MSA | 421,017 | 3.64% |
| 132 | Fort Wayne, IN MSA | 419,601 | 7.97% |
| 133 | Salisbury, MD-DE MSA | 418,046 | 11.84% |
| 134 | Gulfport-Biloxi, MS MSA | 416,259 | 7.15% |
| 135 | Flint, MI MSA | 406,211 | -4.60% |
| 136 | Savannah, GA MSA | 404,798 | 16.45% |
| 137 | Peoria, IL MSA | 402,391 | -3.33% |
| 138 | Canton-Massillon, OH MSA | 401,574 | -0.70% |
| 139 | Anchorage, AK MSA | 398,328 | 4.60% |
| 140 | Beaumont-Port Arthur, TX MSA | 397,565 | 2.27% |
| 141 | Shreveport-Bossier City, LA MSA | 393,406 | -1.30% |
| 142 | Trenton-Princeton, NJ MSA | 387,340 | 5.68% |
| 143 | Montgomery, AL MSA | 386,047 | 3.07% |
| 144 | Davenport-Moline-Rock Island, IA-IL MSA | 384,324 | 1.22% |
| 145 | Tallahassee, FL MSA | 384,298 | 4.60% |
| 146 | Eugene-Springfield, OR MSA | 382,971 | 8.89% |
| 147 | Ocala, FL MSA | 375,908 | 13.47% |
| 148 | Naples-Marco Island, FL MSA | 375,752 | 16.87% |
| 149 | Ann Arbor, MI MSA | 372,258 | 7.97% |
| 150 | Hickory-Lenoir-Morganton, NC MSA | 365,276 | -0.06% |
| 151 | Huntington-Ashland, WV-KY-OH MSA | 359,862 | -2.98% |
| 152 | Fort Collins, CO MSA | 359,066 | 19.84% |
| 153 | Lincoln, NE MSA | 340,217 | 12.60% |
| 154 | Gainesville, FL MSA | 339,247 | 11.20% |
| 155 | Rockford, IL MSA | 338,798 | -3.04% |
| 156 | Boulder, CO MSA | 330,758 | 12.29% |
| 157 | Greeley, CO MSA | 328,981 | 30.12% |
| 158 | Columbus, GA-AL MSA | 328,883 | 6.85% |
| 159 | Green Bay, WI MSA | 328,268 | 7.19% |
| 160 | Spartanburg, SC MSA | 327,997 | 15.37% |
| 161 | South Bend-Mishawaka, IN-MI MSA | 324,501 | 1.65% |
| 162 | Lubbock, TX MSA | 321,368 | 10.51% |
| 163 | Clarksville, TN-KY MSA | 320,535 | 17.01% |
| 164 | Roanoke, VA MSA | 315,251 | 2.12% |
| 165 | Evansville, IN-KY MSA | 314,049 | 0.80% |
| 166 | Kingsport-Bristol, TN-VA MSA | 307,614 | -0.62% |
| 167 | Kennewick-Richland, WA MSA | 303,622 | 19.85% |
| 168 | Olympia-Lacey-Tumwater, WA MSA | 294,793 | 16.86% |
| 169 | Hagerstown-Martinsburg, MD-WV MSA | 293,844 | 9.18% |
| 170 | Utica-Rome, NY MSA | 292,264 | -2.38% |
| 171 | Duluth, MN-WI MSA | 291,638 | 0.34% |
| 172 | Crestview-Fort Walton Beach-Destin, FL MSA | 286,973 | 21.67% |
| 173 | Longview, TX MSA | 286,184 | 2.21% |
| 174 | Aguadilla-Isabela, PR Metropolitan Statistical Area | 286,064 | -15.72% |
| 175 | Wilmington, NC MSA | 285,905 | 12.17% |
| 176 | San Luis Obispo-Paso Robles, CA MSA | 282,424 | 4.74% |
| 177 | Merced, CA MSA | 281,202 | 9.93% |
| 178 | Waco, TX MSA | 277,547 | 9.80% |
| 179 | Sioux Falls, SD MSA | 276,730 | 21.23% |
| 180 | Cedar Rapids, IA MSA | 276,520 | 7.20% |
| 181 | Bremerton-Silverdale-Port Orchard, WA MSA | 275,611 | 9.75% |
| 182 | Atlantic City-Hammonton, NJ MSA | 274,534 | -0.01% |
| 183 | Erie, PA MSA | 270,876 | -3.45% |
| 184 | Santa Cruz-Watsonville, CA MSA | 270,861 | 3.23% |
| 185 | Amarillo, TX MSA | 268,761 | 6.68% |
| 186 | Tuscaloosa, AL MSA | 268,674 | 12.32% |
| 187 | Norwich-New London, CT MSA | 268,555 | -2.01% |
| 188 | College Station-Bryan, TX MSA | 268,248 | 17.31% |
| 189 | Laredo, TX MSA | 267,114 | 6.72% |
| 190 | Kalamazoo-Portage, MI MSA | 261,670 | 4.53% |
| 191 | Lynchburg, VA MSA | 261,593 | 3.55% |
| 192 | Charleston, WV MSA | 258,859 | -6.89% |
| 193 | Yakima, WA MSA | 256,728 | 5.55% |
| 194 | Fargo, ND-MN MSA | 249,843 | 19.67% |
| 195 | Binghamton, NY MSA | 247,138 | -1.82% |
| 196 | Fort Smith, AR-OK MSA | 244,310 | -1.57% |
| 197 | Appleton, WI MSA | 243,147 | 7.75% |
| 198 | Prescott Valley-Prescott, AZ MSA | 236,209 | 11.93% |
| 199 | Macon-Bibb County, GA MSA | 233,802 | 0.65% |
| 200 | Tyler, TX MSA | 233,479 | 11.33% |
| 201 | Topeka, KS MSA | 233,152 | -0.31% |
| 202 | Daphne-Fairhope-Foley, AL MSA | 231,767 | 27.16% |
| 203 | Barnstable Town, MA MSA | 228,996 | 6.07% |
| 204 | Bellingham, WA MSA | 226,847 | 12.78% |
| 205 | Rochester, MN MSA | 226,329 | 9.40% |
| 206 | Burlington-South Burlington, VT MSA | 225,562 | 6.77% |
| 207 | Lafayette-West Lafayette, IN MSA | 223,716 | 6.38% |
| 208 | Medford, OR MSA | 223,259 | 9.87% |
| 209 | Champaign-Urbana, IL MSA | 222,538 | 2.17% |
| 210 | Lake Charles, LA MSA | 222,402 | 11.42% |
| 211 | Charlottesville, VA MSA | 221,524 | 9.91% |
| 212 | Las Cruces, NM MSA | 219,561 | 4.94% |
| 213 | Hilton Head Island-Bluffton-Beaufort, SC MSA | 215,908 | 15.45% |
| 214 | Athens-Clarke County, GA MSA | 215,415 | 11.88% |
| 215 | Lake Havasu City-Kingman, AZ MSA | 213,267 | 6.53% |
| 216 | Chico, CA MSA | 211,632 | -3.80% |
| 217 | Ponce, PR Metropolitan Statistical Area | 211,465 | -19.48% |
| 218 | Columbia, MO MSA | 210,864 | 10.76% |
| 219 | Springfield, IL MSA | 208,640 | -0.73% |
| 220 | Johnson City, TN MSA | 207,285 | 4.31% |
| 221 | Houma-Thibodaux, LA MSA | 207,137 | -0.50% |
| 222 | Monroe, LA MSA | 207,104 | 1.31% |
| 223 | Elkhart-Goshen, IN MSA | 207,047 | 4.80% |
| 224 | Jacksonville, NC MSA | 204,576 | 15.08% |
| 225 | Yuma, AZ MSA | 203,881 | 4.15% |
| 226 | Gainesville, GA MSA | 203,136 | 13.05% |
| 227 | Florence, SC MSA | 199,964 | -2.73% |
| 228 | St. Cloud, MN MSA | 199,671 | 5.59% |
| 229 | Bend, OR MSA | 198,253 | 25.69% |
| 230 | Racine, WI MSA | 197,727 | 1.19% |
| 231 | Warner Robins, GA MSA | 191,614 | 14.33% |
| 232 | Saginaw, MI MSA | 190,124 | -5.02% |
| 233 | Punta Gorda, FL MSA | 186,847 | 16.80% |
| 234 | Terre Haute, IN MSA | 185,031 | -2.49% |
| 235 | Billings, MT MSA | 184,167 | 10.17% |
| 236 | Redding, CA MSA | 182,155 | 2.78% |
| 237 | Dover, DE MSA | 181,851 | 12.04% |
| 238 | Kingston, NY MSA | 181,851 | -0.35% |
| 239 | Joplin, MO MSA | 181,409 | 3.36% |
| 240 | Yuba City, CA MSA | 181,208 | 8.58% |
| 241 | Jackson, TN MSA | 180,504 | 0.45% |
| 242 | St. George, UT MSA | 180,279 | 30.53% |
| 243 | El Centro, CA MSA | 179,702 | 2.96% |
| 244 | Bowling Green, KY MSA | 179,639 | 13.27% |
| 245 | Abilene, TX MSA | 176,579 | 6.85% |
| 246 | Muskegon, MI MSA | 175,824 | 2.11% |
| 247 | Iowa City, IA MSA | 175,419 | 14.96% |
| 248 | Midland, TX MSA | 175,220 | 23.68% |
| 249 | Panama City, FL MSA | 175,216 | 3.77% |
| 250 | Auburn-Opelika, AL MSA | 174,241 | 24.24% |
| 251 | Arecibo, PR Metropolitan Statistical Area | 173,218 | -13.16% |
| 252 | Hattiesburg, MS MSA | 172,231 | 6.05% |
| 253 | Eau Claire, WI MSA | 172,007 | 6.74% |
| 254 | Oshkosh-Neenah, WI MSA | 171,730 | 2.84% |
| 255 | Burlington, NC MSA | 171,415 | 13.42% |
| 256 | Coeur d'Alene, ID MSA | 171,362 | 23.73% |
| 257 | Bloomington, IL MSA | 170,954 | 0.81% |
| 258 | Greenville, NC MSA | 170,243 | 1.25% |
| 259 | Waterloo-Cedar Falls, IA MSA | 168,461 | 0.38% |
| 260 | East Stroudsburg, PA MSA | 168,327 | -0.89% |
| 261 | Pueblo, CO MSA | 168,162 | 5.72% |
| 262 | Wausau-Weston, WI MSA | 166,428 | 2.22% |
| 263 | Blacksburg-Christiansburg, VA MSA | 166,378 | 2.10% |
| 264 | Odessa, TX MSA | 165,171 | 20.45% |
| 265 | Kahului-Wailuku-Lahaina, HI MSA | 164,754 | 6.41% |
| 266 | Janesville-Beloit, WI MSA | 163,687 | 2.09% |
| 267 | Bloomington, IN MSA | 161,039 | 0.93% |
| 268 | Jackson, MI MSA | 160,366 | 0.07% |
| 269 | Sebastian-Vero Beach, FL MSA | 159,788 | 15.76% |
| 270 | State College, PA MSA | 158,172 | 2.72% |
| 271 | Idaho Falls, ID MSA | 157,429 | 18.13% |
| 272 | Decatur, AL MSA | 156,494 | 1.73% |
| 273 | Madera, CA MSA | 156,255 | 3.57% |
| 274 | Chambersburg-Waynesboro, PA MSA | 155,932 | 4.22% |
| 275 | Grand Junction, CO MSA | 155,703 | 6.12% |
| 276 | Elizabethtown-Fort Knox, KY MSA | 155,572 | 4.88% |
| 277 | Santa Fe, NM MSA | 154,823 | 7.39% |
| 278 | Monroe, MI MSA | 154,809 | 1.83% |
| 279 | Niles, MI MSA | 154,316 | -1.59% |
| 280 | Vineland-Bridgeton, NJ MSA | 154,152 | -1.75% |
| 281 | Homosassa Springs, FL MSA | 153,843 | 8.93% |
| 282 | Hanford-Corcoran, CA MSA | 152,486 | -0.32% |
| 283 | Bangor, ME MSA | 152,199 | -1.12% |
| 284 | Alexandria, LA MSA | 152,192 | -1.12% |
| 285 | Dothan, AL MSA | 151,007 | 3.69% |
| 286 | Florence-Muscle Shoals, AL MSA | 150,791 | 2.48% |
| 287 | Jefferson City, MO MSA | 150,309 | 0.34% |
| 288 | Sioux City, IA-NE-SD MSA | 149,940 | 4.43% |
| 289 | Albany, GA MSA | 148,922 | -3.21% |
| 290 | Wichita Falls, TX MSA | 148,128 | -2.10% |
| 291 | Valdosta, GA MSA | 148,126 | 6.12% |
| 292 | Texarkana, TX-AR MSA | 147,519 | -1.13% |
| 293 | Logan, UT-ID MSA | 147,348 | 17.46% |
| 294 | Flagstaff, AZ MSA | 145,101 | 7.95% |
| 295 | Rocky Mount, NC MSA | 143,870 | -5.59% |
| 296 | Lebanon, PA MSA | 143,257 | 7.25% |
| 297 | Dalton, GA MSA | 142,837 | 0.43% |
| 298 | Morristown, TN MSA | 142,709 | 4.47% |
| 299 | Winchester, VA-WV MSA | 142,632 | 11.02% |
| 300 | Morgantown, WV MSA | 140,038 | 7.96% |
| 301 | La Crosse-Onalaska, WI-MN MSA | 139,627 | 4.46% |
| 302 | Wheeling, WV-OH MSA | 139,513 | -5.70% |
| 303 | Rapid City, SD MSA | 139,074 | 10.04% |
| 304 | Napa, CA MSA | 138,019 | 1.12% |
| 305 | Sumter, SC MSA | 136,700 | -4.02% |
| 306 | Springfield, OH MSA | 136,001 | -1.69% |
| 307 | Harrisonburg, VA MSA | 135,571 | 8.26% |
| 308 | Sherman-Denison, TX MSA | 135,543 | 12.13% |
| 309 | Battle Creek, MI MSA | 134,310 | -1.35% |
| 310 | Jonesboro, AR MSA | 134,196 | 10.88% |
| 311 | Manhattan, KS MSA | 134,046 | 5.48% |
| 312 | Bismarck, ND MSA | 133,626 | 20.79% |
| 313 | Johnstown, PA MSA | 133,472 | -7.10% |
| 314 | Carbondale-Marion, IL MSA | 133,435 | -4.11% |
| 315 | Hammond, LA MSA | 133,157 | 9.96% |
| 316 | The Villages, FL MSA | 129,752 | 38.89% |
| 317 | Mount Vernon-Anacortes, WA MSA | 129,523 | 10.80% |
| 318 | Pittsfield, MA MSA | 129,026 | -1.67% |
| 319 | Albany-Lebanon, OR MSA | 128,610 | 10.23% |
| 320 | Glens Falls, NY MSA | 127,039 | -1.46% |
| 321 | Lawton, OK MSA | 126,652 | -2.79% |
| 322 | Cleveland, TN MSA | 126,164 | 8.96% |
| 323 | Sierra Vista-Douglas, AZ MSA | 125,447 | -4.49% |
| 324 | Staunton, VA MSA | 125,433 | 5.85% |
| 325 | Ames, IA MSA | 125,252 | 8.12% |
| 326 | Mansfield, OH MSA | 124,936 | 0.37% |
| 327 | San Angelo, TX MSA | 122,888 | 8.78% |
| 328 | Altoona, PA MSA | 122,822 | -3.36% |
| 329 | New Bern, NC MSA | 122,168 | -3.65% |
| 330 | Wenatchee, WA MSA | 122,012 | 10.04% |
| 331 | Farmington, NM MSA | 121,661 | -6.45% |
| 332 | Owensboro, KY MSA | 121,559 | 5.93% |
| 333 | St. Joseph, MO-KS MSA | 121,467 | -4.60% |
| 334 | San Germán, PR Metropolitan Statistical Area | 120,280 | -12.50% |
| 335 | Lawrence, KS MSA | 118,785 | 7.18% |
| 336 | Sheboygan, WI MSA | 118,034 | 2.19% |
| 337 | Missoula, MT MSA | 117,922 | 7.89% |
| 338 | Goldsboro, NC MSA | 117,333 | -4.31% |
| 339 | Weirton-Steubenville, WV-OH MSA | 116,903 | -6.07% |
| 340 | Watertown-Fort Drum, NY MSA | 116,721 | 0.42% |
| 341 | Anniston-Oxford, AL MSA | 116,441 | -1.80% |
| 342 | Beckley, WV MSA | 115,079 | -7.86% |
| 343 | Twin Falls, ID MSA | 114,283 | 14.74% |
| 344 | Williamsport, PA MSA | 114,188 | -1.66% |
| 345 | California-Lexington Park, MD MSA | 113,777 | 8.20% |
| 346 | Brunswick, GA MSA | 113,495 | 1.00% |
| 347 | Michigan City-La Porte, IN MSA | 112,417 | 0.85% |
| 348 | Muncie, IN MSA | 111,903 | -4.90% |
| 349 | Lewiston-Auburn, ME MSA | 111,139 | 3.19% |
| 350 | Longview, WA MSA | 110,730 | 8.12% |
| 351 | Kankakee, IL MSA | 107,502 | -5.24% |
| 352 | Ithaca, NY MSA | 105,740 | 4.11% |
| 353 | Grand Forks, ND-MN MSA | 104,362 | 5.99% |
| 354 | Fond du Lac, WI MSA | 104,154 | 2.48% |
| 355 | Decatur, IL MSA | 103,998 | -6.11% |
| 356 | Bay City, MI MSA | 103,856 | -3.63% |
| 357 | Gettysburg, PA MSA | 103,852 | 2.41% |
| 358 | Mankato, MN MSA | 103,566 | 7.06% |
| 359 | Gadsden, AL MSA | 103,436 | -0.95% |
| 360 | Lima, OH MSA | 102,206 | -3.88% |
| 361 | Sebring-Avon Park, FL MSA | 101,235 | 2.48% |
| 362 | Cheyenne, WY MSA | 100,512 | 9.56% |
| 363 | Hot Springs, AR MSA | 100,180 | 4.33% |
| 364 | Dubuque, IA MSA | 99,266 | 5.99% |
| 365 | Rome, GA MSA | 98,584 | 2.35% |
| 366 | Victoria, TX MSA | 98,331 | 4.60% |
| 367 | Cape Girardeau, MO-IL MSA | 97,517 | 1.29% |
| 368 | Fairbanks, AK MSA | 95,655 | -1.97% |
| 369 | Ocean City, NJ MSA | 95,263 | -2.06% |
| 370 | Corvallis, OR MSA | 95,184 | 11.22% |
| 371 | Cumberland, MD-WV MSA | 95,044 | -7.99% |
| 372 | Pocatello, ID MSA | 94,896 | 4.68% |
| 373 | Mayagüez, PR Metropolitan Statistical Area | 93,412 | -19.62% |
| 374 | Parkersburg-Vienna, WV MSA | 89,490 | -3.43% |
| 375 | Grants Pass, OR MSA | 88,090 | 6.50% |
| 376 | Pine Bluff, AR MSA | 87,751 | -12.47% |
| 377 | Great Falls, MT MSA | 84,414 | 3.80% |
| 378 | Elmira, NY MSA | 84,148 | -5.27% |
| 379 | Yauco, PR Metropolitan Statistical Area | 84,112 | -21.63% |
| 380 | Kokomo, IN MSA | 83,658 | 1.09% |
| 381 | Midland, MI MSA | 83,494 | -0.16% |
| 382 | Bloomsburg-Berwick, PA MSA | 82,863 | -3.15% |
| 383 | Columbus, IN MSA | 82,208 | 7.05% |
| 384 | Hinesville, GA MSA | 81,424 | 4.50% |
| 385 | Casper, WY MSA | 79,955 | 5.97% |
| 386 | Grand Island, NE MSA | 77,038 | 5.93% |
| 387 | Danville, IL MSA | 74,188 | -9.11% |
| 388 | Guayama, PR Metropolitan Statistical Area | 72,240 | -14.22% |
| 389 | Lewiston, ID-WA MSA | 64,375 | 5.73% |
| 390 | Enid, OK MSA | 62,846 | 3.74% |
| 391 | Walla Walla, WA MSA | 62,584 | 6.47% |
| 392 | Carson City, NV MSA | 58,639 | 6.09% |
From Metro to Micro
The wide variety of population patterns around the country can make it tricky to divide regions up into uniform units. There are two main divisions to consider when viewing this map:
- Metropolitan Areas (metro areas) have at least one urban core area of at least 50,000 population. These are the largest population centers, sometimes encompassing many counties. In some instances, these metro areas are further subdivided into Metropolitan Divisions.
- Micropolitan Areas are the smallest areas measured on this map (indicated by a lighter shade of green). These smaller regions, which are generally located further away from large cities, have at least one urban core area of at least 10,000 but fewer than 50,000 people.
One thing to note about all of these definitions is that the cities in these regions must have significant ties to a neighboring region—usually in the form of commuting ties. This is what warrants binding adjacent counties into a measurable area.
Another unique layer of data on this map is the shading that indicates the actual urbanized area within metro areas. In the example of Atlanta-Sandy Springs-Alpharetta, it’s easy to see how urban sprawl has expanded the urban area into a number of neighboring counties.
With this context in mind, we’ll take a closer look at three points of interest on the map that show this concept at work with varying degrees of complexity.
Level One: The Central City
The Texas Triangle offers what is perhaps the most straightforward example of metro areas.
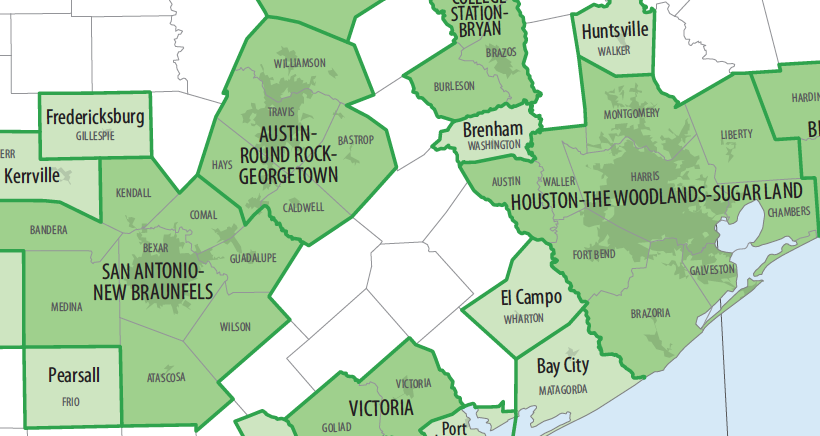
As seen above, Houston, Austin, and San Antonio anchor their respective regions, and surrounding counties are bundled into a metro area. The surrounding counties have all been identified as having ties to the central county, and, in some cases, the urban area has spread into the neighboring county over time.
Level Two: The City Cluster
The region anchored by Salt Lake City requires more thought to divide into statistical areas.
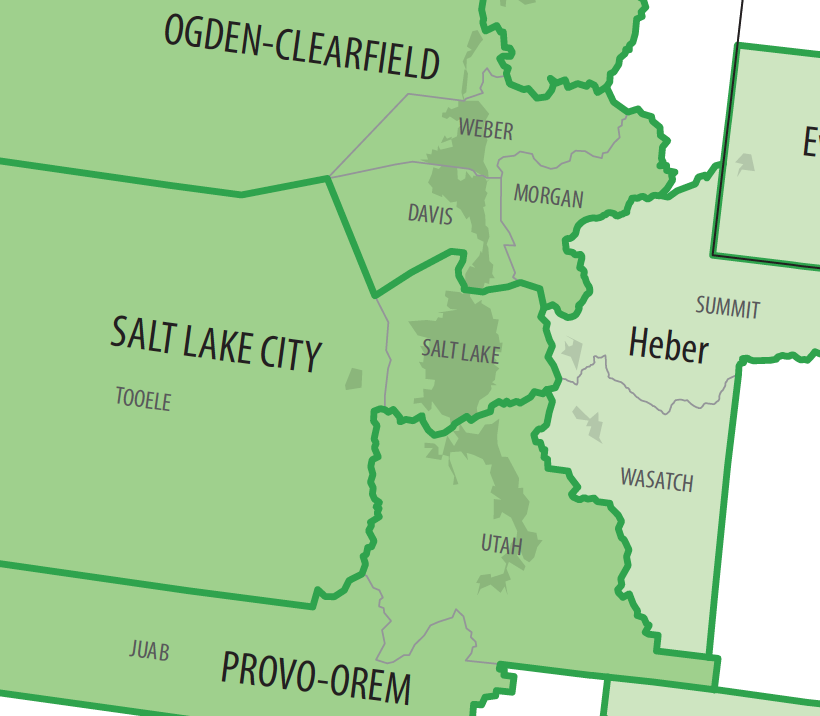
While there are a number of population centers in the area, including Salt Lake City, Provo, and Ogden, they all have enough of an economic “magnetic pull” to warrant splitting the region into distinct statistical areas.
Of course, regions are always evolving, and occasionally these areas are updated. Salt Lake City and Ogden were previously combined into a single metro area, but were separated in 2005.
Level Three: The Megaregion
New York City is the ultimate challenge for planners looking to categorize population centers into a neat and tidy statistical box.
For one, the contiguous urban area is massive, stretching from the west side of Long Island out to the east side of New Jersey. In addition to New York City itself, the metro area includes 19 other municipalities with over 100,000 people.
Next, NYC is an unparalleled economic magnet. Measuring commuting activity is a challenge because a wide variety of people visit the city for so many different reasons. The interconnectedness of the Northeast Megaregion also adds to the complexity.
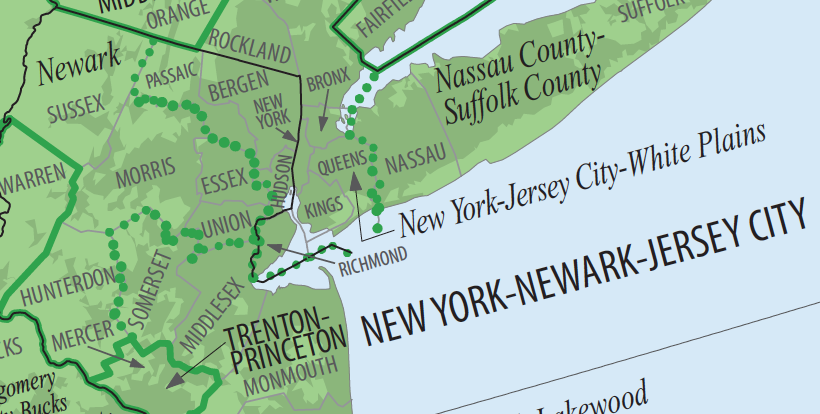
New York-Newark-Jersey City is such a big pie to carve up, that four of the country’s 11 metro divisions (as indicated by the italicized text and dotted lines) occur in this one area.
Blurring the Lines
Population patterns are constantly changing across the country, so the next version of this map may have a number of changes on it. Our “straightforward” Texas Triangle example may become tougher to divide up as the population boom continues in the region.
Here’s how the population of U.S. countries changed over the past decade:
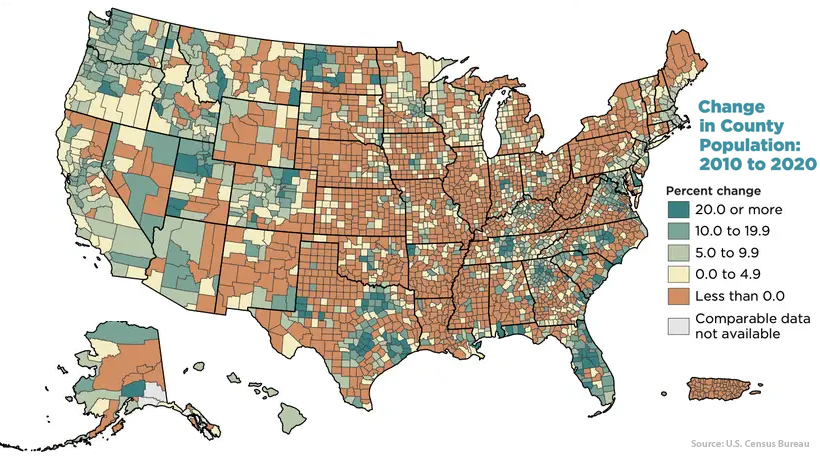
Further complicating matters is the rapid move to remote work and distributed teams. A key element of these census divisions are commuting ties. With work increasingly not bound by geographic limitations, it remains unclear how that trend will impact this type of statistical exercise in the future.


Misc
How Hard Is It to Get Into an Ivy League School?
We detail the admission rates and average annual cost for Ivy League schools, as well as the median SAT scores required to be accepted.


How Hard Is It to Get Into an Ivy League School?
This was originally posted on our Voronoi app. Download the app for free on iOS or Android and discover incredible data-driven charts from a variety of trusted sources.
Ivy League institutions are renowned worldwide for their academic excellence and long-standing traditions. But how hard is it to get into one of the top universities in the U.S.?
In this graphic, we detail the admission rates and average annual cost for Ivy League schools, as well as the median SAT scores required to be accepted. The data comes from the National Center for Education Statistics and was compiled by 24/7 Wall St.
Note that “average annual cost” represents the net price a student pays after subtracting the average value of grants and/or scholarships received.
Harvard is the Most Selective
The SAT is a standardized test commonly used for college admissions in the United States. It’s taken by high school juniors and seniors to assess their readiness for college-level academic work.
When comparing SAT scores, Harvard and Dartmouth are among the most challenging universities to gain admission to. The median SAT scores for their students are 760 for reading and writing and 790 for math. Still, Harvard has half the admission rate (3.2%) compared to Dartmouth (6.4%).
| School | Admission rate (%) | SAT Score: Reading & Writing | SAT Score: Math | Avg Annual Cost* |
|---|---|---|---|---|
| Harvard University | 3.2 | 760 | 790 | $13,259 |
| Columbia University | 3.9 | 750 | 780 | $12,836 |
| Yale University | 4.6 | 760 | 780 | $16,341 |
| Brown University | 5.1 | 760 | 780 | $26,308 |
| Princeton University | 5.7 | 760 | 780 | $11,080 |
| Dartmouth College | 6.4 | 760 | 790 | $33,023 |
| University of Pennsylvania | 6.5 | 750 | 790 | $14,851 |
| Cornell University | 7.5 | 750 | 780 | $29,011 |
*Costs after receiving federal financial aid.
Additionally, Dartmouth has the highest average annual cost at $33,000. Princeton has the lowest at $11,100.
While student debt has surged in the United States in recent years, hitting $1.73 trillion in 2023, the worth of obtaining a degree from any of the schools listed surpasses mere academics. This is evidenced by the substantial incomes earned by former students.
Harvard grads, for example, have the highest average starting salary in the country, at $91,700.

-

 Real Estate2 weeks ago
Visualizing America’s Shortage of Affordable Homes
-

 Technology1 week ago
Ranked: Semiconductor Companies by Industry Revenue Share
-

 Money1 week ago
Which States Have the Highest Minimum Wage in America?
-

 Real Estate1 week ago
Ranked: The Most Valuable Housing Markets in America
-

 Business2 weeks ago
Charted: Big Four Market Share by S&P 500 Audits
-

 AI2 weeks ago
The Stock Performance of U.S. Chipmakers So Far in 2024
-

 Misc2 weeks ago
Almost Every EV Stock is Down After Q1 2024
-

 Money2 weeks ago
Where Does One U.S. Tax Dollar Go?