Money
The Geography of the World’s 50 Top Billionaires
The Geography of the World’s 50 Top Billionaires
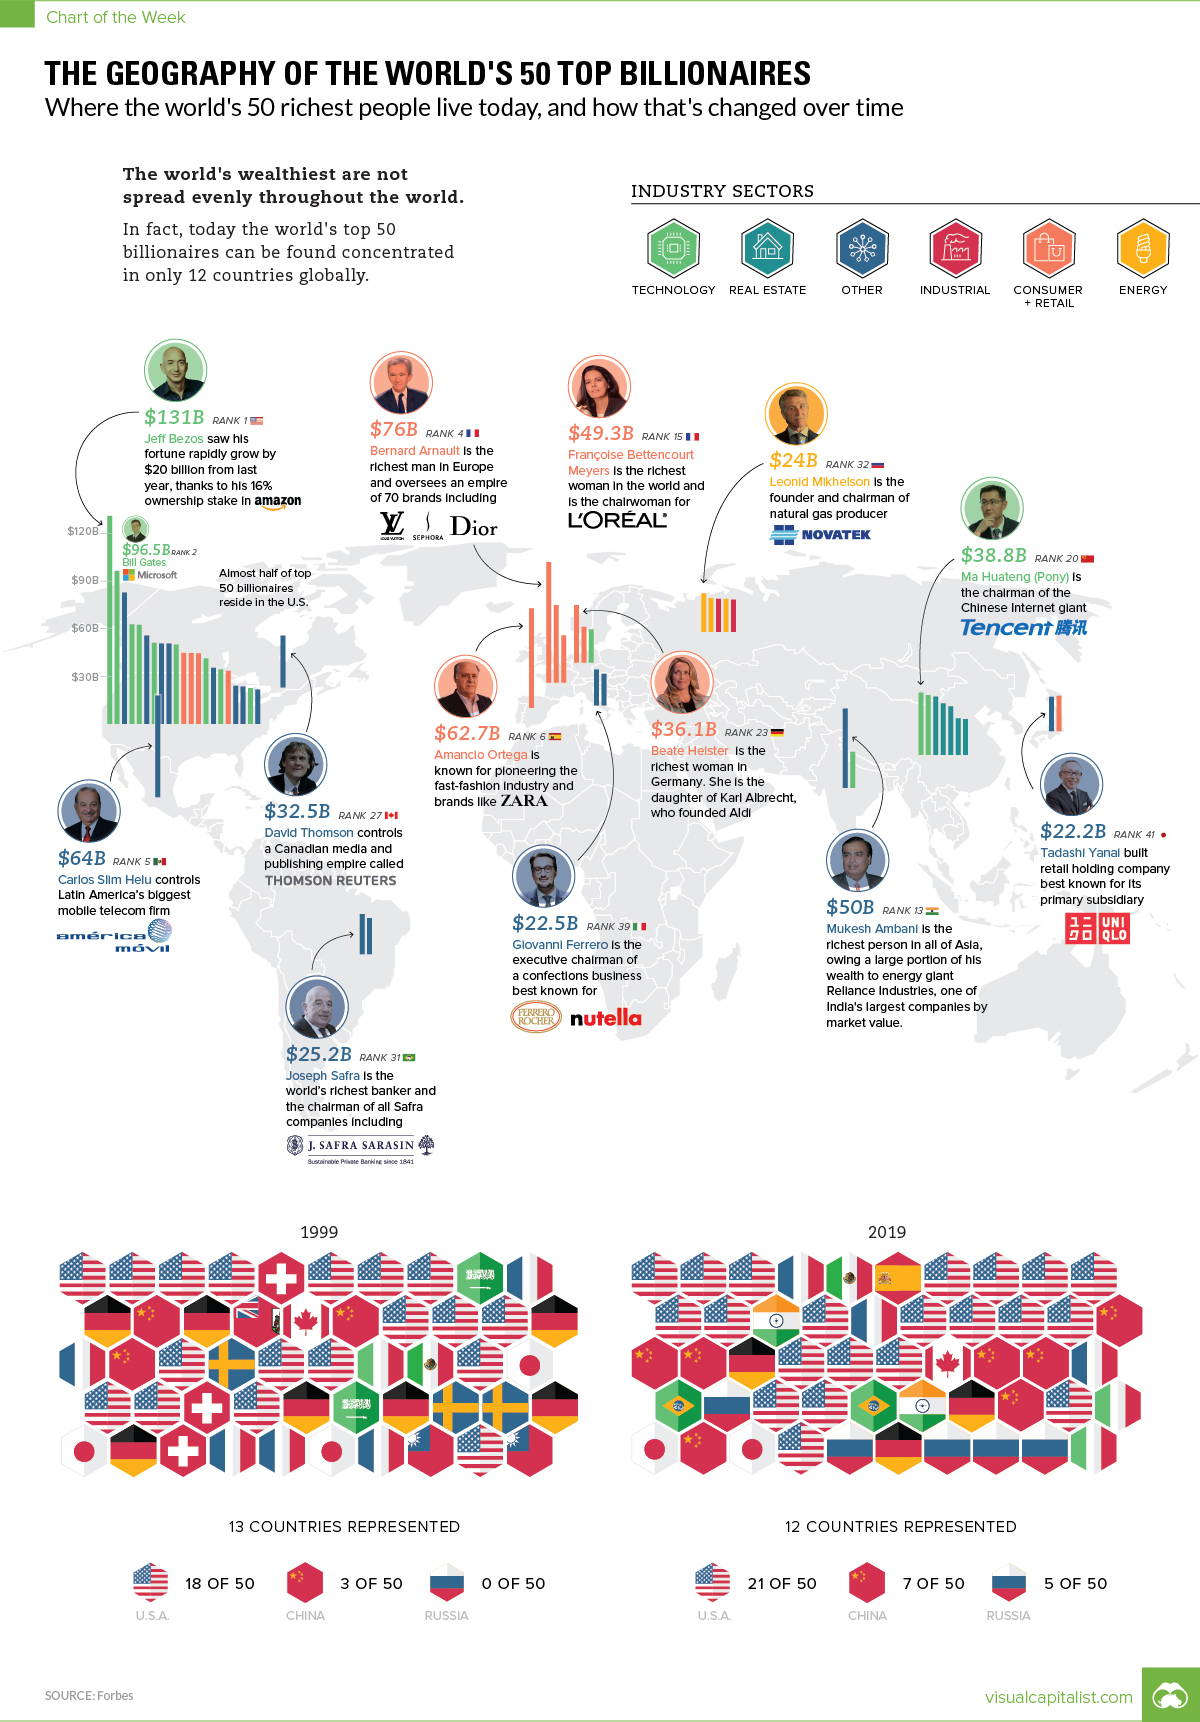
The business world has undergone considerable change in the last two decades.
While some fortunes are always reliably passed on to their respective heirs and heiresses, there are also entirely new industries that rise out of nowhere to shape the landscape of global wealth.
As the wealth landscape shifts, so does its geographical distribution.
The 2019 List of Billionaires
Today’s chart uses data from the most recent edition of the Forbes Billionaires List to map the distribution of the world’s richest people, and then compare that to data from 20 years prior.
We’ll start here by looking at the most recent data from 2019:
| Rank | Name | Net Worth ($B) | Citizenship | Industry |
|---|---|---|---|---|
| #1 | Jeff Bezos | 131 | 🇺🇸 USA | Tech, eCommerce |
| #2 | Bill Gates | 96.5 | 🇺🇸 USA | Tech |
| #3 | Warren Buffett | 82.5 | 🇺🇸 USA | Investments |
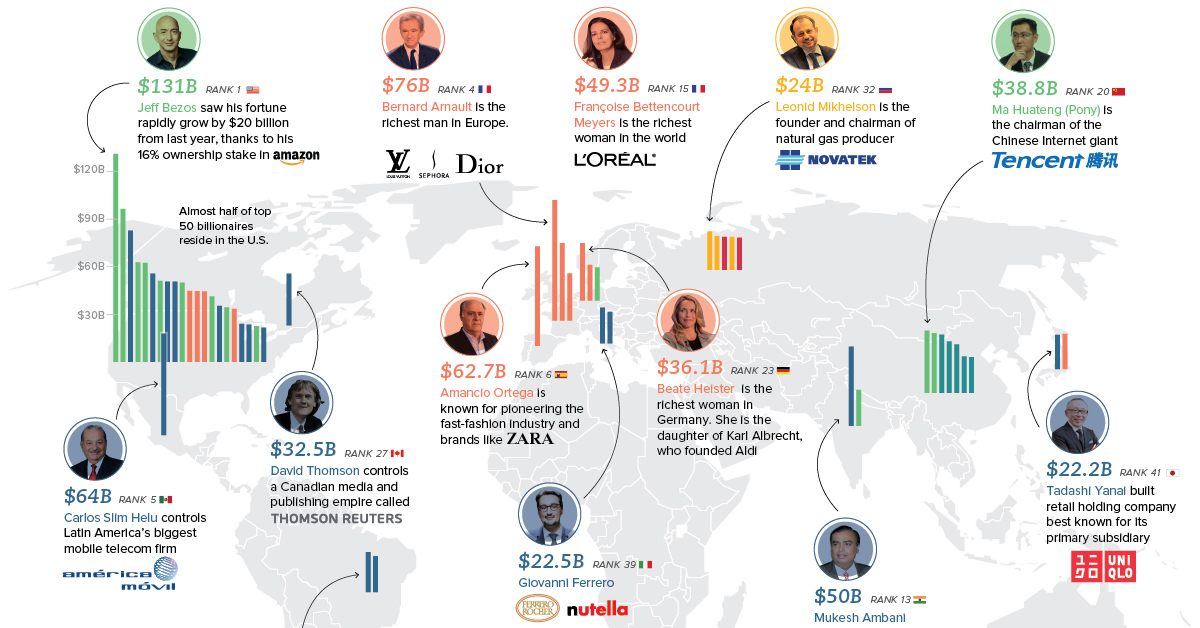
| #4 | Bernard Arnault | 76 | 🇫🇷 France | Luxury Goods, Cosmetics |
| #5 | Carlos Slim Helu | 64 | 🇲🇽 Mexico | Telecommunications |
| #6 | Amancio Ortega | 62.7 | 🇪🇸 Spain | Apparel |
| #7 | Larry Ellison | 62.5 | 🇺🇸 USA | Tech |
| #8 | Mark Zuckerberg | 62.3 | 🇺🇸 USA | Tech |
| #9 | Michael Bloomberg | 55.5 | 🇺🇸 USA | Media |
| #10 | Larry Page | 50.8 | 🇺🇸 USA | Tech |
| #11 | Charles Koch | 50.5 | 🇺🇸 USA | Diversified |
| #12 | David Koch | 50.5 | 🇺🇸 USA | Diversified |
| #13 | Mukesh Ambani | 50 | 🇮🇳 India | Oil & Gas, Telecoms |
| #14 | Sergey Brin | 49.8 | 🇺🇸 USA | Tech |
| #15 | Francoise Bettencourt | 49.3 | 🇫🇷 France | Cosmetics |
| #16 | Jim Walton | 44.6 | 🇺🇸 USA | Retail |
| #17 | Alice Walton | 44.4 | 🇺🇸 USA | Retail, Art |
| #18 | Rob Walton | 44.3 | 🇺🇸 USA | Retail |
| #19 | Steve Ballmer | 41.2 | 🇺🇸 USA | Tech |
| #20 | Ma Huateng (Pony) | 38.8 | 🇨🇳 China | Tech |
| #21 | Jack Ma | 37.3 | 🇨🇳 China | Tech, eCommerce |
| #22 | Hui Ka Yan | 36.2 | 🇨🇳 China | Real Estate |
| #23 | Beate Heister & Karl Albrecht Jr. | 36.1 | 🇩🇪 Germany | Retail |
| #24 | Sheldon Adelson | 35.1 | 🇺🇸 USA | Casinos |
| #25 | Michael Dell | 34.3 | 🇺🇸 USA | Tech |
| #26 | Phil Knight | 33.4 | 🇺🇸 USA | Apparel |
| #27 | David Thomson | 32.5 | 🇨🇦 Canada | Media |
| #28 | Li Ka-shing | 31.7 | 🇨🇳 China | Developer |
| #29 | Lee Shau Kee | 30.1 | 🇨🇳 China | Developer |
| #30 | François Pinault | 29.7 | 🇫🇷 France | Luxury Goods |
| #31 | Joseph Safra | 25.2 | 🇧🇷 Brazil | Diversified |
| #32 | Leonid Mikhelson | 24 | 🇷🇺 Russia | Oil & Gas |
| #33 | Jacqueline Mars | 23.4 | 🇺🇸 USA | Food |
| #34 | John Mars | 23.9 | 🇺🇸 USA | Food |
| #35 | Jorge Paulo Lemann | 22.8 | 🇧🇷 Brazil | Diversified |
| #36 | Azim Premji | 22.6 | 🇮🇳 India | Tech |
| #37 | Dieter Schwarz | 22.6 | 🇩🇪 Germany | Retail |
| #38 | Wang Jianlin | 22.6 | 🇨🇳 China | Real Estate |
| #39 | Giovanni Ferrero | 22.4 | 🇮🇹 Italy | Food |
| #40 | Elon Musk | 22.4 | 🇺🇸 USA | Automotive, Tech |
| #41 | Tadashi Yanai | 22.2 | 🇯🇵 Japan | Apparel |
| #42 | Yang Huiyan | 22.1 | 🇨🇳 China | Real Estate |
| #43 | Masayoshi Son | 21.6 | 🇯🇵 Japan | Banking, Investments |
| #44 | Jim Simons | 21.5 | 🇺🇸 USA | Investments |
| #45 | Vladimir Lisin | 21.3 | 🇷🇺 Russia | Steel, Transportation |
| #46 | Susanne Klatten | 21 | 🇩🇪 Germany | Automotive, Pharma |
| #47 | Vagit Alekperov | 20.7 | 🇷🇺 Russia | Oil & Gas |
| #48 | Alexey Mordashov | 20.5 | 🇷🇺 Russia | Steel, Investments |
| #49 | Gennady Timchenko | 20.1 | 🇷🇺 Russia | Oil & Gas |
| #50 | Leonardo Del Vecchio | 19.8 | 🇮🇹 Italy | Eyewear |
The most recent billionaires list features Jeff Bezos at the top with $131 billion, although it’s likely his recent divorce announcement will provide an upcoming shakeup to the Bezos Empire.
Bezos is just one of 21 Americans that find themselves in the top 50 list, which means that 42% of the world’s top billionaires hail from the United States.
Billionaire Geography Over Time
If we compare the top 50 list to that from 1999, it’s interesting to see what has changed over time in terms of geographical distribution.
Here’s the distribution of top countries on both lists, compared:
| Citizenship | Top Billionaires (1999) | Top Billionaires (2019) | Change |
|---|---|---|---|
| 🇷🇺 Russia | 0 | 5 | +5 |
| 🇨🇳 China | 3 | 7 | +4 |
| 🇺🇸 United States | 18 | 21 | +3 |
| 🇧🇷 Brazil | 0 | 2 | +2 |
| 🇮🇳 India | 0 | 2 | +2 |
| 🇮🇹 Italy | 1 | 2 | +1 |
| 🇪🇸 Spain | 0 | 1 | +1 |
| 🇲🇽 Mexico | 1 | 1 | 0 |
| 🇨🇦 Canada | 1 | 1 | 0 |
| 🇧🇲 Bermuda | 1 | 0 | -1 |
| 🇯🇵 Japan | 3 | 2 | -1 |
| 🇫🇷 France | 5 | 3 | -2 |
| 🇸🇦 Saudi Arabia | 2 | 0 | -2 |
| 🇹🇼 Taiwan | 2 | 0 | -2 |
| 🇸🇪 Sweden | 3 | 0 | -3 |
| 🇨🇭Switzerland | 3 | 0 | -3 |
| 🇩🇪 Germany | 7 | 3 | -4 |
In the last 20 years, Russia and China have stockpiled the most top billionaires, adding five and four to the top 50 list respectively. The United States added three, going from 18 to 21 billionaires over the timeframe.
On the other end of the spectrum, Germany, Sweden, and Switzerland have lost the most billionaires from the top 50 ranking.


Money
How Debt-to-GDP Ratios Have Changed Since 2000
See how much the debt-to-GDP ratios of advanced economies have grown (or shrank) since the year 2000.


How Debt-to-GDP Ratios Have Changed Since 2000
This was originally posted on our Voronoi app. Download the app for free on Apple or Android and discover incredible data-driven charts from a variety of trusted sources.
Government debt levels have grown in most parts of the world since the 2008 financial crisis, and even more so after the COVID-19 pandemic.
To gain perspective on this long-term trend, we’ve visualized the debt-to-GDP ratios of advanced economies, as of 2000 and 2024 (estimated). All figures were sourced from the IMF’s World Economic Outlook.
Data and Highlights
The data we used to create this graphic is listed in the table below. “Government gross debt” consists of all liabilities that require payment(s) of interest and/or principal in the future.
| Country | 2000 (%) | 2024 (%) | Change (pp) |
|---|---|---|---|
| 🇯🇵 Japan | 135.6 | 251.9 | +116.3 |
| 🇸🇬 Singapore | 82.3 | 168.3 | +86.0 |
| 🇺🇸 United States | 55.6 | 126.9 | +71.3 |
| 🇬🇧 United Kingdom | 36.6 | 105.9 | +69.3 |
| 🇬🇷 Greece | 104.9 | 160.2 | +55.3 |
| 🇫🇷 France | 58.9 | 110.5 | +51.6 |
| 🇵🇹 Portugal | 54.2 | 104.0 | +49.8 |
| 🇪🇸 Spain | 57.8 | 104.7 | +46.9 |
| 🇸🇮 Slovenia | 25.9 | 66.5 | +40.6 |
| 🇫🇮 Finland | 42.4 | 76.5 | +34.1 |
| 🇭🇷 Croatia | 35.4 | 61.8 | +26.4 |
| 🇨🇦 Canada | 80.4 | 103.3 | +22.9 |
| 🇨🇾 Cyprus | 56.0 | 70.9 | +14.9 |
| 🇦🇹 Austria | 65.7 | 74.0 | +8.3 |
| 🇸🇰 Slovak Republic | 50.5 | 56.5 | +6.0 |
| 🇩🇪 Germany | 59.3 | 64.0 | +4.7 |
| 🇧🇪 Belgium | 109.6 | 106.8 | -2.8 |
| 🇮🇱 Israel | 77.4 | 56.8 | -20.6 |
| 🇮🇸 Iceland | 75.8 | 54.6 | -21.2 |
The debt-to-GDP ratio indicates how much a country owes compared to the size of its economy, reflecting its ability to manage and repay debts. Percentage point (pp) changes shown above indicate the increase or decrease of these ratios.
Countries with the Biggest Increases
Japan (+116 pp), Singapore (+86 pp), and the U.S. (+71 pp) have grown their debt as a percentage of GDP the most since the year 2000.
All three of these countries have stable, well-developed economies, so it’s unlikely that any of them will default on their growing debts. With that said, higher government debt leads to increased interest payments, which in turn can diminish available funds for future government budgets.
This is a rising issue in the U.S., where annual interest payments on the national debt have surpassed $1 trillion for the first time ever.
Only 3 Countries Saw Declines
Among this list of advanced economies, Belgium (-2.8 pp), Iceland (-21.2 pp), and Israel (-20.6 pp) were the only countries that decreased their debt-to-GDP ratio since the year 2000.
According to Fitch Ratings, Iceland’s debt ratio has decreased due to strong GDP growth and the use of its cash deposits to pay down upcoming maturities.
See More Debt Graphics from Visual Capitalist
Curious to see which countries have the most government debt in dollars? Check out this graphic that breaks down $97 trillion in debt as of 2023.

-

 Real Estate2 weeks ago
Visualizing America’s Shortage of Affordable Homes
-

 Technology1 week ago
Ranked: Semiconductor Companies by Industry Revenue Share
-

 Money2 weeks ago
Which States Have the Highest Minimum Wage in America?
-

 Real Estate2 weeks ago
Ranked: The Most Valuable Housing Markets in America
-

 Business2 weeks ago
Charted: Big Four Market Share by S&P 500 Audits
-

 AI2 weeks ago
The Stock Performance of U.S. Chipmakers So Far in 2024
-

 Misc2 weeks ago
Almost Every EV Stock is Down After Q1 2024
-

 Money2 weeks ago
Where Does One U.S. Tax Dollar Go?