Markets
Visualized: FTX’s Leaked Balance Sheet


Visualizing FTX’s Balance Sheet Before Bankruptcy
In a difficult year for the crypto space that has been full of hacks, failing funds, and decentralized stablecoins going to zero, nothing has compared to FTX and Sam Bankman-Fried’s (SBF) rapid implosion.
After an astronomical rise in the crypto space over the past three years, crypto exchange FTX and its founder and CEO SBF have come crashing back down to earth, largely unraveled by their misuse of customer funds and illicit relationship with trading firm Alameda Research.
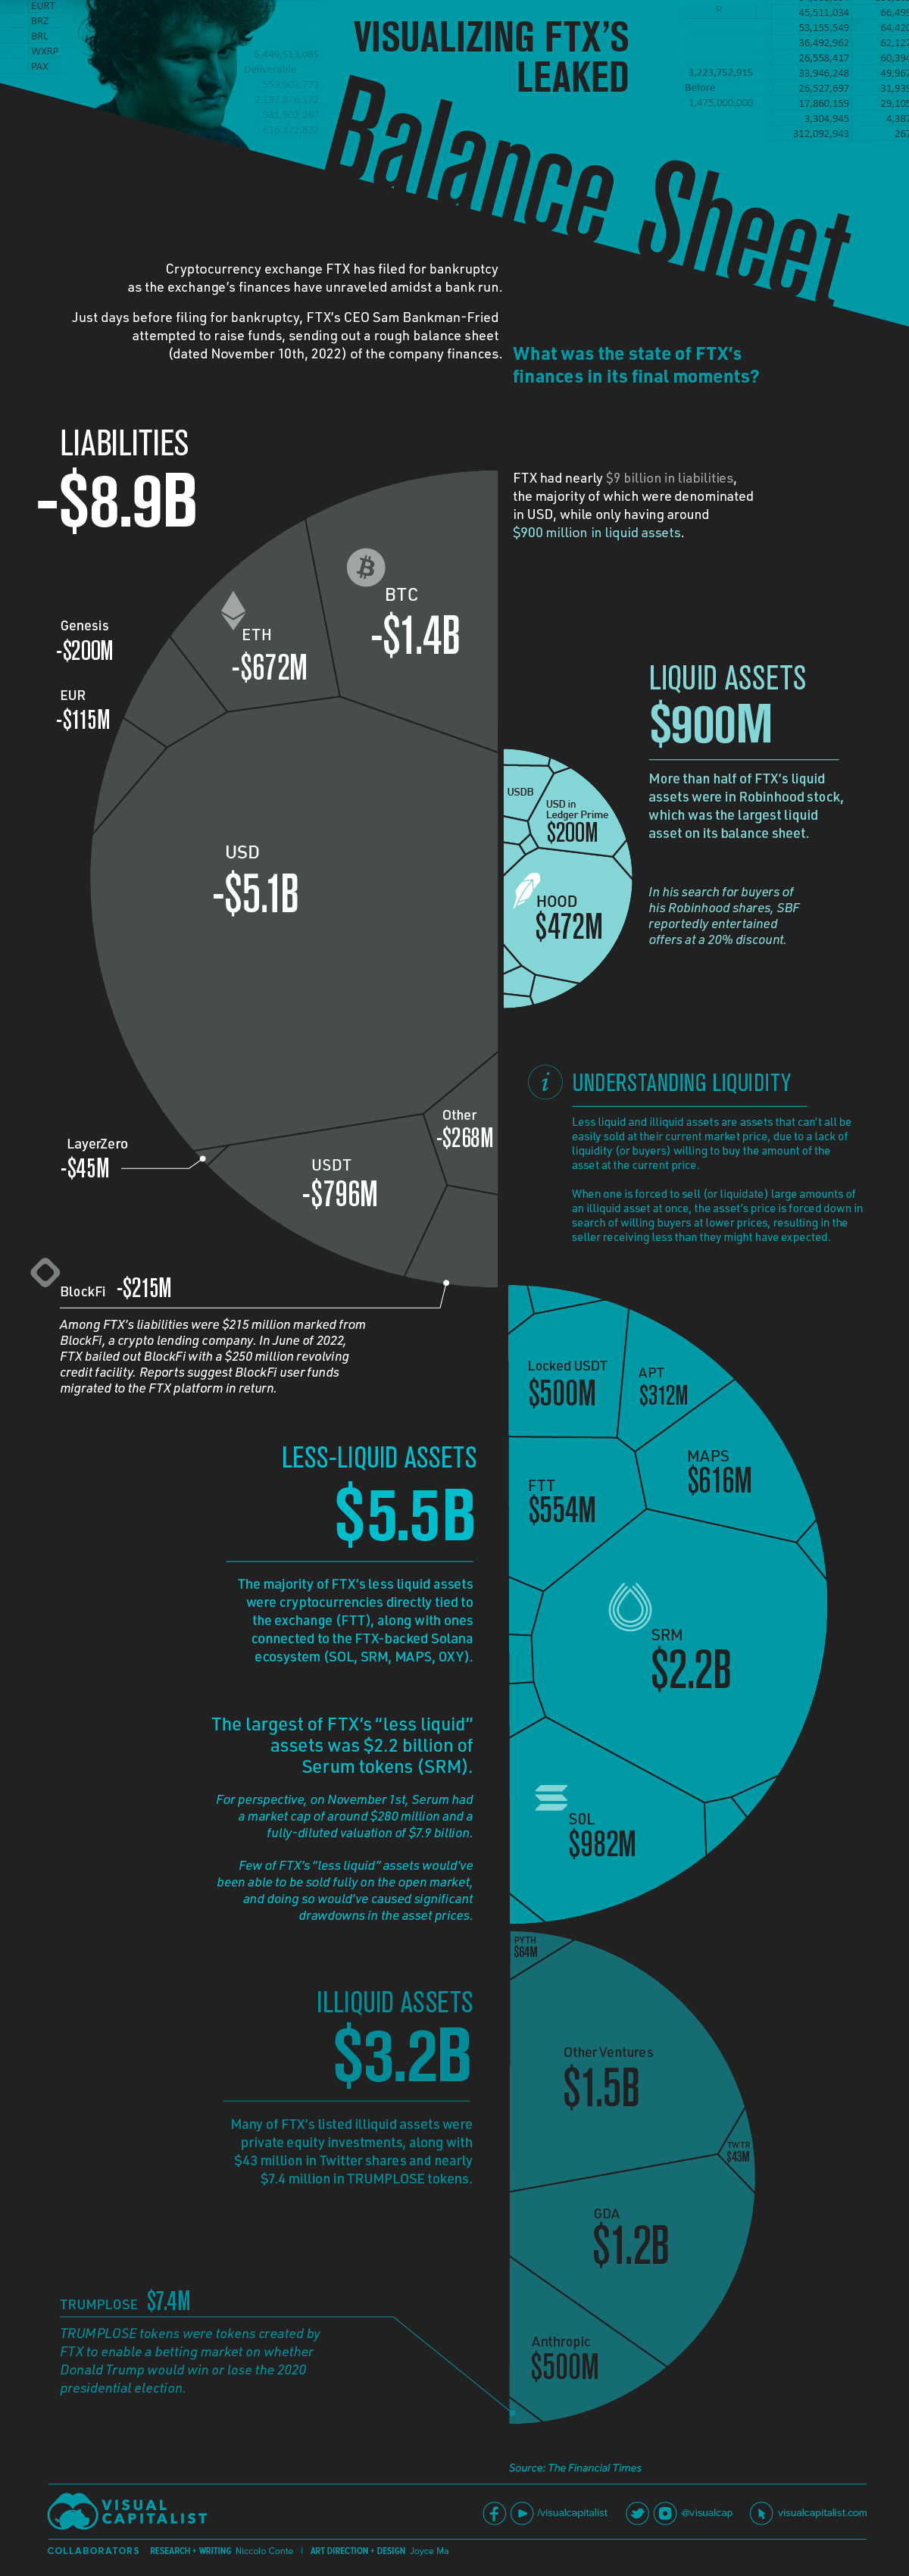
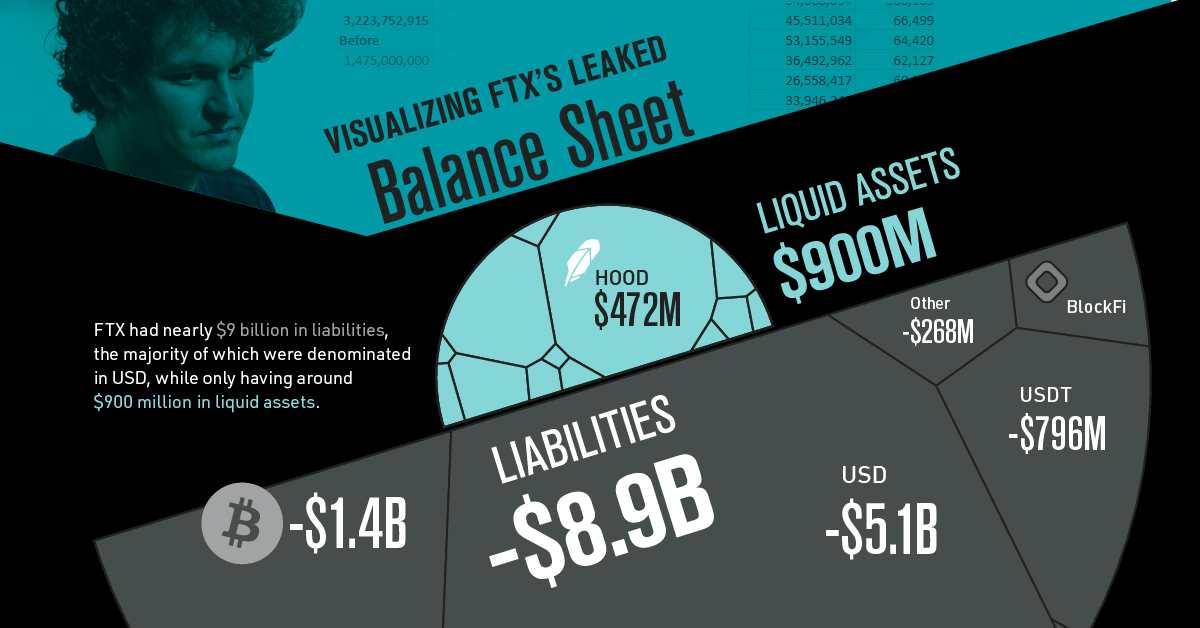
This graphic visualizes FTX’s leaked balance sheet dated to November 10th, and published by the Financial Times on November 12th. The spreadsheet shows nearly $9 billion in liabilities and not nearly enough illiquid cryptocurrency assets to cover the hole.
How did FTX wind up in this position?
How FTX’s Bankruptcy Unfolded
FTX’s eventual bankruptcy was sparked by a report on November 2nd by CoinDesk citing Alameda Research’s balance sheet. The article reported Alameda’s assets to be $14.6 billion, including $3.66 billion worth of unlocked FTT and $2.16 billion of FTT collateral.
With more than one-third of Alameda’s assets tied up in FTX’s exchange token FTT (including loans backed by the token), eyebrows were raised among the crypto community.
Four days later on November 6th, Alameda Research’s CEO, Caroline Ellison, and Sam Bankman-Fried addressed the CoinDesk story as unfounded rumors. However, on the same day, Binance CEO Changpeng Zhao (CZ) announced that Binance had decided to liquidate all remaining FTT on their books, kicking off a -7.6% decline in the FTT token on the day.
Back and Forth with Binance’s CZ
While Ellison publicly offered to buy CZ’s FTT directly “over the counter” to avoid further price declines and SBF claimed in a now-deleted tweet that “FTX is fine. Assets are fine.”, FTX users were withdrawing their funds from the exchange.
Less than 24 hours later on November 7th, both SBF and CZ tweeted that Binance had signed a non-binding letter of intent for the acquisition of FTX, pending due diligence.
The next day, the acquisition fell apart as Binance cited corporate due diligence, leaving SBF to face a multi-directional liquidity crunch of users withdrawing funds and rapidly declining token prices that made up large amounts of FTX and Alameda’s assets and collateral for loans.
FTX’s Liabilities and Largely Illiquid Assets
In the final days before declaring bankruptcy, FTX CEO Sam Bankman-Fried attempted a final fundraising in order restore stability while billions in user funds were being withdrawn from his exchange.
The balance sheet he sent around to prospective investors was leaked by the Financial Times, and reveals the exchange had nearly $9 billion in liabilities while only having just over $1 billion in liquid assets. Alongside the liquid assets were $5.4 billion in assets labeled as “less liquid” and $3.2 billion labeled as “illiquid”.
When examining the assets listed, FTX’s accounting appears to be poorly done at best, and fraudulently deceptive at worst.
Of those “less liquid” assets, many of the largest sums were in assets like FTX’s own exchange token and cryptocurrencies of the Solana ecosystem, which were heavily supported by FTX and Sam Bankman-Fried. On top of this, for many of these coins the liquidity simply wouldn’t have been there if FTX had attempted to redeem these cryptocurrencies for U.S. dollars or stablecoin equivalents.
While the liquid and less liquid assets on the balance sheet amounted to $6.3 billion (still not enough to equal the $8.9 billion in liabilities), many of these “less liquid” assets may as well have been completely illiquid.
Relationship with Alameda Research
When looking at FTX’s financials in isolation, it’s impossible to understand how one of crypto’s largest exchanges ended up with such a lopsided and illiquid balance sheet. Many of the still unfolding details lie in the exchange’s relationship with SBF’s previous venture that he founded, trading firm Alameda Research.
Founded by SBF in 2017, Alameda Research primarily operated as a delta-neutral (a term that describes trading strategies like market making and arbitrage that attempt to avoid taking directional risk) trading firm. In the summer of 2021, SBF stepped down from Alameda Research to focus on FTX, however his influence and connection with the firm was still deeply ingrained.
A report from the Wall Street Journal cites how Alameda was able to amass crypto tokens ahead of their announced public FTX listings, which were often catalysts in price surges. Alongside this, a Reuters story has revealed how SBF secretly moved $10 billion in funds to Alameda, using a bookkeeping “back door” to avoid internal scrutiny at FTX.
While SBF responded to the Reuters story by saying they “had confusing internal labeling and misread it,” there are few doubts that this murky relationship between Alameda Research and FTX was a fatal one for the former billionaire’s empire.


Markets
U.S. Debt Interest Payments Reach $1 Trillion
U.S. debt interest payments have surged past the $1 trillion dollar mark, amid high interest rates and an ever-expanding debt burden.


U.S. Debt Interest Payments Reach $1 Trillion
This was originally posted on our Voronoi app. Download the app for free on iOS or Android and discover incredible data-driven charts from a variety of trusted sources.
The cost of paying for America’s national debt crossed the $1 trillion dollar mark in 2023, driven by high interest rates and a record $34 trillion mountain of debt.
Over the last decade, U.S. debt interest payments have more than doubled amid vast government spending during the pandemic crisis. As debt payments continue to soar, the Congressional Budget Office (CBO) reported that debt servicing costs surpassed defense spending for the first time ever this year.
This graphic shows the sharp rise in U.S. debt payments, based on data from the Federal Reserve.
A $1 Trillion Interest Bill, and Growing
Below, we show how U.S. debt interest payments have risen at a faster pace than at another time in modern history:
| Date | Interest Payments | U.S. National Debt |
|---|---|---|
| 2023 | $1.0T | $34.0T |
| 2022 | $830B | $31.4T |
| 2021 | $612B | $29.6T |
| 2020 | $518B | $27.7T |
| 2019 | $564B | $23.2T |
| 2018 | $571B | $22.0T |
| 2017 | $493B | $20.5T |
| 2016 | $460B | $20.0T |
| 2015 | $435B | $18.9T |
| 2014 | $442B | $18.1T |
| 2013 | $425B | $17.2T |
| 2012 | $417B | $16.4T |
| 2011 | $433B | $15.2T |
| 2010 | $400B | $14.0T |
| 2009 | $354B | $12.3T |
| 2008 | $380B | $10.7T |
| 2007 | $414B | $9.2T |
| 2006 | $387B | $8.7T |
| 2005 | $355B | $8.2T |
| 2004 | $318B | $7.6T |
| 2003 | $294B | $7.0T |
| 2002 | $298B | $6.4T |
| 2001 | $318B | $5.9T |
| 2000 | $353B | $5.7T |
| 1999 | $353B | $5.8T |
| 1998 | $360B | $5.6T |
| 1997 | $368B | $5.5T |
| 1996 | $362B | $5.3T |
| 1995 | $357B | $5.0T |
| 1994 | $334B | $4.8T |
| 1993 | $311B | $4.5T |
| 1992 | $306B | $4.2T |
| 1991 | $308B | $3.8T |
| 1990 | $298B | $3.4T |
| 1989 | $275B | $3.0T |
| 1988 | $254B | $2.7T |
| 1987 | $240B | $2.4T |
| 1986 | $225B | $2.2T |
| 1985 | $219B | $1.9T |
| 1984 | $205B | $1.7T |
| 1983 | $176B | $1.4T |
| 1982 | $157B | $1.2T |
| 1981 | $142B | $1.0T |
| 1980 | $113B | $930.2B |
| 1979 | $96B | $845.1B |
| 1978 | $84B | $789.2B |
| 1977 | $69B | $718.9B |
| 1976 | $61B | $653.5B |
| 1975 | $55B | $576.6B |
| 1974 | $50B | $492.7B |
| 1973 | $45B | $469.1B |
| 1972 | $39B | $448.5B |
| 1971 | $36B | $424.1B |
| 1970 | $35B | $389.2B |
| 1969 | $30B | $368.2B |
| 1968 | $25B | $358.0B |
| 1967 | $23B | $344.7B |
| 1966 | $21B | $329.3B |
Interest payments represent seasonally adjusted annual rate at the end of Q4.
At current rates, the U.S. national debt is growing by a remarkable $1 trillion about every 100 days, equal to roughly $3.6 trillion per year.
As the national debt has ballooned, debt payments even exceeded Medicaid outlays in 2023—one of the government’s largest expenditures. On average, the U.S. spent more than $2 billion per day on interest costs last year. Going further, the U.S. government is projected to spend a historic $12.4 trillion on interest payments over the next decade, averaging about $37,100 per American.
Exacerbating matters is that the U.S. is running a steep deficit, which stood at $1.1 trillion for the first six months of fiscal 2024. This has accelerated due to the 43% increase in debt servicing costs along with a $31 billion dollar increase in defense spending from a year earlier. Additionally, a $30 billion increase in funding for the Federal Deposit Insurance Corporation in light of the regional banking crisis last year was a major contributor to the deficit increase.
Overall, the CBO forecasts that roughly 75% of the federal deficit’s increase will be due to interest costs by 2034.

-

 Maps2 weeks ago
Mapped: Average Wages Across Europe
-

 Money1 week ago
Which States Have the Highest Minimum Wage in America?
-

 Real Estate1 week ago
Ranked: The Most Valuable Housing Markets in America
-

 Markets1 week ago
Charted: Big Four Market Share by S&P 500 Audits
-

 AI1 week ago
The Stock Performance of U.S. Chipmakers So Far in 2024
-

 Automotive2 weeks ago
Almost Every EV Stock is Down After Q1 2024
-

 Money2 weeks ago
Where Does One U.S. Tax Dollar Go?
-

 Green2 weeks ago
Ranked: Top Countries by Total Forest Loss Since 2001