Jobs
This Infographic Breaks Down Careers In Finance, From Hedge Funds to M&A
Careers In Corporate Finance, From Hedge Funds to M&A
Corporate finance is a key pillar on which modern markets and economies have been built. And this complex ecosystem consists of a number of important sectors, which can lead to lucrative career avenues.
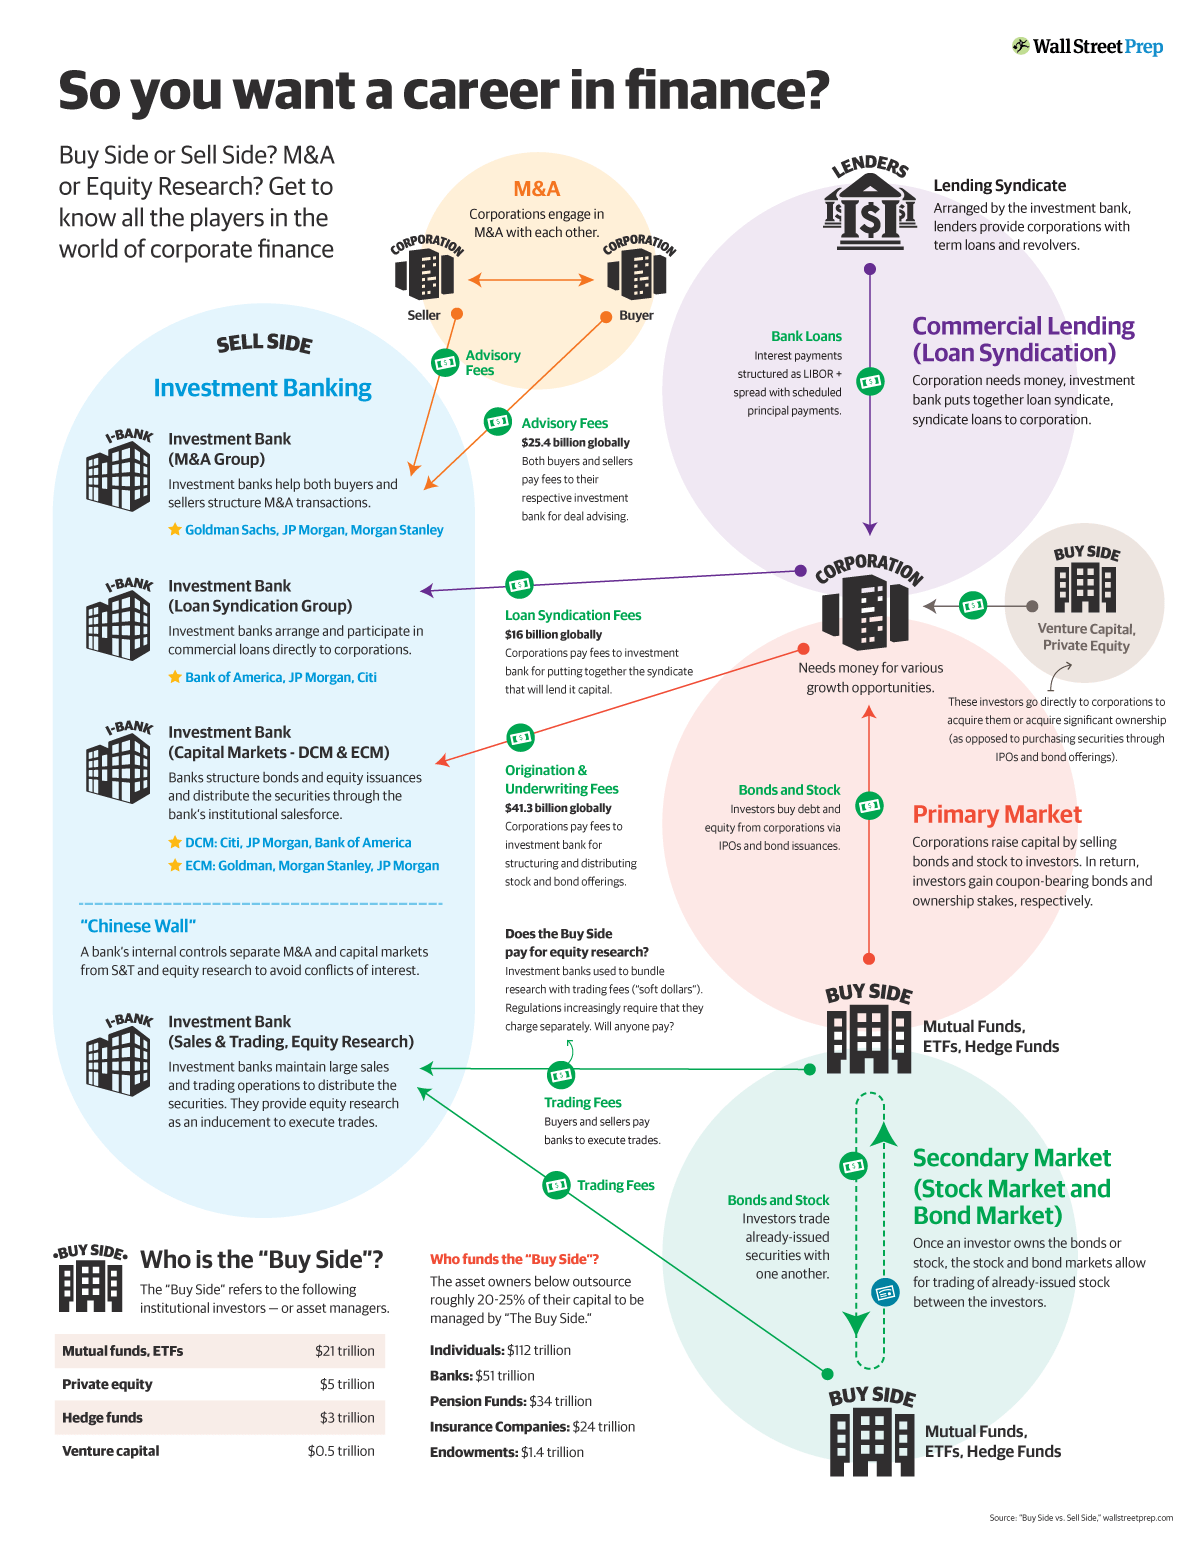
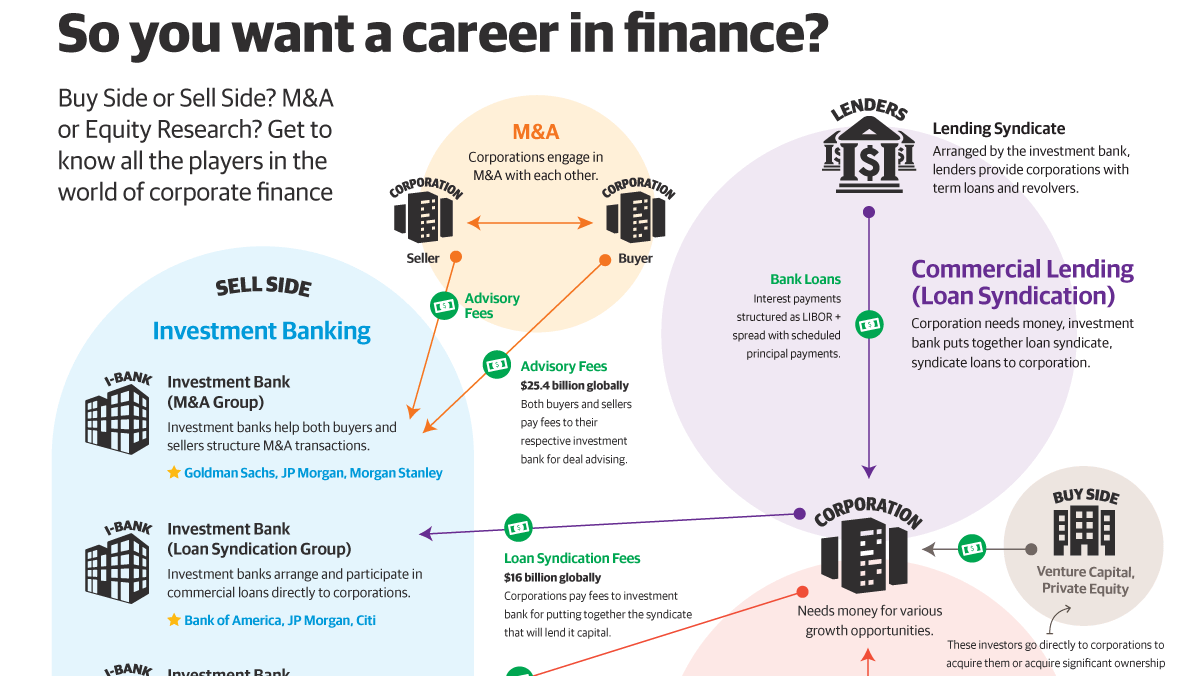
From lending to investment banking, and private equity to hedge funds, the graphic above by Wall Street Prep breaks down the key finance careers and paths that people can take.
Let’s take a further look at the unique pieces of this finance ecosystem.
The Lending Business
Lending groups provide much needed capital to corporations, often in the form of term loans or revolvers. These can be part of short and long-term operations or for events less anticipated like the COVID-19 pandemic, which resulted in companies shoring up $222 billion in revolving lines of credit within the first month.
Investment Banking
Next, is investment banking, which can split into three main areas:
- Mergers and Acquisitions (M&A): There’s a lot of preparation and paperwork involved whenever corporations merge or make acquisitions. For that reason, this is a crucial service that investment banks provide, and its importance is reflected in the enormous fees recognized. The top five U.S. investment banks collect $10.2 billion in M&A advisory fees, representing 40% of the $25 billion in global M&A fees per year.
- Loan Syndications: Some $16 billion in loan syndication fees are collected annually by investment banks. Loan syndications are when multiple lenders fund one borrower, which can occur when the loan amount is too large or risky for one party to take on. The loan syndication agent is the financial institution involved that acts as the third party to oversee the transaction.
- Capital Markets: Capital markets are financial markets that bring buyers and sellers together to engage in transactions on assets. They split into debt capital markets (DCM) like bonds or fixed income securities and equity capital markets (ECM) (i.e. stocks). Some $41 billion is collected globally for the services associated with structuring and distributing stock and bond offerings.
The top investment banks generally all come from the U.S. and Western Europe, and includes the likes of Goldman Sachs and Credit Suisse.
Sell Side vs Buy Side
Thousands of analysts in corporate finance represent both the buy and sell-sides of the business, but what are the differences between them?
One important difference is in the groups they represent. Buy-side analysts usually work for institutions that buy securities directly, like hedge funds, while sell-side analysts represent institutions that make their money by selling or issuing securities, like investment banks.
According to Wall Street Prep, here’s how the assets of buy-side institutions compare:
| Buy side institution | Total assets |
|---|---|
| Mutual Funds, ETFs | $21 trillion |
| Private equity | $5 trillion |
| Hedge funds | $3 trillion |
| Venture capital | $0.5 trillion |
Also, buy-side jobs appear to be more sought after across financial career forums.
Breaking Down The Buy Side
Mutual funds, ETFs, and hedge funds all generally invest in public markets.
But between them, there are still some differentiating factors. For starters, mutual funds are the largest entity, and have been around since 1924. Hedge funds didn’t come to life until around 1950 and for ETFs, this stretched to the 1990s.
Furthermore, hedge funds are strict in the clients they take on, with a preference for high net worth investors, and they often engage in sophisticated investment strategies like short selling. In contrast, ETFs, and mutual funds are widely available to the public and the vast bulk of them only deploy long strategies, which are those that expect the asset to rise in value.
Private equity (PE) and venture capital (VC) are groups that invest in private companies. Venture capital is technically a form of PE but tends to invest in new startup companies while private equity goes for more stable and mature companies with predictable cash flow patterns.
Who funds the buy side? The source of capital roughly breaks down as follows:
| Source of capital | Capital amount |
|---|---|
| Individuals | $112 trillion |
| Banks | $51 trillion |
| Pension funds | $34 trillion |
| Insurance Companies | $24 trillion |
| Endowments | $1.4 trillion |
Endowment funds are foundations that invest the assets of nonprofit institutions like hospitals or universities. The assets are typically accumulated through donations, and withdrawals are made frequently to fund various parts of operations, including critical ones like research.
The largest university endowment belongs to Harvard with some $74 billion in assets under management. However, the largest endowment fund overall belongs to Ensign Peak Advisors. They represent The Church of Jesus Christ of Latter-day Saints (LDS), with some $124 billion in assets.
Primary Market vs Secondary Market
One of the primary motivations for a company to enter the public markets is to raise capital, where a slice of the company’s ownership is sold via an allotment of shares to new investors. The actual capital itself is raised in the primary market, which represents the first and initial transaction.
The secondary market represents transactions after the first. These are considered stocks that are already issued, and shares now fluctuate based on market forces.
Tying It All Together
As the infographic above shows, corporate finance branches out far and wide, handles trillions of dollars, and plays a key part in making modern markets and economies possible.
For those exploring a career in finance, the possibilities and avenues one can take are practically endless.


Economy
Mapped: Unemployment Claims by State
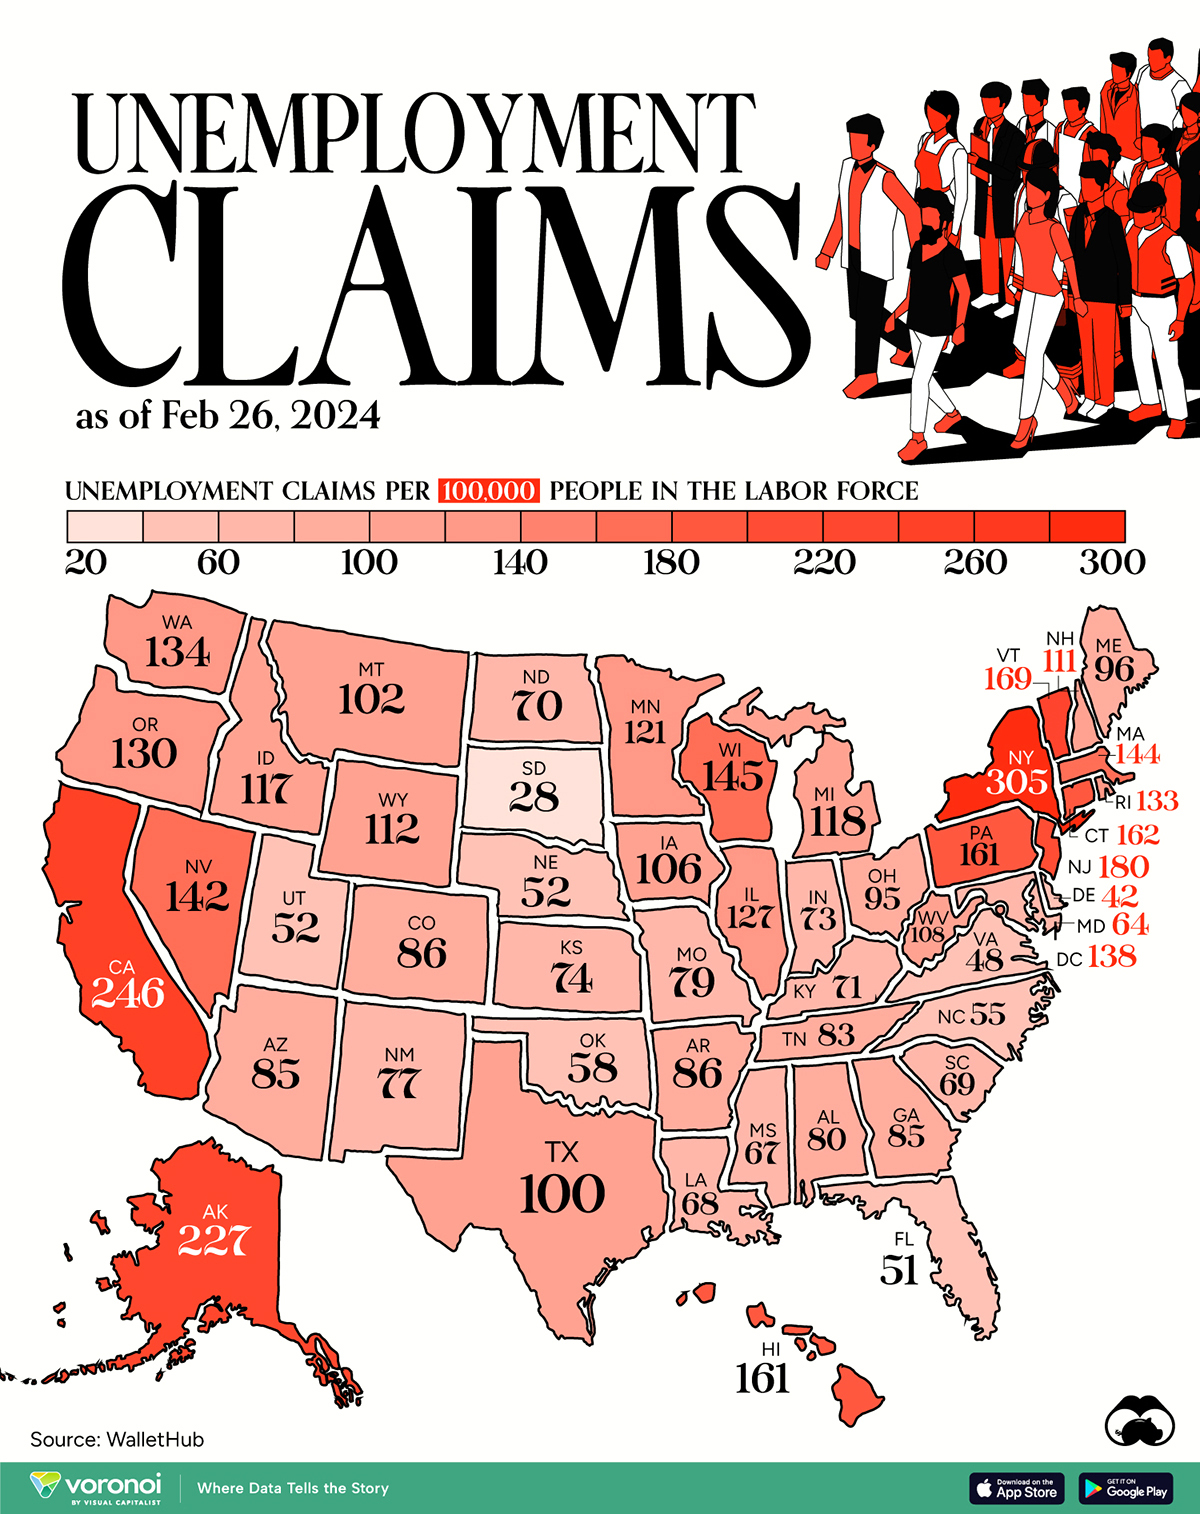
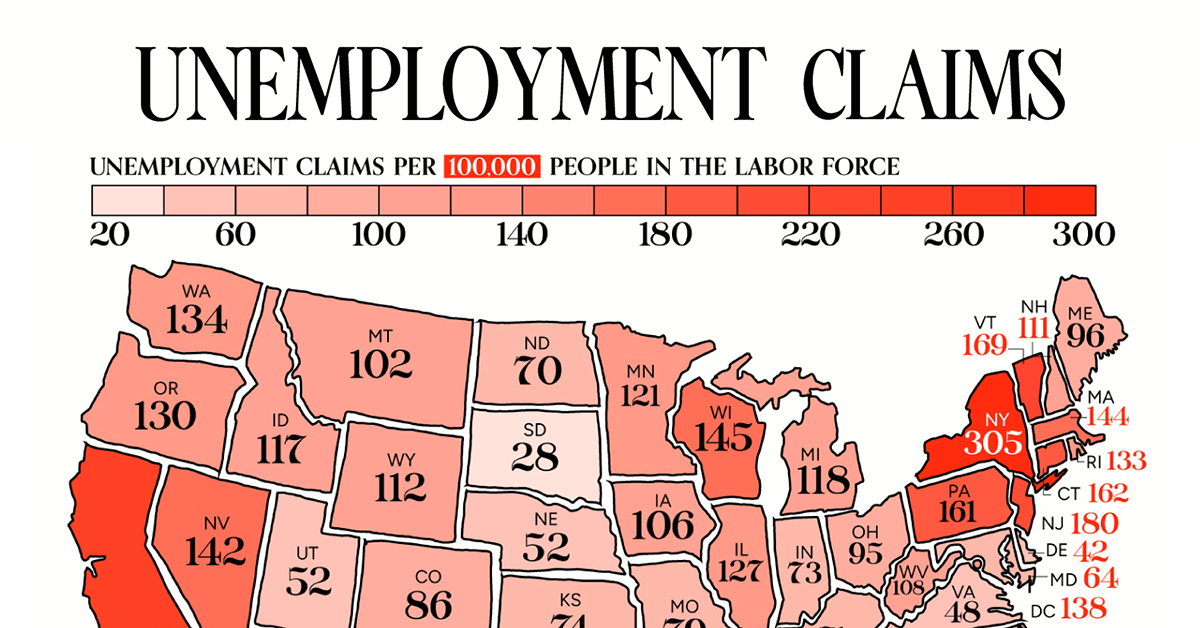
This visual heatmap of unemployment claims by state highlights New York, California, and Alaska leading the country by a wide margin.
Mapped: Weekly Unemployment Claims by State
This was originally posted on our Voronoi app. Download the app for free on iOS or Android and discover incredible data-driven charts from a variety of trusted sources.
Unemployment claims per 100,000 people is a handy metric for gauging the health of the job market. Generally speaking, a higher number of claims suggests that more people are unemployed, which may highlight issues with the economy.
In this graphic, we’ve visualized the number of weekly initial unemployment claims per 100,000 people in the labor force across the U.S., using data from WalletHub. All figures are for the week ending Feb 26, 2024, with data being released in early March.
| State | Unemployment Claims per 100,000 People in the Labor Force |
|---|---|
| New York | 305 |
| California | 246 |
| Alaska | 227 |
| New Jersey | 180 |
| Vermont | 169 |
| Connecticut | 162 |
| Pennsylvania | 161 |
| Hawaii | 161 |
| Wisconsin | 145 |
| Massachusetts | 144 |
| Nevada | 142 |
| DC | 138 |
| Washington | 134 |
| Rhode Island | 133 |
| Oregon | 130 |
| Illinois | 127 |
| Minnesota | 121 |
| Michigan | 118 |
| Idaho | 117 |
| Wyoming | 112 |
| New Hampshire | 111 |
| West Virginia | 108 |
| Iowa | 106 |
| Montana | 102 |
| Texas | 100 |
| Maine | 96 |
| Ohio | 95 |
| Colorado | 86 |
| Arkansas | 86 |
| Arizona | 85 |
| Georgia | 85 |
| Tennessee | 83 |
| Alabama | 80 |
| Missouri | 79 |
| New Mexico | 77 |
| Kansas | 74 |
| Indiana | 73 |
| Kentucky | 71 |
| North Dakota | 70 |
| South Carolina | 69 |
| Louisiana | 68 |
| Mississippi | 67 |
| Maryland | 64 |
| Oklahoma | 58 |
| North Carolina | 55 |
| Nebraska | 52 |
| Utah | 52 |
| Florida | 51 |
| Virginia | 48 |
| Delaware | 42 |
| South Dakota | 28 |
Across the country, there are 6.1 million Americans unemployed as of end of February, resulting in a national unemployment rate of around 3.9%. Notably, this is the highest figure seen since January 2022.
States With the Largest Increases
For further context, we can examine the change in unemployment claims by state for the period of Jan 1- Feb 26, in 2024 and 2023.
States that saw the biggest rise over this period were New York, New Jersey, and Nevada. A top 10 list can be found below.
| State | Change in Unemployment Claims (Jan-Feb, 2023 vs 2024) |
|---|---|
| New York | 2,725% |
| New Jersey | 2,132% |
| Nevada | 505% |
| Arizona | 51% |
| Iowa | 45% |
| Maryland | 35% |
| North Carolina | 34% |
| Virginia | 31% |
| Montana | 25% |
| Oklahoma | 24% |
From a broader perspective, weekly initial claims for unemployment insurance across the U.S. have hovered around the low 200,000s in 2024. This is generally in line with figures seen prior to the COVID-19 pandemic.
In the week of April 4, 2020, unemployment claims spiked to 6.137 million due to COVID-related lockdowns and business closures.
Learn More About the U.S Job Market
Before you go, be sure to check out Visualizing the American Workforce as 100 People to gain a unique perspective on the U.S. economy.

-

 Markets1 week ago
U.S. Debt Interest Payments Reach $1 Trillion
-

 Markets2 weeks ago
Ranked: The Most Valuable Housing Markets in America
-

 Money2 weeks ago
Which States Have the Highest Minimum Wage in America?
-

 AI2 weeks ago
Ranked: Semiconductor Companies by Industry Revenue Share
-

 Markets2 weeks ago
Ranked: The World’s Top Flight Routes, by Revenue
-

 Countries2 weeks ago
Population Projections: The World’s 6 Largest Countries in 2075
-

 Markets2 weeks ago
The Top 10 States by Real GDP Growth in 2023
-

 Money2 weeks ago
The Smallest Gender Wage Gaps in OECD Countries