Markets
3 Insights From the FED’s Latest Economic Snapshot
3 Insights From the Latest U.S. Economic Data
Each month, the Federal Reserve Bank of New York publishes monthly economic snapshots.
To make this report accessible to a wider audience, we’ve identified the three most important takeaways from the report and compiled them into one infographic.
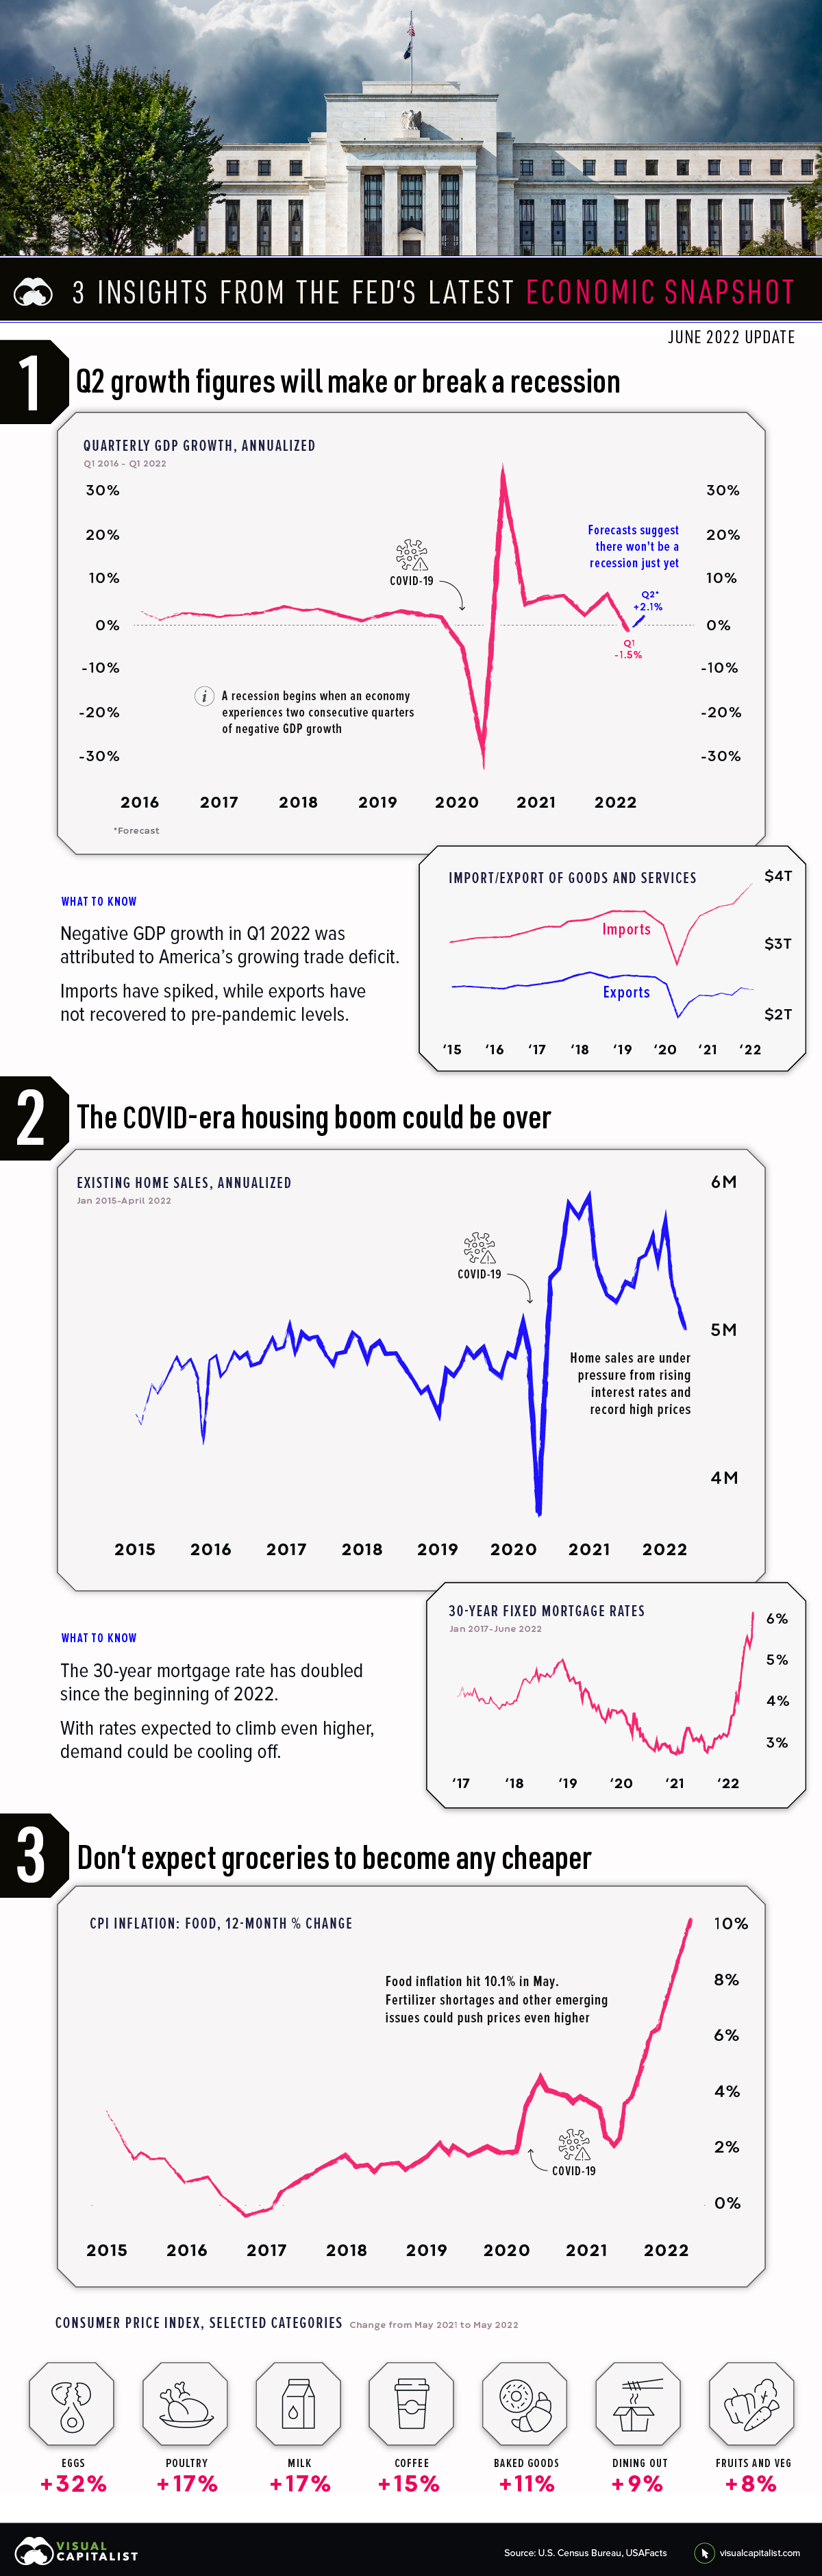
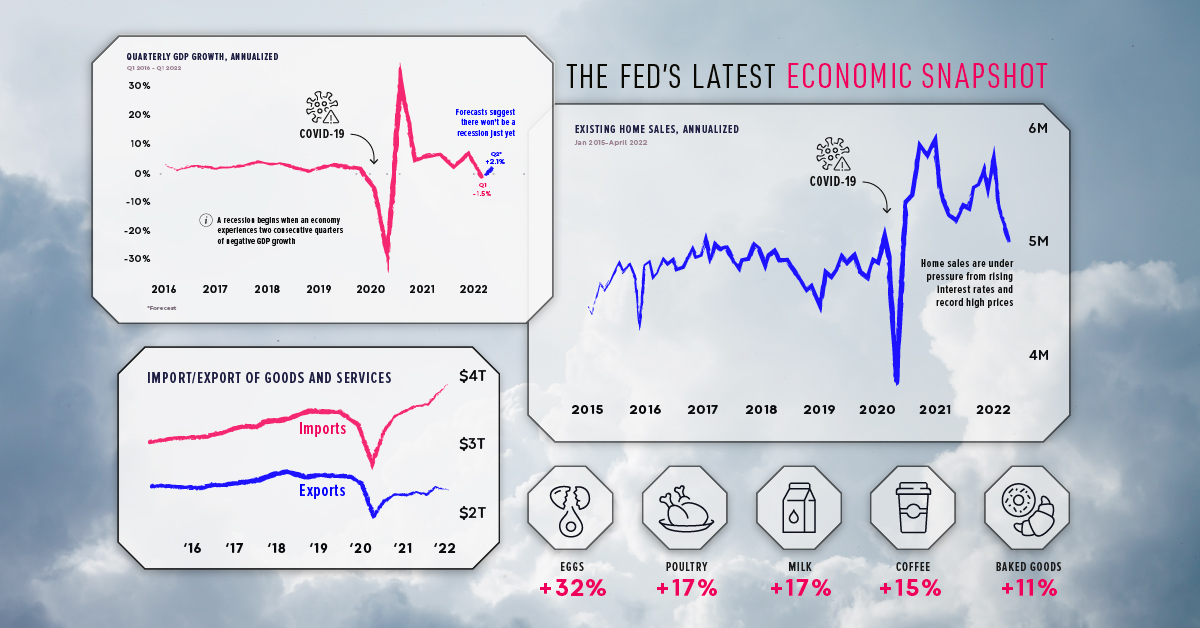
1. Growth figures in Q2 will make or break a recession
Generally speaking, a recession begins when an economy exhibits two consecutive quarters of negative GDP growth. Because U.S. GDP shrank by -1.5% in Q1 2022 (January to March), a lot rests on the Q2 figure (April to June) which should be released on July 28th.
Referencing strong business activity and continued growth in consumer spending, economists predict that U.S. GDP will grow by +2.1% in Q2. This would mark a decisive reversal from Q1, and put an end to recessionary fears for the time being.
Unfortunately, inflation is the top financial concern for Americans, and this is dampening consumer confidence. Shown below, the consumer confidence index reflects the public’s short-term outlook for income, business, and labor conditions.
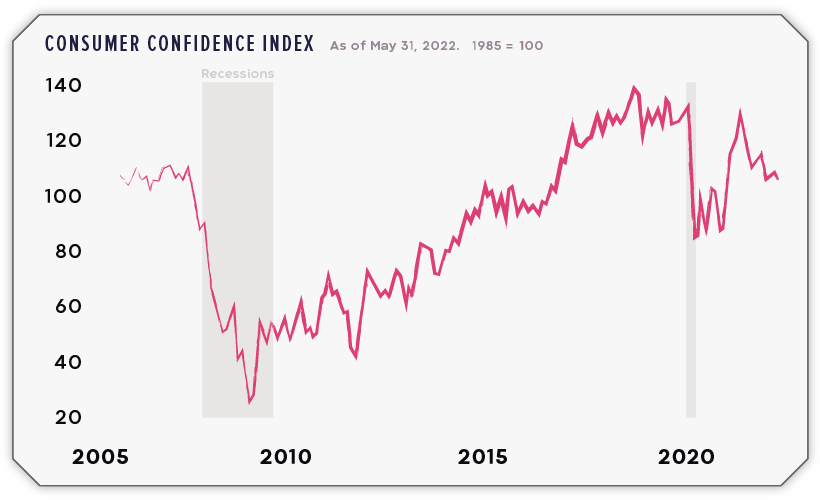
Falling consumer confidence suggests that more people will delay big purchases such as cars, major appliances, and vacations.
2. The COVID-era housing boom could be over
Housing markets have been riding high since the beginning of the COVID-19 pandemic, but this run is likely coming to an end. Here’s a summary of what’s happened since 2020:
- Lockdowns in early 2020 created lots of pent-up demand for homes
- Greater household savings and record-low mortgage rates pushed demand even further
- Supply chain disruptions greatly increased the cost of materials like lumber
- Construction of new homes couldn’t keep up, and housing supply fell to historic lows
Today, home prices are at record highs and the cost of borrowing is rapidly rising. For evidence, look no further than the 30-year fixed mortgage rate, which has doubled to more than 6% since the beginning of 2022.
Given these developments, the drop in the number of home sales could be a sign that many Americans are being priced out of the market.
3. Don’t expect groceries to become any cheaper
Inflation has been a hot topic this year, especially with gas prices reaching $5 a gallon. But there’s one category of goods that’s perhaps even more alarming: food.
The following table includes food inflation over the past three years, as the percent change over the past 12 months.
| Date | CPI Food Component (%) |
|---|---|
| 2018-02-01 | 1.4% |
| 2019-05-01 | 2.0% |
| 2019-06-01 | 1.9% |
| 2019-07-01 | 1.8% |
| 2019-08-01 | 1.7% |
| 2019-09-01 | 1.8% |
| 2019-10-01 | 2.1% |
| 2019-11-01 | 2.0% |
| 2019-12-01 | 1.8% |
| 2020-01-01 | 1.8% |
| 2020-02-01 | 1.8% |
| 2020-03-01 | 1.9% |
| 2020-04-01 | 3.5% |
| 2020-05-01 | 4.0% |
| 2020-06-01 | 4.5% |
| 2020-07-01 | 4.1% |
| 2020-08-01 | 4.1% |
| 2020-09-01 | 4.0% |
| 2020-10-01 | 3.9% |
| 2020-11-01 | 3.7% |
| 2020-12-01 | 3.9% |
| 2021-01-01 | 3.8% |
| 2021-02-01 | 3.6% |
| 2021-03-01 | 3.5% |
| 2021-04-01 | 2.4% |
| 2021-05-01 | 2.1% |
| 2021-06-01 | 2.4% |
| 2021-07-01 | 3.4% |
| 2021-08-01 | 3.7% |
| 2021-09-01 | 4.6% |
| 2021-10-01 | 5.3% |
| 2021-11-01 | 6.1% |
| 2021-12-01 | 6.3% |
| 2022-01-01 | 7.0% |
| 2022-02-01 | 7.9% |
| 2022-03-01 | 8.8% |
| 2022-04-01 | 9.4% |
| 2022-05-01 | 10.1% |
From this data, we can see that food inflation really picked up speed in April 2020, jumping to +3.5% from +1.9% in the previous month. This was due to supply chain disruptions and a sudden rebound in global demand.
Fast forward to today, and food inflation is running rampant at 10.1%. A contributing factor is the impending fertilizer shortage, which stems from the Ukraine war. As it turns out, Russia is not only a massive exporter of oil, but wheat and fertilizer as well.


Markets
U.S. Debt Interest Payments Reach $1 Trillion
U.S. debt interest payments have surged past the $1 trillion dollar mark, amid high interest rates and an ever-expanding debt burden.


U.S. Debt Interest Payments Reach $1 Trillion
This was originally posted on our Voronoi app. Download the app for free on iOS or Android and discover incredible data-driven charts from a variety of trusted sources.
The cost of paying for America’s national debt crossed the $1 trillion dollar mark in 2023, driven by high interest rates and a record $34 trillion mountain of debt.
Over the last decade, U.S. debt interest payments have more than doubled amid vast government spending during the pandemic crisis. As debt payments continue to soar, the Congressional Budget Office (CBO) reported that debt servicing costs surpassed defense spending for the first time ever this year.
This graphic shows the sharp rise in U.S. debt payments, based on data from the Federal Reserve.
A $1 Trillion Interest Bill, and Growing
Below, we show how U.S. debt interest payments have risen at a faster pace than at another time in modern history:
| Date | Interest Payments | U.S. National Debt |
|---|---|---|
| 2023 | $1.0T | $34.0T |
| 2022 | $830B | $31.4T |
| 2021 | $612B | $29.6T |
| 2020 | $518B | $27.7T |
| 2019 | $564B | $23.2T |
| 2018 | $571B | $22.0T |
| 2017 | $493B | $20.5T |
| 2016 | $460B | $20.0T |
| 2015 | $435B | $18.9T |
| 2014 | $442B | $18.1T |
| 2013 | $425B | $17.2T |
| 2012 | $417B | $16.4T |
| 2011 | $433B | $15.2T |
| 2010 | $400B | $14.0T |
| 2009 | $354B | $12.3T |
| 2008 | $380B | $10.7T |
| 2007 | $414B | $9.2T |
| 2006 | $387B | $8.7T |
| 2005 | $355B | $8.2T |
| 2004 | $318B | $7.6T |
| 2003 | $294B | $7.0T |
| 2002 | $298B | $6.4T |
| 2001 | $318B | $5.9T |
| 2000 | $353B | $5.7T |
| 1999 | $353B | $5.8T |
| 1998 | $360B | $5.6T |
| 1997 | $368B | $5.5T |
| 1996 | $362B | $5.3T |
| 1995 | $357B | $5.0T |
| 1994 | $334B | $4.8T |
| 1993 | $311B | $4.5T |
| 1992 | $306B | $4.2T |
| 1991 | $308B | $3.8T |
| 1990 | $298B | $3.4T |
| 1989 | $275B | $3.0T |
| 1988 | $254B | $2.7T |
| 1987 | $240B | $2.4T |
| 1986 | $225B | $2.2T |
| 1985 | $219B | $1.9T |
| 1984 | $205B | $1.7T |
| 1983 | $176B | $1.4T |
| 1982 | $157B | $1.2T |
| 1981 | $142B | $1.0T |
| 1980 | $113B | $930.2B |
| 1979 | $96B | $845.1B |
| 1978 | $84B | $789.2B |
| 1977 | $69B | $718.9B |
| 1976 | $61B | $653.5B |
| 1975 | $55B | $576.6B |
| 1974 | $50B | $492.7B |
| 1973 | $45B | $469.1B |
| 1972 | $39B | $448.5B |
| 1971 | $36B | $424.1B |
| 1970 | $35B | $389.2B |
| 1969 | $30B | $368.2B |
| 1968 | $25B | $358.0B |
| 1967 | $23B | $344.7B |
| 1966 | $21B | $329.3B |
Interest payments represent seasonally adjusted annual rate at the end of Q4.
At current rates, the U.S. national debt is growing by a remarkable $1 trillion about every 100 days, equal to roughly $3.6 trillion per year.
As the national debt has ballooned, debt payments even exceeded Medicaid outlays in 2023—one of the government’s largest expenditures. On average, the U.S. spent more than $2 billion per day on interest costs last year. Going further, the U.S. government is projected to spend a historic $12.4 trillion on interest payments over the next decade, averaging about $37,100 per American.
Exacerbating matters is that the U.S. is running a steep deficit, which stood at $1.1 trillion for the first six months of fiscal 2024. This has accelerated due to the 43% increase in debt servicing costs along with a $31 billion dollar increase in defense spending from a year earlier. Additionally, a $30 billion increase in funding for the Federal Deposit Insurance Corporation in light of the regional banking crisis last year was a major contributor to the deficit increase.
Overall, the CBO forecasts that roughly 75% of the federal deficit’s increase will be due to interest costs by 2034.

-

 Real Estate2 weeks ago
Visualizing America’s Shortage of Affordable Homes
-

 Technology1 week ago
Ranked: Semiconductor Companies by Industry Revenue Share
-

 Money1 week ago
Which States Have the Highest Minimum Wage in America?
-

 Real Estate1 week ago
Ranked: The Most Valuable Housing Markets in America
-

 Markets1 week ago
Charted: Big Four Market Share by S&P 500 Audits
-

 AI2 weeks ago
The Stock Performance of U.S. Chipmakers So Far in 2024
-

 Automotive2 weeks ago
Almost Every EV Stock is Down After Q1 2024
-

 Money2 weeks ago
Where Does One U.S. Tax Dollar Go?