Datastream
Ranked: The Fastest Growing Cities in the U.S.


The Briefing
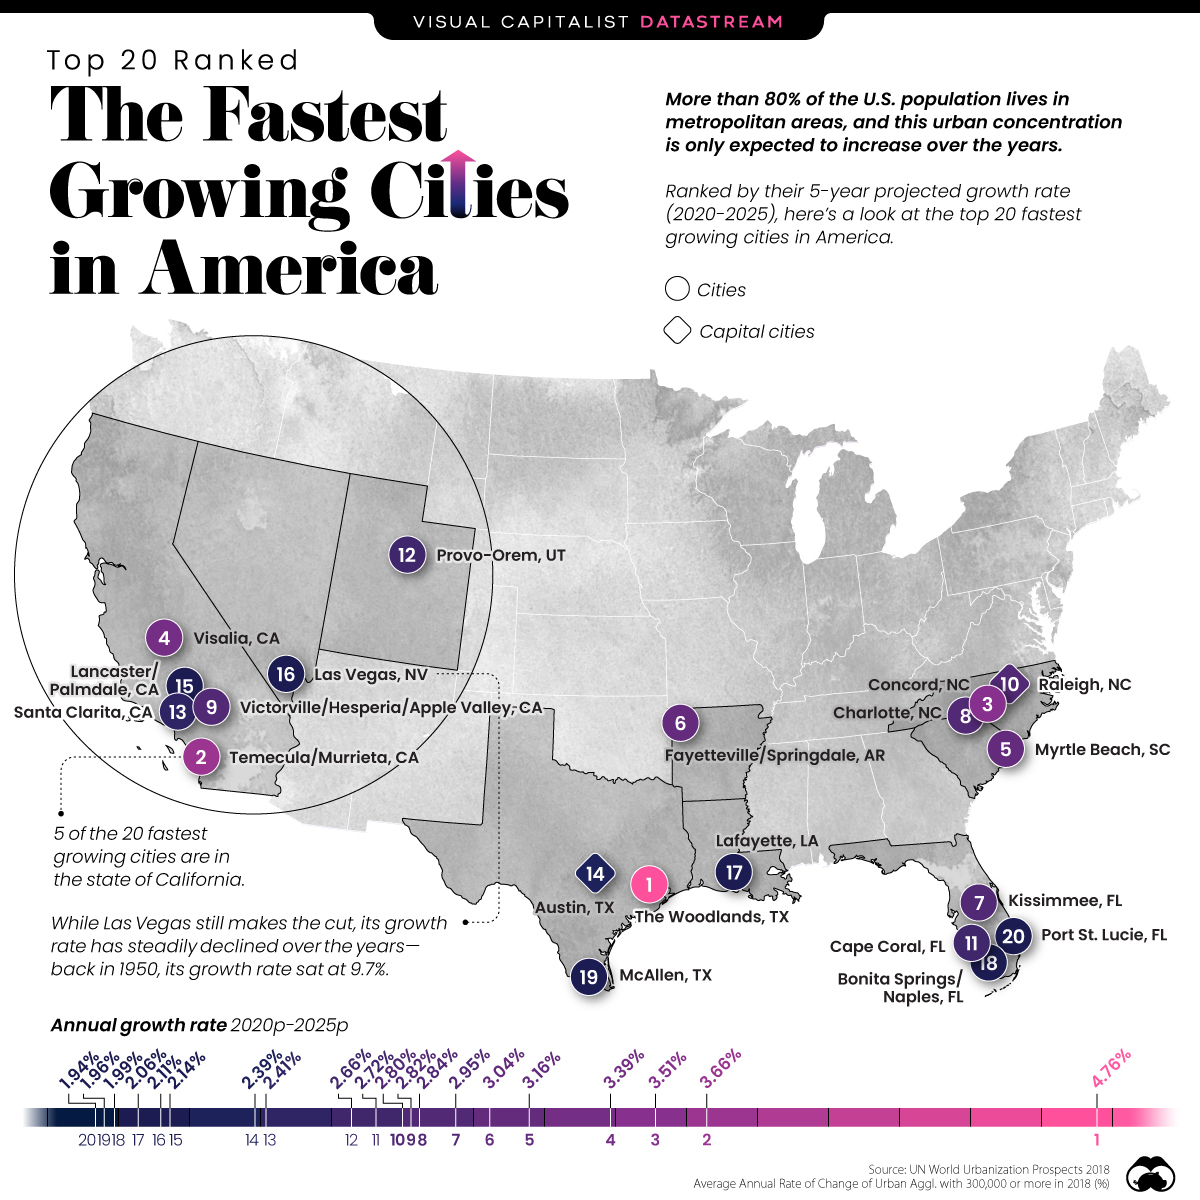
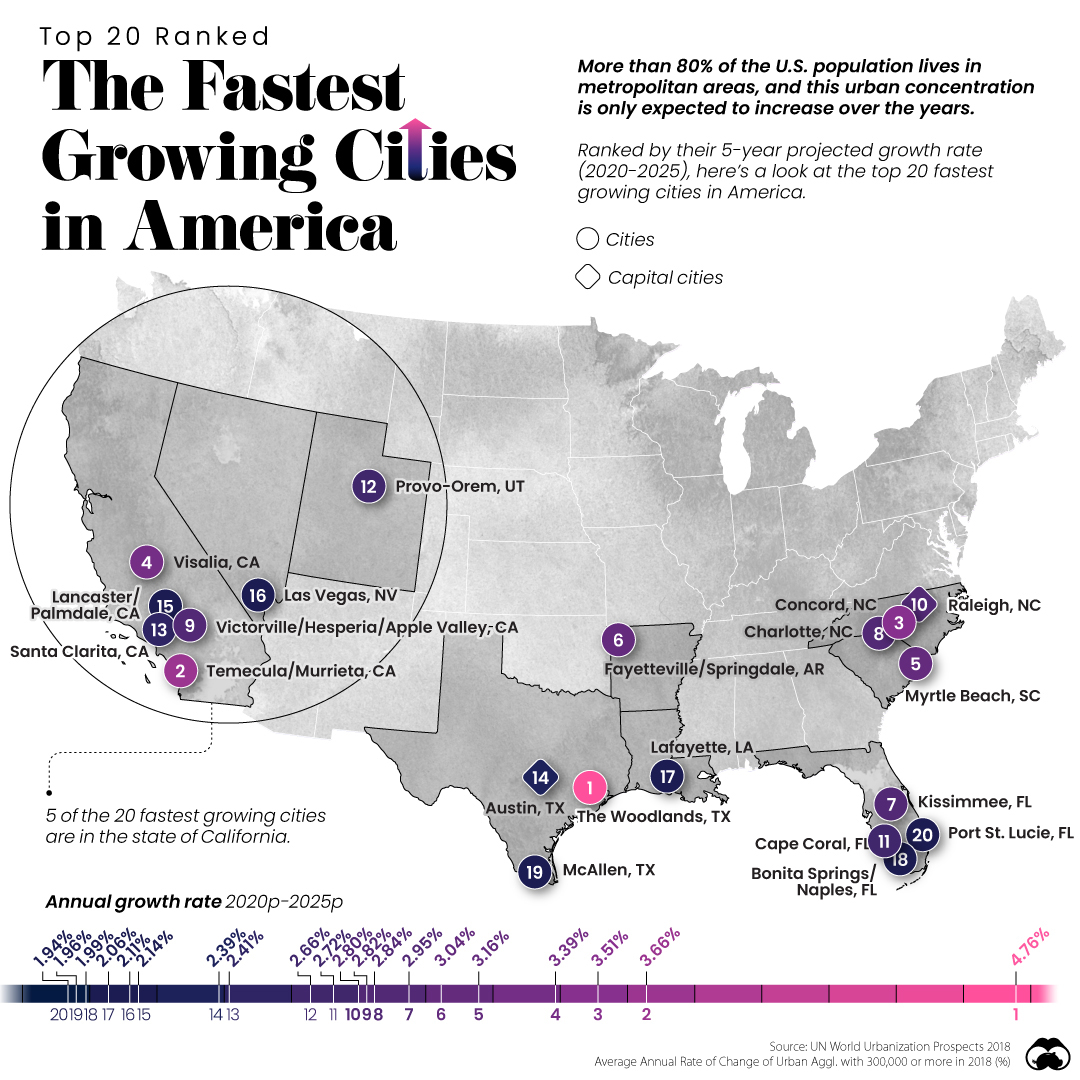
- Five of the 20 fastest growing cities are in California
- However, California’s population growth as a whole has become stagnant over the last few years
- Between 2020-2025, the fastest growing U.S. city is expected to be The Woodlands, TX
Ranked: The Fastest Growing Cities in the U.S.
The world has become increasingly more urbanized, especially in America. Despite being one of the largest countries on the planet, over 80% of the U.S. population currently is concentrated in key metropolitan areas, and this urban concentration is only expected to increase in the coming years.
Which U.S. cities are leading this growth?
Here are the fastest growing urban areas in the U.S. with over 300,000 residents, based on their projected annual growth rate from 2020 to 2025.
| Rank | City | State | Avg. Growth Rate ('20-'25p) |
|---|---|---|---|
| 1 | The Woodlands | Texas | 4.76% |
| 2 | Temecula-Murrieta | California | 3.66% |
| 3 | Concord | North Carolina | 3.51% |
| 4 | Visalia | California | 3.39% |
| 5 | Myrtle Beach | South Carolina | 3.16% |
| 6 | Fayetteville-Springdale | Arkansas | 3.04% |
| 7 | Kissimmee | Florida | 2.95% |
| 8 | Charlotte | North Carolina | 2.84% |
| 9 | Victorville-Hesperia-Apple Valley | California | 2.82% |
| 10 | Raleigh | North Carolina | 2.80% |
| 11 | Cape Coral | Florida | 2.72% |
| 12 | Provo-Orem | Utah | 2.66% |
| 13 | Santa Clarita | California | 2.41% |
| 14 | Austin | Texas | 2.39% |
| 15 | Lancaster-Palmdale | California | 2.14% |
| 16 | Las Vegas | Nevada | 2.11% |
| 17 | Lafayette | Louisiana | 2.06% |
| 18 | Bonita Springs-Naples | Florida | 1.99% |
| 19 | McAllen | Texas | 1.96% |
| 20 | Port St. Lucie | Florida | 1.94% |
Coming in as America’s fastest growing city is The Woodlands, Texas. This Houston-adjacent community is projecting an extreme population increase, reflecting the rapid population growth of the state of Texas.
According to 2020 Census data, Texas is America’s third fastest growing state, with a population of over 29 million—that’s more than the entire population of Australia.
The second fastest growing city is Temecula-Murrieta, California, which lies in the center of the triangle formed by Los Angeles, San Diego, and Palm Springs. Despite the fact that five of the 20 fastest growing cities are in California, the Golden State’s overall population has been somewhat stagnant in recent years. In 2018, California’s population growth rate dipped to 0.47%—its slowest growth rate on record.
The Main Factors that Impact City Growth
What contributes to a city’s population growth? According to academic research conducted by Gilles Duranton and Diego Puga, there are several key drivers that impact urban growth:
- Transportation and housing supply: Restrictions on housing supply, along with poor transportation options or limited roads, tend to hinder urban growth.
- Amenities: This includes “natural” amenities, such as the weather—one of the most reliable predictors of city growth. Warmer temperatures in January and cooler temperatures in July are both strongly correlated with urban growth.
- Agglomeration effects: An educated city is more likely to be an entrepreneurial city, which attracts new firms and helps foster growth for existing firms. As a result, its population naturally increases.
Duranton and Puga stress that municipal and city governments likely play a role in a city’s population growth too—however, more research on the topic is needed to confirm their hypothesis.
» Like this? Then check out the fastest-growing cities worldwide.
Where does this data come from?
Source: UN World Urbanization Prospects 2018
Details:: The growth rate is measured by an average annual rate of change of urban agglomeration, with 300,00 or more in 2018 (%).


Datastream
Can You Calculate Your Daily Carbon Footprint?
Discover how the average person’s carbon footprint impacts the environment and learn how carbon credits can offset your carbon footprint.


The Briefing
- A person’s carbon footprint is substantial, with activities such as food consumption creating as much as 4,500 g of CO₂ emissions daily.
- By purchasing carbon credits from Carbon Streaming Corporation, you can offset your own emissions and fund positive climate action.
Your Everyday Carbon Footprint
While many large businesses and countries have committed to net-zero goals, it is essential to acknowledge that your everyday activities also contribute to global emissions.
In this graphic, sponsored by Carbon Streaming Corporation, we will explore how the choices we make and the products we use have a profound impact on our carbon footprint.
Carbon Emissions by Activity
Here are some of the daily activities and products of the average person and their carbon footprint, according to Clever Carbon.
| Household Activities & Products | CO2 Emissions (g) |
|---|---|
| 💡 Standard Light Bulb (100 watts, four hours) | 172 g |
| 📱 Mobile Phone Use (195 minutes per day)* | 189 g |
| 👕 Washing Machine (0.63 kWh) | 275 g |
| 🔥 Electric Oven (1.56 kWh) | 675 g |
| ♨️ Tumble Dryer (2.5 kWh) | 1,000 g |
| 🧻 Toilet Roll (2 ply) | 1,300 g |
| 🚿 Hot Shower (10 mins) | 2,000 g |
| 🚙 Daily Commute (one hour, by car) | 3,360 g |
| 🍽️ Average Daily Food Consumption (three meals of 600 calories) | 4,500 g |
| *Phone use based on yearly use of 69kg per the source, Reboxed | |
Your choice of transportation plays a crucial role in determining your carbon footprint. For instance, a 15 km daily commute to work on public transport generates an average of 1,464 g of CO₂ emissions. Compared to 3,360 g—twice the volume for a journey the same length by car.
By opting for more sustainable modes of transport, such as cycling, walking, or public transportation, you can significantly reduce your carbon footprint.
Addressing Your Carbon Footprint
One way to compensate for your emissions is by purchasing high-quality carbon credits.
Carbon credits are used to help fund projects that avoid, reduce or remove CO₂ emissions. This includes nature-based solutions such as reforestation and improved forest management, or technology-based solutions such as the production of biochar and carbon capture and storage (CCS).
While carbon credits offer a potential solution for individuals to help reduce global emissions, public awareness remains a significant challenge. A BCG-Patch survey revealed that only 34% of U.S. consumers are familiar with carbon credits, and only 3% have purchased them in the past.
About Carbon Streaming
By financing the creation or expansion of carbon projects, Carbon Streaming Corporation secures the rights to future carbon credits generated by these sustainable projects. You can then purchase these carbon credits to help fund climate solutions around the world and compensate for your own emissions.
Ready to get involved?
>> Learn more about purchasing carbon credits at Carbon Streaming

-

 Markets1 week ago
U.S. Debt Interest Payments Reach $1 Trillion
-

 Markets2 weeks ago
Ranked: The Most Valuable Housing Markets in America
-

 Money2 weeks ago
Which States Have the Highest Minimum Wage in America?
-

 AI2 weeks ago
Ranked: Semiconductor Companies by Industry Revenue Share
-

 Markets2 weeks ago
Ranked: The World’s Top Flight Routes, by Revenue
-

 Countries2 weeks ago
Population Projections: The World’s 6 Largest Countries in 2075
-

 Markets2 weeks ago
The Top 10 States by Real GDP Growth in 2023
-

 Money2 weeks ago
The Smallest Gender Wage Gaps in OECD Countries