Investor Education
Fact Check: The Truth Behind Five ESG Myths
Fact Check: The Truth Behind 5 ESG Myths
In 2021, investors continue to embrace environmental, social, and governance (ESG) investments at record levels.
In the first quarter of 2021, global ESG fund inflows outpaced the last four consecutive quarters, reaching $2 trillion. But while ESG gains rapid momentum, the CFA Institute shows that 33% of professional investors surveyed feel they have insufficient knowledge for considering ESG issues.
To help investors understand this growing trend, this infographic from MSCI helps provide a fact check on five common ESG myths.
1. “ESG Comes at the Expense of Investment Performance”
Fact Check: Not necessarily
Worldwide, ESG-focused companies have not only seen higher returns, but stronger earnings growth and dividends.
| Returns by ESG Ratings | Earnings Growth* | Active Return** | Dividends and Buybacks |
|---|---|---|---|
| Top tier | 2.89% | 1.31% | 0.28% |
| Middle tier | 1.35% | 0.12% | -0.02% |
| Bottom tier | -9.22% | -1.25% | -0.05% |
Source: MSCI ESG Research LLC (Dec, 2020)
*Contribution of earnings growth and dividends/buybacks to active return
**Active return is the additional gain or loss compared to it respective benchmark
In fact, a separate study from the CFA Institute shows that 35% of investment professionals invest in ESG to improve their financial returns.
2. “Investors Talk About ESG But Don’t Invest In It”
Fact Check: False
Global ESG assets under management (AUM) in ETFs have grown from $6 billion in 2015 to $150 billion in 2020. In just five years, ESG AUM have accelerated 25 times.
Today, money managers are focusing on the following top five issues:
| Top ESG Issues | Assets Affected | Growth in Assets Affected (2018-2020) |
|---|---|---|
| Climate change / carbon emissions | $4.18T | 39% |
| Anti-corruption | $2.44T | 10% |
| Board issues | $2.39T | 66% |
| Sustainable natural resources / agriculture | $2.38T | 81% |
| Executive pay | $2.22T | 122% |
Source: US SIF Foundation (Nov, 2020)
Meanwhile, over 1,500 shareholder resolutions focused on ESG-related matters were filed between 2018-2020. Not only are investors turning to ESG assets, but they are placing higher demands on corporate responsibility.
3. “ESG Investment Strategies Eliminate Entire Sectors”
Fact Check: Not necessarily
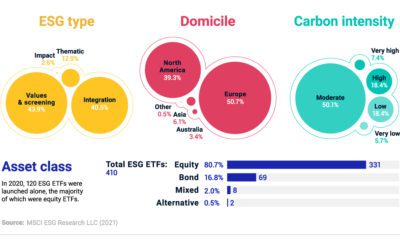
First, not all ESG investment approaches are exclusionary.
For instance, in North America roughly 51% of ESG ETFs used an ESG integration approach as of Dec. 31, 2020. In an ESG integration approach, ESG risks and opportunities are analyzed with the goal to support long-term returns.
By comparison, values and screens approaches, which accounted for over 22% of ESG ETFs in North America may screen out specific business activities, such as alcohol or tobacco, or sectors such as oil & gas.
| Percentage of ESG Type | Integration | Values & Screens | Thematic | Impact |
|---|---|---|---|---|
| North America | 50.9% | 22.5% | 20.7% | 5.9% |
| Asia | 57.8% | 34.6% | 3.8% | 3.8% |
| Europe | 30.8% | 60.6% | 8.6% | 0.0% |
| Australia | 28.6% | 71.4% | 0.0% | 0.0% |
Source: Refinitiv/Lipper and MSCI ESG Research LLC as of Dec 31, 2020 (MSCI Feb, 2021)
Second, companies are assessed on a sector-specific basis where ESG leaders and laggards are identified within each sector in comparison to peers. In other words, ESG doesn’t mean eliminating exposure to entire sectors. Instead, investors can choose from a range of companies based on their ESG ratings quality.
4. “ESG Investing Is Only For Millennials”
Fact Check: False
Although ESG is popular among millennials, ESG investing is being driven by the entire investor population. In 2019, one study finds that 85% of the general population expressed interest in ESG investing.
| Interest in Sustainable Investing | General Population | Millennials |
|---|---|---|
| 2019 | 85% | 95% |
| 2015 | 71% | 84% |
Source: US SIF Foundation (Nov, 2020)
Sustainable investing goes far beyond millennials—ESG disclosures are quickly becoming requirements for key industry participants, such as institutional investors and listed companies.
5. “ESG Investing is Here to Stay”
Fact Check: True
Climbing 28% in 2020 alone, over 3,000 signatories have committed to the UN Principles of Responsible Investment. As of the first quarter of 2021, 313 global organizations and 33 asset owners have been newly added.
| Growth of UN PRI | Number of Signatories* | AUM Represented |
|---|---|---|
| 2020 | 3,038 | $103.4T |
| 2019 | 2,370 | $86.3T |
Source: UN PRI
*As of Mar, 2020
Central to ESG’s growth is the availability of ESG investments. ESG investing has become more widely accessible—which wasn’t always the case. Over the last decade, the global number of ESG ETFs has grown from 46 to 497.
Why the Facts Matter
As ESG investments continue to play an even greater role in investor portfolios, it’s important to focus on data rather than prevailing ESG myths that are not backed by fact.
Given the recent momentum in investment returns and ESG adoption, data-driven evidence empowers investors to build more sustainable portfolios that better align with their investment objectives.


Investor Education
How MSCI Builds Thematic Indexes: A Step-by-Step Guide
From developing an index objective to choosing relevant stocks, this graphic breaks down how MSCI builds thematic indexes using examples.


How MSCI Builds Thematic Indexes: A Step-by-Step Guide
Have you ever wondered how MSCI builds its thematic indexes?
To capture long-term, structural trends that could drive business performance in the future, the company follows a systematic approach. This graphic from MSCI breaks down each step in the process used to create its thematic indexes.
Step 1: Develop an Index Objective
MSCI first builds a broad statement of what the theme aims to capture based on extensive research and insights from industry experts.
Steps 2 and 3: List Sub-Themes, Generate Keyword List
Together with experts, MSCI creates a list of sub-themes or “seedwords” to identify aligned business activities.
The team then assembles a collection of suitable documents describing the theme. Natural language processing efficiently analyzes word frequency and relevance to generate a more detailed set of keywords contextually similar to the seedwords.
Step 4: Find Relevant Companies
By analyzing financial reports, MSCI picks companies relevant to the theme using two methods:
- Direct approach: Revenue from a company’s business segment is considered 100% relevant if the segment name matches a theme keyword. Standard Industrial Classification (SIC) codes from these directly-matched segments make up the eligible SIC code list used in the indirect approach.
- Indirect approach: If a segment name doesn’t match theme keywords, MSCI will:
- Analyze the density of theme keywords mentioned in the company’s description. A minimum of two unique keywords is required.
- The keyword density determines a “discount factor” to reflect lower certainty in theme alignment.
- Revenue from business segments with an eligible SIC code, regardless of how they are named, is scaled down by the discount factor.
The total percentage of revenue applicable to the theme from both approaches determines a company’s relevance score.
Step 5: Select the Stocks
Finally, MSCI narrows down the stocks that will be included:
- Global parent universe: The ACWI Investable Market Index (IMI) is the starting point for standard thematic indexes.
- Relevance filter: The universe is filtered for companies with a relevance score of at least 25%.
- False positive control: Eligible companies that are mapped to un-related GICS sub-industries are removed.
Companies with higher relevance scores and market caps have a higher weighting in the index, with the maximum weighting for any one issuer capped at 5%. The final selected stocks span various sectors.
MSCI Thematic Indexes: Regularly Updated and Rules-Based
Once an index is built, it is reviewed semi-annually and updated based on:
- Changes to the parent index
- Changes at individual companies
- Theme developments based on expert input
Theme keywords are reviewed yearly in May. Overall, MSCI’s thematic index construction process is objective, scalable, and flexible. The process can be customized based on the theme(s) you want to capture.
Learn more about MSCI’s thematic indexes.

-

 Investor Education6 months ago
The 20 Most Common Investing Mistakes, in One Chart
Here are the most common investing mistakes to avoid, from emotionally-driven investing to paying too much in fees.
-

 Stocks10 months ago
Visualizing BlackRock’s Top Equity Holdings
BlackRock is the world’s largest asset manager, with over $9 trillion in holdings. Here are the company’s top equity holdings.
-

 Investor Education11 months ago
10-Year Annualized Forecasts for Major Asset Classes
This infographic visualizes 10-year annualized forecasts for both equities and fixed income using data from Vanguard.
-

 Investor Education1 year ago
Visualizing 90 Years of Stock and Bond Portfolio Performance
How have investment returns for different portfolio allocations of stocks and bonds compared over the last 90 years?
-

 Debt2 years ago
Countries with the Highest Default Risk in 2022
In this infographic, we examine new data that ranks the top 25 countries by their default risk.
-

 Markets2 years ago
The Best Months for Stock Market Gains
This infographic analyzes over 30 years of stock market performance to identify the best and worst months for gains.


-

 Mining1 week ago
Gold vs. S&P 500: Which Has Grown More Over Five Years?
-

 Markets2 weeks ago
Ranked: The Most Valuable Housing Markets in America
-

 Money2 weeks ago
Which States Have the Highest Minimum Wage in America?
-

 AI2 weeks ago
Ranked: Semiconductor Companies by Industry Revenue Share
-

 Markets2 weeks ago
Ranked: The World’s Top Flight Routes, by Revenue
-

 Countries2 weeks ago
Population Projections: The World’s 6 Largest Countries in 2075
-

 Markets2 weeks ago
The Top 10 States by Real GDP Growth in 2023
-

 Demographics2 weeks ago
The Smallest Gender Wage Gaps in OECD Countries