Markets
News Explainer: The Economic Crisis in Sri Lanka
Explained: the Economic Crisis in Sri Lanka
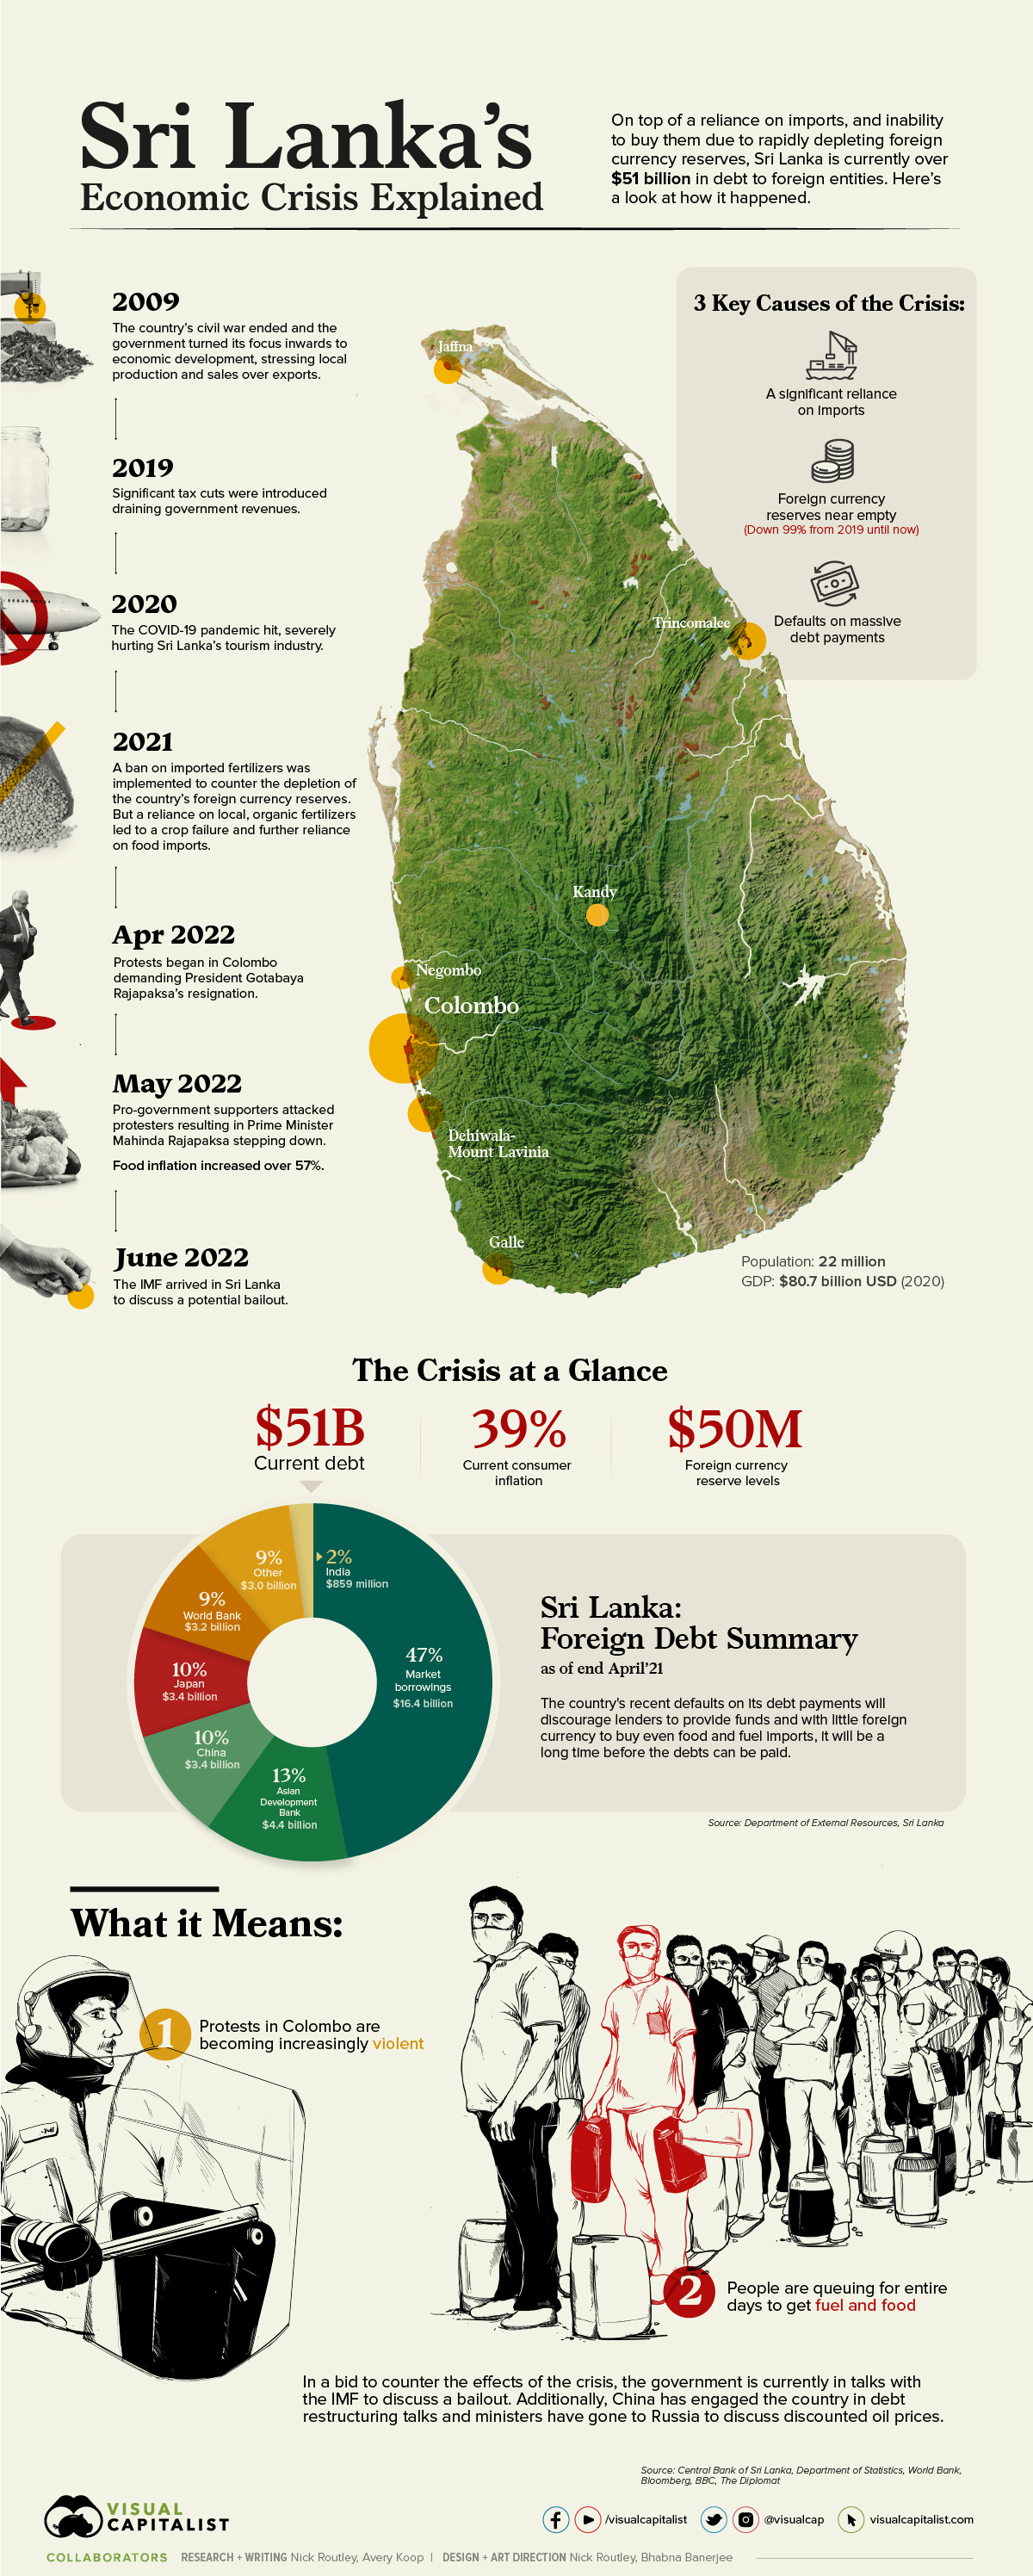
Sri Lanka is currently in an economic and political crisis of mass proportions, recently culminating in a default on its debt payments. The country is also nearly at empty on their foreign currency reserves, decreasing the ability to purchase imports and driving up domestic prices for goods.
There are several reasons for this crisis and the economic turmoil has sparked mass protests and violence across the country. This visual breaks down some of the elements that led to Sri Lanka’s current situation.
A Timeline of Events
The ongoing problems in Sri Lanka have bubbled up after years of economic mismanagement. Here’s a brief timeline looking at just some of the recent factors.
2009
In 2009, a decades-long civil war in the country ended and the government’s focus turned inward towards domestic production. However, a stress on local production and sales, instead of exports, increased the reliance on foreign goods.
2019
Unprompted cuts were introduced on income tax in 2019, leading to significant losses in government revenue, draining an already cash-strapped country.
2020
The COVID-19 pandemic hit the world causing border closures globally and stifling one of Sri Lanka’s most lucrative industries. Prior to the pandemic, in 2018, tourism contributed nearly 5% of the country’s GDP and generated over 388,000 jobs. In 2020, tourism’s share of GDP had dropped to 0.8%, with over 40,000 jobs lost to that point.
2021
Recently, the Sri Lankan government introduced a ban on foreign-made chemical fertilizers. The ban was meant to counter the depletion of the country’s foreign currency reserves.
However, with only local, organic fertilizers available to farmers, a massive crop failure occurred and Sri Lankans were subsequently forced to rely even more heavily on imports, further depleting reserves.
April 2022
In early April this year, massive protests calling for President Gotabaya Rajapaksa’s resignation, sparked in Sri Lanka’s capital city, Colombo.
May 2022
In May, pro-government supporters brutally attacked protesters. Subsequently, Prime Minister Mahinda Rajapaksa, brother of President Rajapaksa, stepped down and was replaced with former PM, Ranil Wickremesinghe.
June 2022
Recently, the government approved a four-day work week to allow citizens an extra day to grow food, as prices continue to shoot up. Food inflation increased over 57% in May.
Additionally, the increasing prices on grain caused by the war in Ukraine and rising fuel prices globally have played into an already dire situation in Sri Lanka.
The Key Information
“Our economy has completely collapsed.”
Prime minister Ranil Wickremesinghe to Parliament last week.
One of the main causes of the economic crisis in Sri Lanka is the reliance on imports and the amount spent on them. Let’s take a look at the numbers:
- 2021 total imports = $20.6 billion USD
- 2022 total imports (to March) = $5.7 billion USD
In contrast, the most recent reported foreign currency reserve levels in the country were at an abysmal $50 million, having plummeted an astounding 99%, from $7.6 billion in 2019.
Some of the top imports in 2021, according to the country’s central bank were:
- Refined petroleum = $2.8 billion
- Textiles = $3.1 billion
- Chemical products = $1.1 billion
- Food & beverage = $1.7 billion
Of course, without the cash to purchase these goods from abroad, Sri Lankans face an increasingly drastic situation.
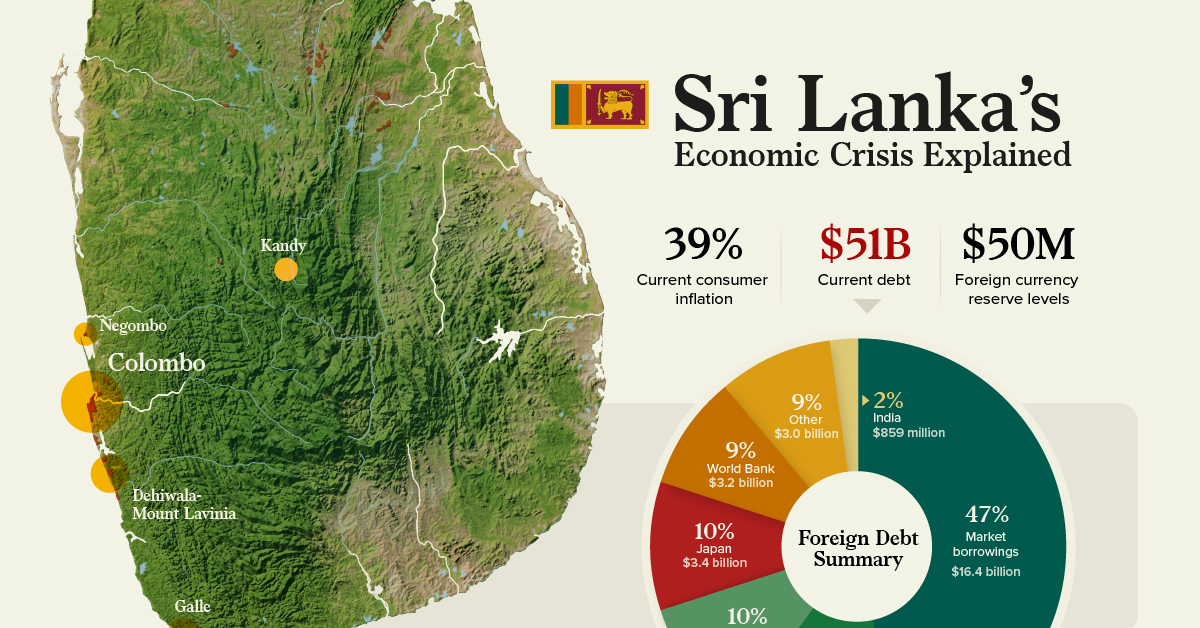
Additionally, the debt Sri Lanka has incurred is huge, further hampering their ability to boost their reserves. Recently, they defaulted on a $78 million loan from international creditors, and in total, they’ve borrowed $50.7 billion.
The largest source of their debt is by far due to market borrowings, followed closely by loans taken from the Asian Development Bank, China, and Japan, among others.
What it Means
Sri Lanka is home to more than 22 million people who are rapidly losing the ability to purchase everyday goods. Consumer inflation reached 39% at the end of May.
Due to power outages meant to save energy and fuel, schools are currently shuttered and children have nowhere to go during the day. Protesters calling for the president’s resignation have been camped in the capital for months, facing tear gas from police and backlash from president Rajapaksa’s supporters, but many have also responded violently to pushback.
India and China have agreed to send help to the country and the the International Monetary Fund recently arrived in the country to discuss a bailout. Additionally, the government has sent ministers to Russia to discuss a deal for discounted oil imports.
A Foreshadowing for Low Income Countries
Governments need foreign currency in order to purchase goods from abroad. Without the ability to purchase or borrow foreign currency, the Sri Lankan government cannot buy desperately needed imports, including food staples and fuel, causing domestic prices to rise.
Furthermore, defaults on loan payments discourage foreign direct investment and devalue the national currency, making future borrowing more difficult.
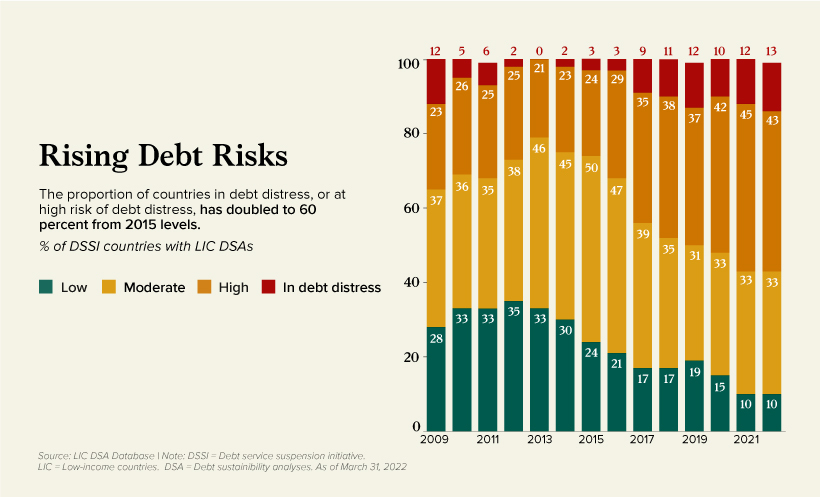
What’s happening in Sri Lanka may be an ominous preview of what’s to come in other low and middle-income countries, as the risk of debt distress continues to rise globally.
The Debt Service Suspension Initiative (DSSI) was implemented by G20 countries, suspending nearly $13 billion in debt from the start of the pandemic until late 2021.
Some DSSI and LIC countries facing a high risk of debt distress include Zambia, Ethiopia, and Tajikistan, to name a few.
Going forward, Sri Lanka’s next steps in managing this situation will either serve as a useful example for other countries at risk or a warning worth heeding.
Ongoing Updates
Since this article was published the situation has changed significantly in Sri Lanka. Protesters have received their original demand calling for president Rajapaksa to step down — both he and prime minister Wickremesinghe have agreed to resign. This comes after protesters stormed the president’s palace causing him to flee the country.
Note: The debt breakdown in the main visualization represents total outstanding external debt owed to foreign creditors rather total debt.


Markets
The European Stock Market: Attractive Valuations Offer Opportunities
On average, the European stock market has valuations that are nearly 50% lower than U.S. valuations. But how can you access the market?


European Stock Market: Attractive Valuations Offer Opportunities
Europe is known for some established brands, from L’Oréal to Louis Vuitton. However, the European stock market offers additional opportunities that may be lesser known.
The above infographic, sponsored by STOXX, outlines why investors may want to consider European stocks.
Attractive Valuations
Compared to most North American and Asian markets, European stocks offer lower or comparable valuations.
| Index | Price-to-Earnings Ratio | Price-to-Book Ratio |
|---|---|---|
| EURO STOXX 50 | 14.9 | 2.2 |
| STOXX Europe 600 | 14.4 | 2 |
| U.S. | 25.9 | 4.7 |
| Canada | 16.1 | 1.8 |
| Japan | 15.4 | 1.6 |
| Asia Pacific ex. China | 17.1 | 1.8 |
Data as of February 29, 2024. See graphic for full index names. Ratios based on trailing 12 month financials. The price to earnings ratio excludes companies with negative earnings.
On average, European valuations are nearly 50% lower than U.S. valuations, potentially offering an affordable entry point for investors.
Research also shows that lower price ratios have historically led to higher long-term returns.
Market Movements Not Closely Connected
Over the last decade, the European stock market had low-to-moderate correlation with North American and Asian equities.
The below chart shows correlations from February 2014 to February 2024. A value closer to zero indicates low correlation, while a value of one would indicate that two regions are moving in perfect unison.
| EURO STOXX 50 | STOXX EUROPE 600 | U.S. | Canada | Japan | Asia Pacific ex. China |
|
|---|---|---|---|---|---|---|
| EURO STOXX 50 | 1.00 | 0.97 | 0.55 | 0.67 | 0.24 | 0.43 |
| STOXX EUROPE 600 | 1.00 | 0.56 | 0.71 | 0.28 | 0.48 | |
| U.S. | 1.00 | 0.73 | 0.12 | 0.25 | ||
| Canada | 1.00 | 0.22 | 0.40 | |||
| Japan | 1.00 | 0.88 | ||||
| Asia Pacific ex. China | 1.00 |
Data is based on daily USD returns.
European equities had relatively independent market movements from North American and Asian markets. One contributing factor could be the differing sector weights in each market. For instance, technology makes up a quarter of the U.S. market, but health care and industrials dominate the broader European market.
Ultimately, European equities can enhance portfolio diversification and have the potential to mitigate risk for investors.
Tracking the Market
For investors interested in European equities, STOXX offers a variety of flagship indices:
| Index | Description | Market Cap |
|---|---|---|
| STOXX Europe 600 | Pan-regional, broad market | €10.5T |
| STOXX Developed Europe | Pan-regional, broad-market | €9.9T |
| STOXX Europe 600 ESG-X | Pan-regional, broad market, sustainability focus | €9.7T |
| STOXX Europe 50 | Pan-regional, blue-chip | €5.1T |
| EURO STOXX 50 | Eurozone, blue-chip | €3.5T |
Data is as of February 29, 2024. Market cap is free float, which represents the shares that are readily available for public trading on stock exchanges.
The EURO STOXX 50 tracks the Eurozone’s biggest and most traded companies. It also underlies one of the world’s largest ranges of ETFs and mutual funds. As of November 2023, there were €27.3 billion in ETFs and €23.5B in mutual fund assets under management tracking the index.
“For the past 25 years, the EURO STOXX 50 has served as an accurate, reliable and tradable representation of the Eurozone equity market.”
— Axel Lomholt, General Manager at STOXX
Partnering with STOXX to Track the European Stock Market
Are you interested in European equities? STOXX can be a valuable partner:
- Comprehensive, liquid and investable ecosystem
- European heritage, global reach
- Highly sophisticated customization capabilities
- Open architecture approach to using data
- Close partnerships with clients
- Part of ISS STOXX and Deutsche Börse Group
With a full suite of indices, STOXX can help you benchmark against the European stock market.
Learn how STOXX’s European indices offer liquid and effective market access.

-

 Economy1 day ago
Economic Growth Forecasts for G7 and BRICS Countries in 2024
The IMF has released its economic growth forecasts for 2024. How do the G7 and BRICS countries compare?
-

 Markets1 week ago
U.S. Debt Interest Payments Reach $1 Trillion
U.S. debt interest payments have surged past the $1 trillion dollar mark, amid high interest rates and an ever-expanding debt burden.
-

 United States1 week ago
Ranked: The Largest U.S. Corporations by Number of Employees
We visualized the top U.S. companies by employees, revealing the massive scale of retailers like Walmart, Target, and Home Depot.
-

 Markets2 weeks ago
The Top 10 States by Real GDP Growth in 2023
This graphic shows the states with the highest real GDP growth rate in 2023, largely propelled by the oil and gas boom.
-

 Markets2 weeks ago
Ranked: The World’s Top Flight Routes, by Revenue
In this graphic, we show the highest earning flight routes globally as air travel continued to rebound in 2023.
-

 Markets2 weeks ago
Ranked: The Most Valuable Housing Markets in America
The U.S. residential real estate market is worth a staggering $47.5 trillion. Here are the most valuable housing markets in the country.


-

 Mining1 week ago
Gold vs. S&P 500: Which Has Grown More Over Five Years?
-
Markets2 weeks ago
Ranked: The Most Valuable Housing Markets in America
-

 Money2 weeks ago
Which States Have the Highest Minimum Wage in America?
-

 AI2 weeks ago
Ranked: Semiconductor Companies by Industry Revenue Share
-
Markets2 weeks ago
Ranked: The World’s Top Flight Routes, by Revenue
-

 Demographics2 weeks ago
Population Projections: The World’s 6 Largest Countries in 2075
-
Markets2 weeks ago
The Top 10 States by Real GDP Growth in 2023
-

 Demographics2 weeks ago
The Smallest Gender Wage Gaps in OECD Countries