Misc
Every Single Cognitive Bias in One Infographic
View a high resolution version of this graphic
Every Single Cognitive Bias in One Infographic
View the high resolution version of today’s graphic by clicking here.
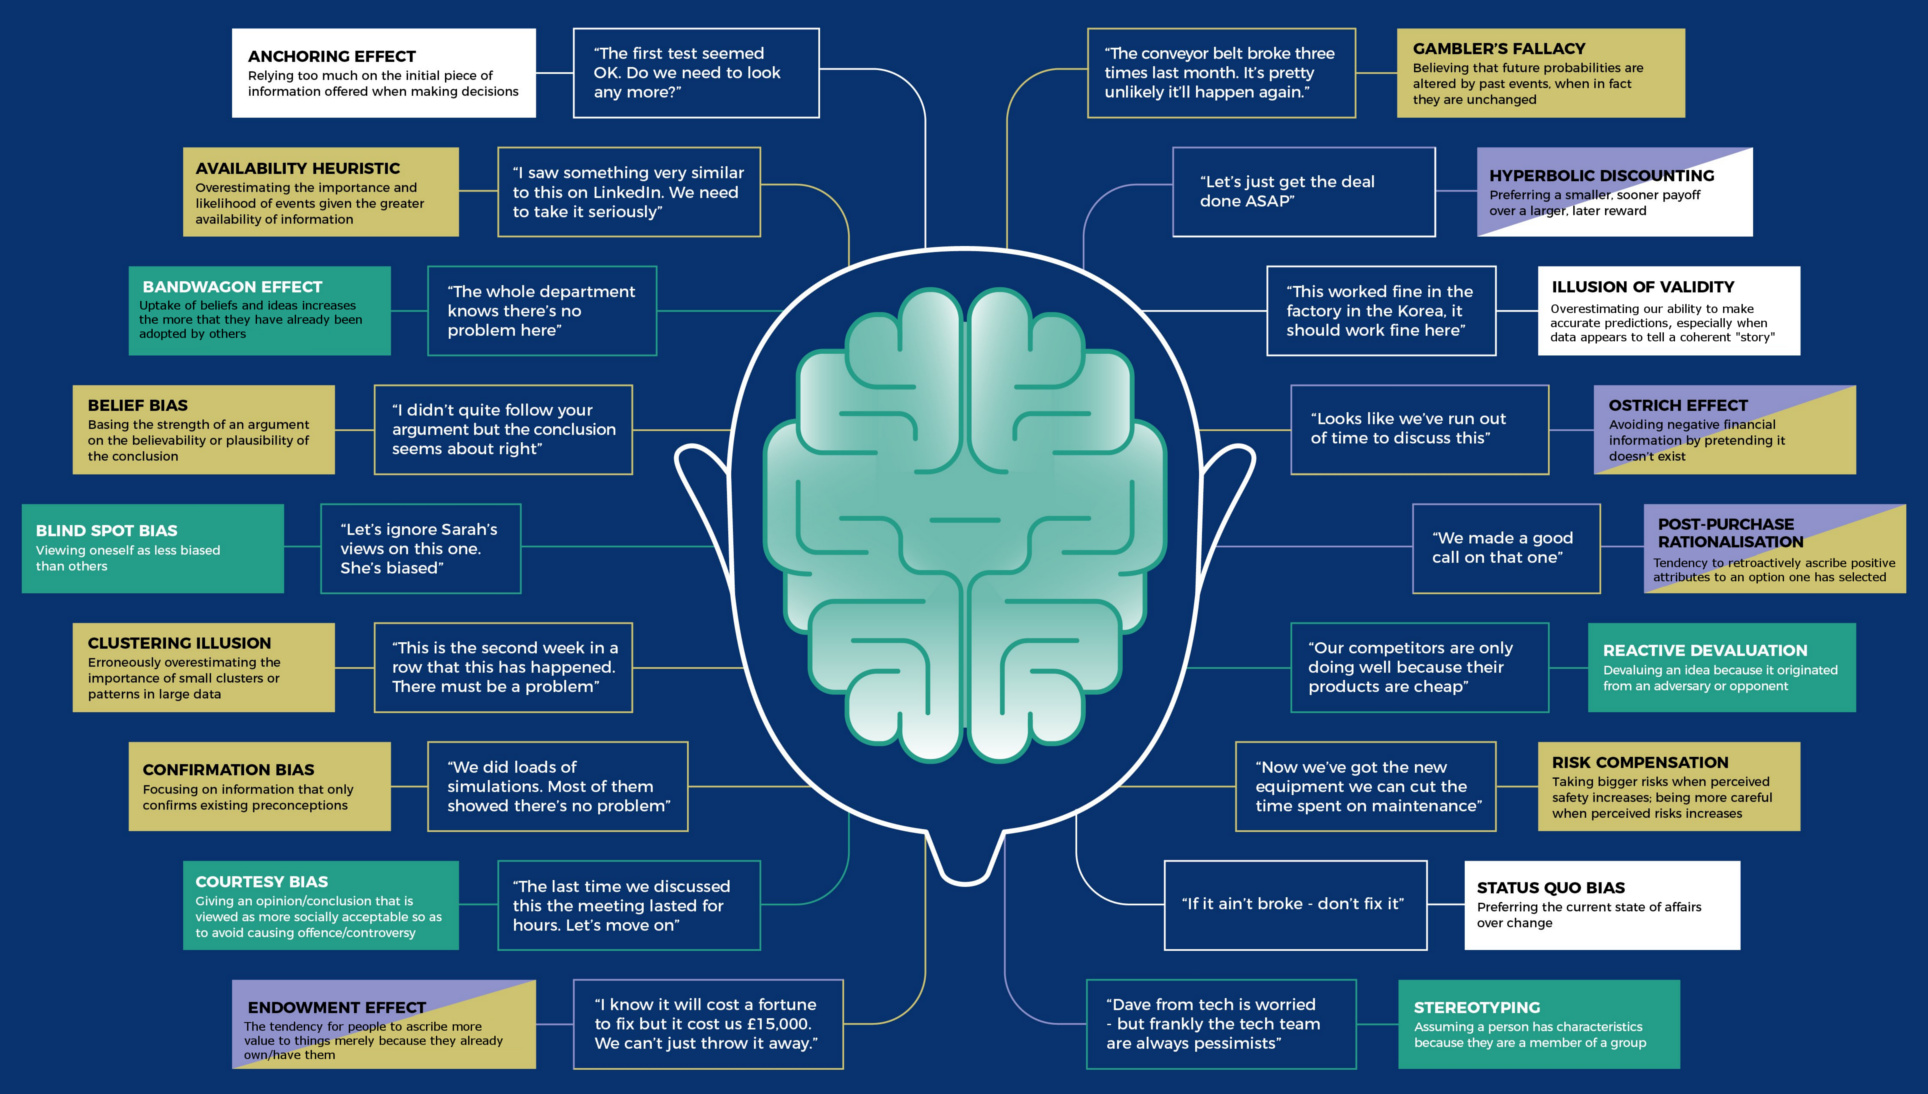
The human brain is capable of incredible things, but it’s also extremely flawed at times.
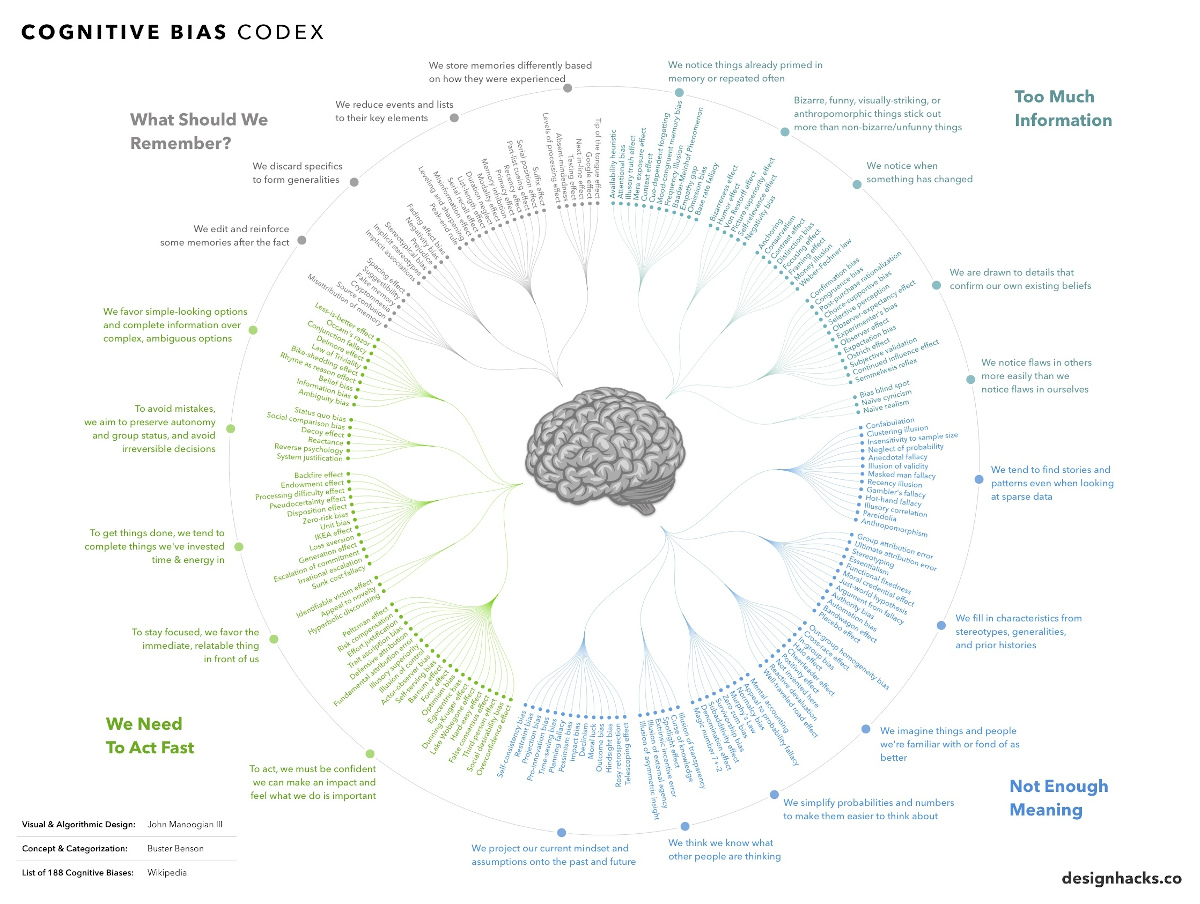
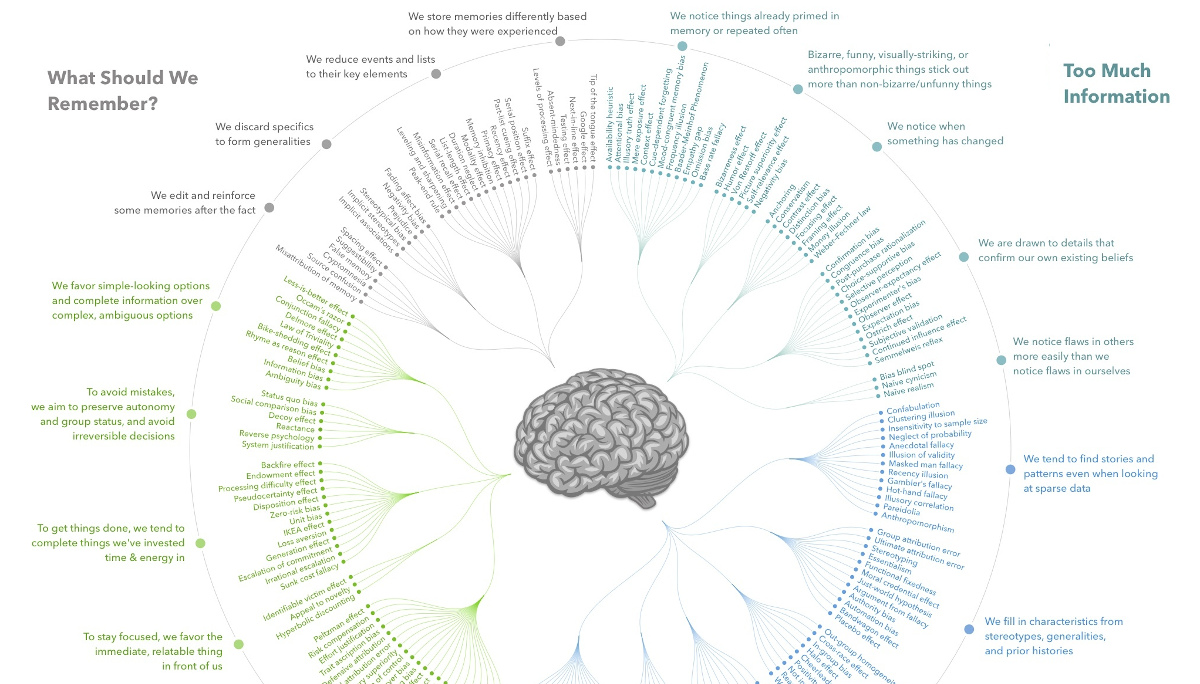
Science has shown that we tend to make all sorts of mental mistakes, called “cognitive biases”, that can affect both our thinking and actions. These biases can lead to us extrapolating information from the wrong sources, seeking to confirm existing beliefs, or failing to remember events the way they actually happened!
To be sure, this is all part of being human—but such cognitive biases can also have a profound effect on our endeavors, investments, and life in general.
For this reason, today’s infographic from DesignHacks.co is particularly handy. It shows and groups each of the 188 known confirmation biases in existence.
What is a Cognitive Bias?
Humans have a tendency to think in particular ways that can lead to systematic deviations from making rational judgments.
These tendencies usually arise from:
- Information processing shortcuts
- The limited processing ability of the brain
- Emotional and moral motivations
- Distortions in storing and retrieving memories
- Social influence
Cognitive biases have been studied for decades by academics in the fields of cognitive science, social psychology, and behavioral economics, but they are especially relevant in today’s information-packed world. They influence the way we think and act, and such irrational mental shortcuts can lead to all kinds of problems in entrepreneurship, investing, or management.
Cognitive Bias Examples
Here are five examples of how these types of biases can affect people in the business world:
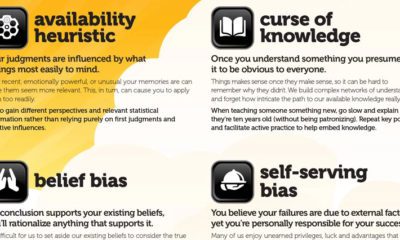
1. Familiarity Bias: An investor puts her money in “what she knows”, rather than seeking the obvious benefits from portfolio diversification. Just because a certain type of industry or security is familiar doesn’t make it the logical selection.
2. Self-Attribution Bias: An entrepreneur overly attributes his company’s success to himself, rather than other factors (team, luck, industry trends). When things go bad, he blames these external factors for derailing his progress.
3. Anchoring Bias: An employee in a salary negotiation is too dependent on the first number mentioned in the negotiations, rather than rationally examining a range of options.
4. Survivorship Bias: Entrepreneurship looks easy, because there are so many successful entrepreneurs out there. However, this is a cognitive bias: the successful entrepreneurs are the ones still around, while the millions who failed went and did other things.
5. Gambler’s Fallacy: A venture capitalist sees a portfolio company rise and rise in value after its IPO, far behind what he initially thought possible. Instead of holding on to a winner and rationally evaluating the possibility that appreciation could still continue, he dumps the stock to lock in the existing gains.
This post was first published in 2017. We have since updated it, adding in new content for 2021.


Misc
How Hard Is It to Get Into an Ivy League School?
We detail the admission rates and average annual cost for Ivy League schools, as well as the median SAT scores required to be accepted.


How Hard Is It to Get Into an Ivy League School?
This was originally posted on our Voronoi app. Download the app for free on iOS or Android and discover incredible data-driven charts from a variety of trusted sources.
Ivy League institutions are renowned worldwide for their academic excellence and long-standing traditions. But how hard is it to get into one of the top universities in the U.S.?
In this graphic, we detail the admission rates and average annual cost for Ivy League schools, as well as the median SAT scores required to be accepted. The data comes from the National Center for Education Statistics and was compiled by 24/7 Wall St.
Note that “average annual cost” represents the net price a student pays after subtracting the average value of grants and/or scholarships received.
Harvard is the Most Selective
The SAT is a standardized test commonly used for college admissions in the United States. It’s taken by high school juniors and seniors to assess their readiness for college-level academic work.
When comparing SAT scores, Harvard and Dartmouth are among the most challenging universities to gain admission to. The median SAT scores for their students are 760 for reading and writing and 790 for math. Still, Harvard has half the admission rate (3.2%) compared to Dartmouth (6.4%).
| School | Admission rate (%) | SAT Score: Reading & Writing | SAT Score: Math | Avg Annual Cost* |
|---|---|---|---|---|
| Harvard University | 3.2 | 760 | 790 | $13,259 |
| Columbia University | 3.9 | 750 | 780 | $12,836 |
| Yale University | 4.6 | 760 | 780 | $16,341 |
| Brown University | 5.1 | 760 | 780 | $26,308 |
| Princeton University | 5.7 | 760 | 780 | $11,080 |
| Dartmouth College | 6.4 | 760 | 790 | $33,023 |
| University of Pennsylvania | 6.5 | 750 | 790 | $14,851 |
| Cornell University | 7.5 | 750 | 780 | $29,011 |
*Costs after receiving federal financial aid.
Additionally, Dartmouth has the highest average annual cost at $33,000. Princeton has the lowest at $11,100.
While student debt has surged in the United States in recent years, hitting $1.73 trillion in 2023, the worth of obtaining a degree from any of the schools listed surpasses mere academics. This is evidenced by the substantial incomes earned by former students.
Harvard grads, for example, have the highest average starting salary in the country, at $91,700.

-

 Maps2 weeks ago
Mapped: Average Wages Across Europe
-

 Money1 week ago
Which States Have the Highest Minimum Wage in America?
-

 Real Estate1 week ago
Ranked: The Most Valuable Housing Markets in America
-

 Markets1 week ago
Charted: Big Four Market Share by S&P 500 Audits
-

 AI1 week ago
The Stock Performance of U.S. Chipmakers So Far in 2024
-

 Automotive1 week ago
Almost Every EV Stock is Down After Q1 2024
-

 Money2 weeks ago
Where Does One U.S. Tax Dollar Go?
-

 Green2 weeks ago
Ranked: Top Countries by Total Forest Loss Since 2001