Markets
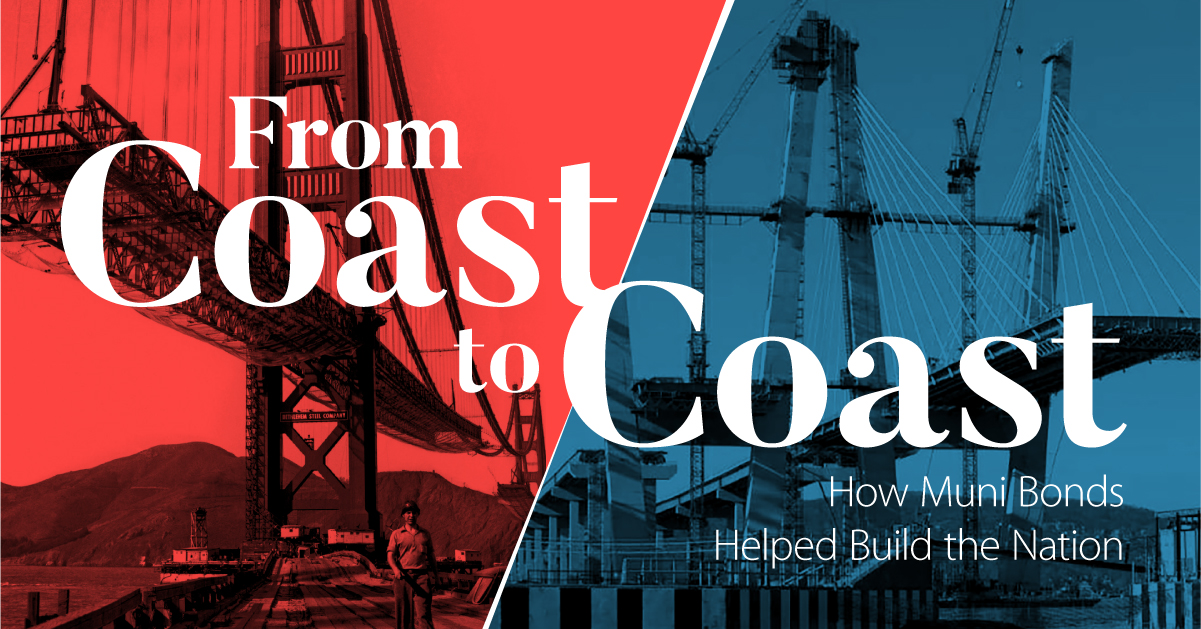
From Coast to Coast: How U.S. Muni Bonds Help Build the Nation

Over 200 Years of U.S. Municipal Bond History
Our modern society shares few characteristics with the 1800s. In the last two centuries, styles have changed, laws have evolved, and cities look entirely different. However, one thing that has prevailed is the way state and local governments finance public projects.
Far from a new invention, municipal bonds have been shaping U.S. communities for more than 200 years. In today’s infographic from New York Life Investments, we take a look back at their long history.
Early Beginnings – 1800s
1812: First Official Issue
New York City issues a general obligation bond for a canal.
1817-1825: Facilitating Economic Growth
A few years later, 42 separate bond issues help fund the successful Erie Canal project.
1843: Growing Popularity
Municipal debt sits at about $25 million. Over the next two decades, this total increases exponentially to fund urban improvement and free public education.
Circa 1865: Railroad Expansion
For a few years after the American Civil War, a great deal of debt is issued to build railroads.
1873: The Panic of 1873
Excessive investment in railroads, real estate, and nonessential services leads to the downfall of the large bank Jay Cooke and Co., smaller firms, and the stock market. Many state and local governments default, temporarily halting municipal financing.
The 20th Century
1913: Exception Granted
U.S. Congress introduces a permanent federal income tax, and specifically excludes municipal bond income from taxation.
Note: today, a portion of municipal bonds are taxable.
1930: Expansion in the West
In the midst of the Great Depression, voters approve $35 million in funding to build the Golden Gate Bridge.
1939-1945: Diverted Resources
With financial resources directed to the military in WWII, municipal debt falls. By 1945, total debt sits at less than $20 billion.
1960: Exponential Growth
Only 25 years later, outstanding public debt—the total amount owed to creditors—more than triples to $66 billion.
1971: Investor Protection
Municipal bond insurance is introduced. That same year, insured municipal bonds finance the construction of hospital facilities in Alaska—bringing essential services and investment opportunities to a remote area.
1975: Marketplace Stewardship
Bringing further reassurance to the municipal bond market, the Municipal Securities Rulemaking Board (MSRB) is introduced to establish regulations for dealers, and for advisors at a later date.
1981: Continued Growth
Outstanding public debt reaches $361 billion.
Modern Day
2009-2010: Economic Recovery
More than $181 billion of federally-subsidized Build America Bonds are issued by state and local governments to help stimulate the economy after the financial crisis.
2016-2018: Investor Dollars at Work
In recent years, state and local debt has financed many important projects across the country.
- 2016: The New York State Thruway Authority issues $850 million in bonds to finance a portion of the new NY Bridge Project.
- 2017: California’s Department of Water Resources issues $428 million in bonds for the maintenance and construction of its water management infrastructure.
- 2018: The Denver International Airport issues $2.5B in bonds to finance capital improvements, the largest airport revenue bond in municipal bond history.
2018: Helping People and the Planet
Sustainable applications for municipal bonds continue to grow, with Californian voters approving $2 billion in financing for supportive housing. In addition, state and local governments issue $4.9 billion in U.S. municipal green bonds.
Today: A Sizable Investment Opportunity
As financing spans the nation, the U.S. municipal bond market is both large and active:
- $3.8 trillion capital market
- One million outstanding securities
- $11.6 billion in par traded per/day
- 40,000 daily trades
Not only that, municipals have offered a compelling after-tax yield. For example, high yield municipals offered 121% of the after-tax yield of high yield corporates as of September 30, 2019.
The Foundation of Infrastructure
For over 200 years, municipal bonds have provided critical financing to build hospitals, schools, highways, airports, and more. Today, two out of three infrastructure projects in the U.S. are financed by municipal bonds.
Additionally, municipals have weathered almost every economic storm, providing much-needed capital stimulus during some of the deepest U.S. recessions. As history continues to unfold, municipals hold great potential for issuers, communities, and investors.


Markets
U.S. Debt Interest Payments Reach $1 Trillion
U.S. debt interest payments have surged past the $1 trillion dollar mark, amid high interest rates and an ever-expanding debt burden.


U.S. Debt Interest Payments Reach $1 Trillion
This was originally posted on our Voronoi app. Download the app for free on iOS or Android and discover incredible data-driven charts from a variety of trusted sources.
The cost of paying for America’s national debt crossed the $1 trillion dollar mark in 2023, driven by high interest rates and a record $34 trillion mountain of debt.
Over the last decade, U.S. debt interest payments have more than doubled amid vast government spending during the pandemic crisis. As debt payments continue to soar, the Congressional Budget Office (CBO) reported that debt servicing costs surpassed defense spending for the first time ever this year.
This graphic shows the sharp rise in U.S. debt payments, based on data from the Federal Reserve.
A $1 Trillion Interest Bill, and Growing
Below, we show how U.S. debt interest payments have risen at a faster pace than at another time in modern history:
| Date | Interest Payments | U.S. National Debt |
|---|---|---|
| 2023 | $1.0T | $34.0T |
| 2022 | $830B | $31.4T |
| 2021 | $612B | $29.6T |
| 2020 | $518B | $27.7T |
| 2019 | $564B | $23.2T |
| 2018 | $571B | $22.0T |
| 2017 | $493B | $20.5T |
| 2016 | $460B | $20.0T |
| 2015 | $435B | $18.9T |
| 2014 | $442B | $18.1T |
| 2013 | $425B | $17.2T |
| 2012 | $417B | $16.4T |
| 2011 | $433B | $15.2T |
| 2010 | $400B | $14.0T |
| 2009 | $354B | $12.3T |
| 2008 | $380B | $10.7T |
| 2007 | $414B | $9.2T |
| 2006 | $387B | $8.7T |
| 2005 | $355B | $8.2T |
| 2004 | $318B | $7.6T |
| 2003 | $294B | $7.0T |
| 2002 | $298B | $6.4T |
| 2001 | $318B | $5.9T |
| 2000 | $353B | $5.7T |
| 1999 | $353B | $5.8T |
| 1998 | $360B | $5.6T |
| 1997 | $368B | $5.5T |
| 1996 | $362B | $5.3T |
| 1995 | $357B | $5.0T |
| 1994 | $334B | $4.8T |
| 1993 | $311B | $4.5T |
| 1992 | $306B | $4.2T |
| 1991 | $308B | $3.8T |
| 1990 | $298B | $3.4T |
| 1989 | $275B | $3.0T |
| 1988 | $254B | $2.7T |
| 1987 | $240B | $2.4T |
| 1986 | $225B | $2.2T |
| 1985 | $219B | $1.9T |
| 1984 | $205B | $1.7T |
| 1983 | $176B | $1.4T |
| 1982 | $157B | $1.2T |
| 1981 | $142B | $1.0T |
| 1980 | $113B | $930.2B |
| 1979 | $96B | $845.1B |
| 1978 | $84B | $789.2B |
| 1977 | $69B | $718.9B |
| 1976 | $61B | $653.5B |
| 1975 | $55B | $576.6B |
| 1974 | $50B | $492.7B |
| 1973 | $45B | $469.1B |
| 1972 | $39B | $448.5B |
| 1971 | $36B | $424.1B |
| 1970 | $35B | $389.2B |
| 1969 | $30B | $368.2B |
| 1968 | $25B | $358.0B |
| 1967 | $23B | $344.7B |
| 1966 | $21B | $329.3B |
Interest payments represent seasonally adjusted annual rate at the end of Q4.
At current rates, the U.S. national debt is growing by a remarkable $1 trillion about every 100 days, equal to roughly $3.6 trillion per year.
As the national debt has ballooned, debt payments even exceeded Medicaid outlays in 2023—one of the government’s largest expenditures. On average, the U.S. spent more than $2 billion per day on interest costs last year. Going further, the U.S. government is projected to spend a historic $12.4 trillion on interest payments over the next decade, averaging about $37,100 per American.
Exacerbating matters is that the U.S. is running a steep deficit, which stood at $1.1 trillion for the first six months of fiscal 2024. This has accelerated due to the 43% increase in debt servicing costs along with a $31 billion dollar increase in defense spending from a year earlier. Additionally, a $30 billion increase in funding for the Federal Deposit Insurance Corporation in light of the regional banking crisis last year was a major contributor to the deficit increase.
Overall, the CBO forecasts that roughly 75% of the federal deficit’s increase will be due to interest costs by 2034.

-

 Mining2 weeks ago
Charted: The Value Gap Between the Gold Price and Gold Miners
-

 Real Estate1 week ago
Ranked: The Most Valuable Housing Markets in America
-

 Business1 week ago
Charted: Big Four Market Share by S&P 500 Audits
-

 AI1 week ago
The Stock Performance of U.S. Chipmakers So Far in 2024
-

 Misc1 week ago
Almost Every EV Stock is Down After Q1 2024
-

 Money2 weeks ago
Where Does One U.S. Tax Dollar Go?
-

 Green2 weeks ago
Ranked: Top Countries by Total Forest Loss Since 2001
-

 Real Estate2 weeks ago
Visualizing America’s Shortage of Affordable Homes