Datastream
Equity Purchases by the Bank of Japan Reach a New Milestone
The Briefing
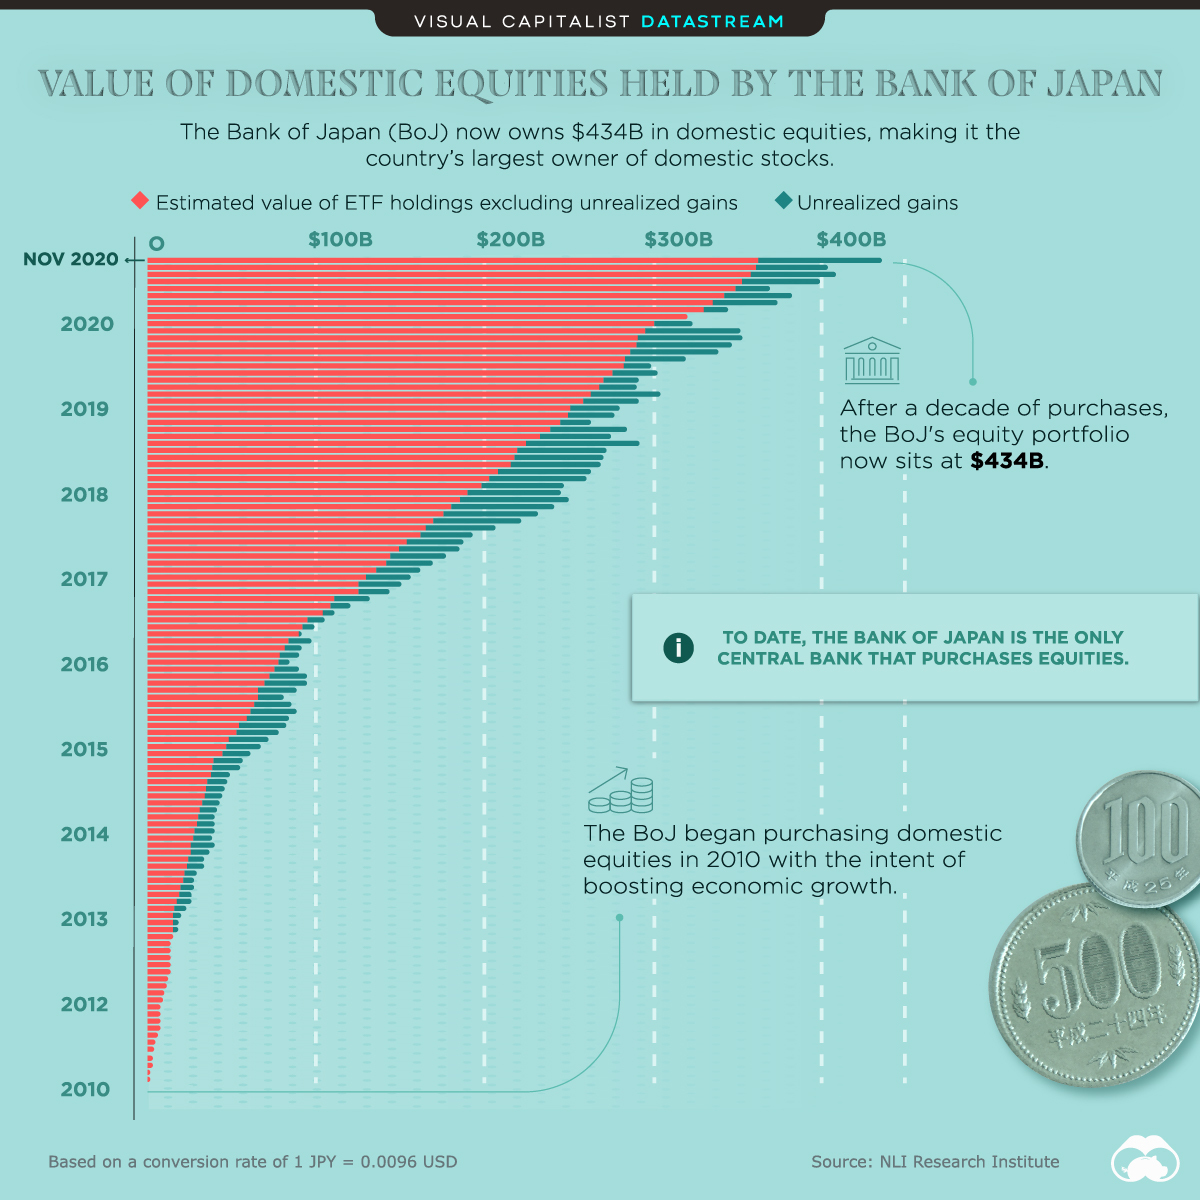
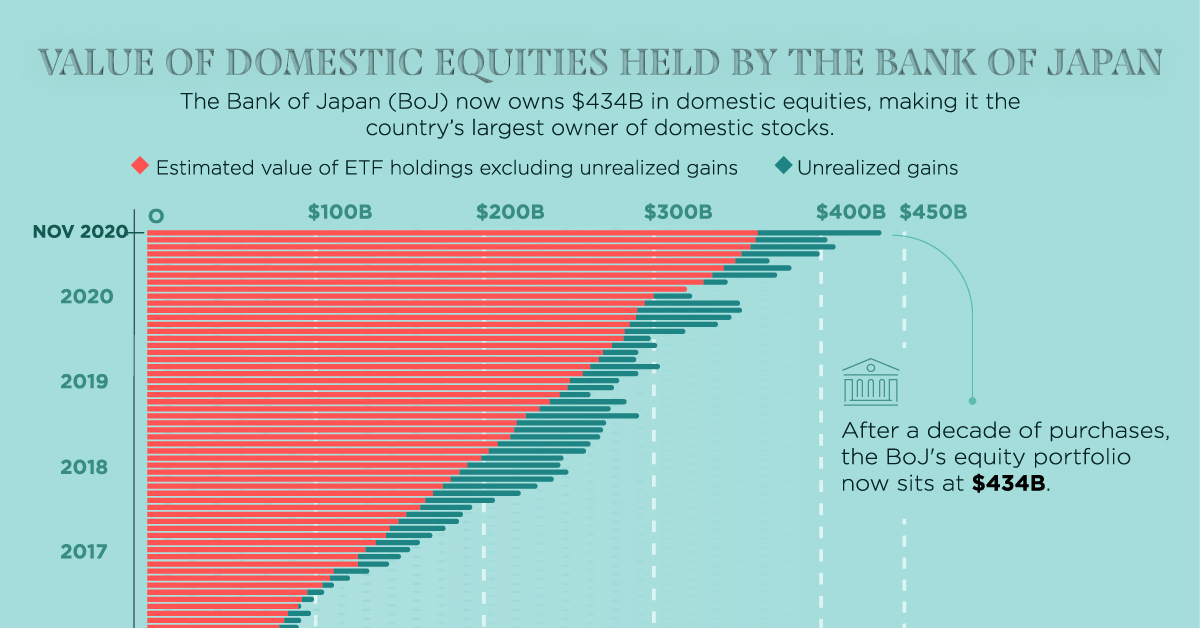
- Domestic equities held by the Bank of Japan (BoJ) reached $434 billion in November 2020, the highest value ever recorded on its balance sheet
- The BoJ began buying equity ETFs (exchange-traded funds) in 2010 to help stabilize its economy
- The BoJ has now surpassed the country’s Government Pension Investment Fund as the largest owner of Japanese stocks
Equity Purchases by the Bank of Japan Reach a New Milestone
The Bank of Japan (BoJ) increased its equity holdings to $434 billion in November 2020, surpassing Japan’s Government Pension Investment Fund to become the country’s largest holder of domestic stocks.
This milestone will likely capture the attention of global policymakers, as the BoJ is the only central bank to purchase equities—a practice it first began in 2010. These purchases were intended to stabilize the Japanese economy after the 2008 financial crisis, but have carried on ever since.
Why Does the Bank of Japan Purchase Equities?
For decades, Japan has experienced a stubbornly low rate of economic growth relative to its peers. Despite the BoJ’s best efforts to boost growth, this trend has continued after the events of 2008.
| Year | Japan (% GDP growth) | South Korea (% GDP growth) | U.S. (% GDP growth) |
|---|---|---|---|
| 2010 | 4.2% | 6.8% | 2.6% |
| 2011 | -0.1% | 3.7% | 1.6% |
| 2012 | 1.5% | 2.4% | 2.3% |
| 2013 | 2.0% | 3.2% | 1.8% |
| 2014 | 0.4% | 3.2% | 2.5% |
| 2015 | 1.2% | 2.8% | 2.9% |
| 2016 | 0.5% | 2.9% | 1.6% |
| 2017 | 2.2% | 3.2% | 2.4% |
| 2018 | 0.3% | 2.9% | 2.9% |
| 2019 | 0.6% | 2.0% | 2.2% |
| Average | 1.28% 🇯🇵 | 3.31% 🇰🇷 | 2.28% 🇺🇸 |
Source: World Bank
No stranger to unconventional policies, the BoJ believes its equity purchases will add a sense of security to the stock market, and as a result, encourage greater levels of investment. Since these purchases began, the Nikkei 225, an index tracking 225 large Japanese corporations, has generated a total return of roughly 160%.
A Drop in the Pond
While $434 billion in equities is by no means a small amount, it pales in comparison to the BoJ’s total assets of $6.7 trillion. This includes $5.1 trillion in Japanese government debt, and $59.4 billion in domestic corporate bonds.
These figures fall in line with other central banks including the U.S. Fed, which currently has $7.4 trillion in assets on its balance sheet. Whether the Fed will also begin purchasing equities, however, remains to be seen.
Where does this data come from?
Source: NLI Research Institute, 2020
Notes: Data as of Nov. 30, 2020.
Figures based on a conversion rate of 1 JPY = 0.0096 USD.


Datastream
Can You Calculate Your Daily Carbon Footprint?
Discover how the average person’s carbon footprint impacts the environment and learn how carbon credits can offset your carbon footprint.


The Briefing
- A person’s carbon footprint is substantial, with activities such as food consumption creating as much as 4,500 g of CO₂ emissions daily.
- By purchasing carbon credits from Carbon Streaming Corporation, you can offset your own emissions and fund positive climate action.
Your Everyday Carbon Footprint
While many large businesses and countries have committed to net-zero goals, it is essential to acknowledge that your everyday activities also contribute to global emissions.
In this graphic, sponsored by Carbon Streaming Corporation, we will explore how the choices we make and the products we use have a profound impact on our carbon footprint.
Carbon Emissions by Activity
Here are some of the daily activities and products of the average person and their carbon footprint, according to Clever Carbon.
| Household Activities & Products | CO2 Emissions (g) |
|---|---|
| 💡 Standard Light Bulb (100 watts, four hours) | 172 g |
| 📱 Mobile Phone Use (195 minutes per day)* | 189 g |
| 👕 Washing Machine (0.63 kWh) | 275 g |
| 🔥 Electric Oven (1.56 kWh) | 675 g |
| ♨️ Tumble Dryer (2.5 kWh) | 1,000 g |
| 🧻 Toilet Roll (2 ply) | 1,300 g |
| 🚿 Hot Shower (10 mins) | 2,000 g |
| 🚙 Daily Commute (one hour, by car) | 3,360 g |
| 🍽️ Average Daily Food Consumption (three meals of 600 calories) | 4,500 g |
| *Phone use based on yearly use of 69kg per the source, Reboxed | |
Your choice of transportation plays a crucial role in determining your carbon footprint. For instance, a 15 km daily commute to work on public transport generates an average of 1,464 g of CO₂ emissions. Compared to 3,360 g—twice the volume for a journey the same length by car.
By opting for more sustainable modes of transport, such as cycling, walking, or public transportation, you can significantly reduce your carbon footprint.
Addressing Your Carbon Footprint
One way to compensate for your emissions is by purchasing high-quality carbon credits.
Carbon credits are used to help fund projects that avoid, reduce or remove CO₂ emissions. This includes nature-based solutions such as reforestation and improved forest management, or technology-based solutions such as the production of biochar and carbon capture and storage (CCS).
While carbon credits offer a potential solution for individuals to help reduce global emissions, public awareness remains a significant challenge. A BCG-Patch survey revealed that only 34% of U.S. consumers are familiar with carbon credits, and only 3% have purchased them in the past.
About Carbon Streaming
By financing the creation or expansion of carbon projects, Carbon Streaming Corporation secures the rights to future carbon credits generated by these sustainable projects. You can then purchase these carbon credits to help fund climate solutions around the world and compensate for your own emissions.
Ready to get involved?
>> Learn more about purchasing carbon credits at Carbon Streaming

-

 Green2 weeks ago
Ranked: Top Countries by Total Forest Loss Since 2001
-

 Travel1 week ago
Ranked: The World’s Top Flight Routes, by Revenue
-

 Technology2 weeks ago
Ranked: Semiconductor Companies by Industry Revenue Share
-

 Money2 weeks ago
Which States Have the Highest Minimum Wage in America?
-

 Real Estate2 weeks ago
Ranked: The Most Valuable Housing Markets in America
-

 Markets2 weeks ago
Charted: Big Four Market Share by S&P 500 Audits
-

 AI2 weeks ago
The Stock Performance of U.S. Chipmakers So Far in 2024
-

 Automotive2 weeks ago
Almost Every EV Stock is Down After Q1 2024