Energy
What Energy Sources Power the World?
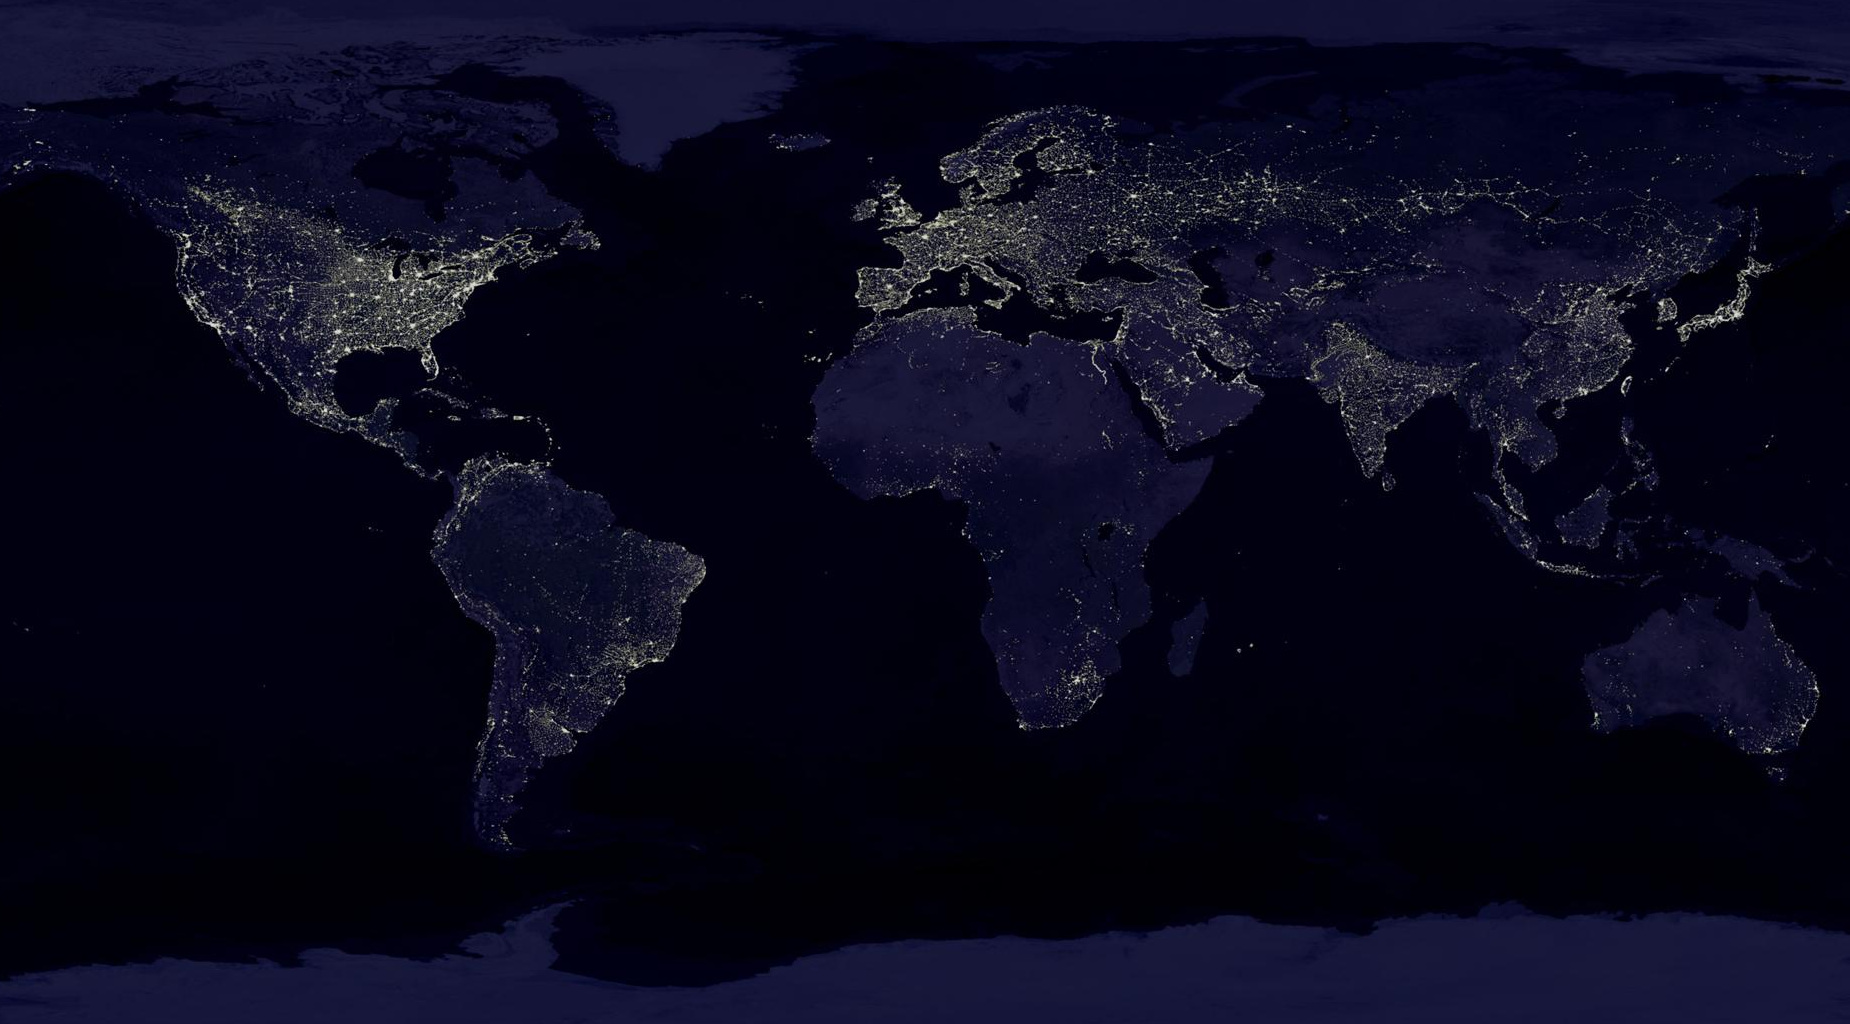
There are many types of maps out there, but one of the most telling ones is a simple satellite image of the Earth at night.
On these powerful images, the darkness is a blank canvas for the bright city lights that represent the vast extent of human geography. The bright spots help us understand the distribution of population, as well as what areas of the world are generally wealthier and more urban. Meanwhile, the big dark spots – such as over the wilderness in northern Canada, the Amazon basin, or in Niger – show areas that are not densely populated or more rural.
Here’s one image based on this principle. It comes from NASA, and is a composite made from 400 separate satellite images from 2012:
How Are These Lights Powered?
But what if we could differentiate, by “shutting off” lights that are powered by certain electricity sources?
Today’s visualizations come from a nifty interactive website put together by GoCompare.com, and they breakdown the world’s electricity by source: fossil fuels, renewables, or nuclear fission.
Fossil Fuels
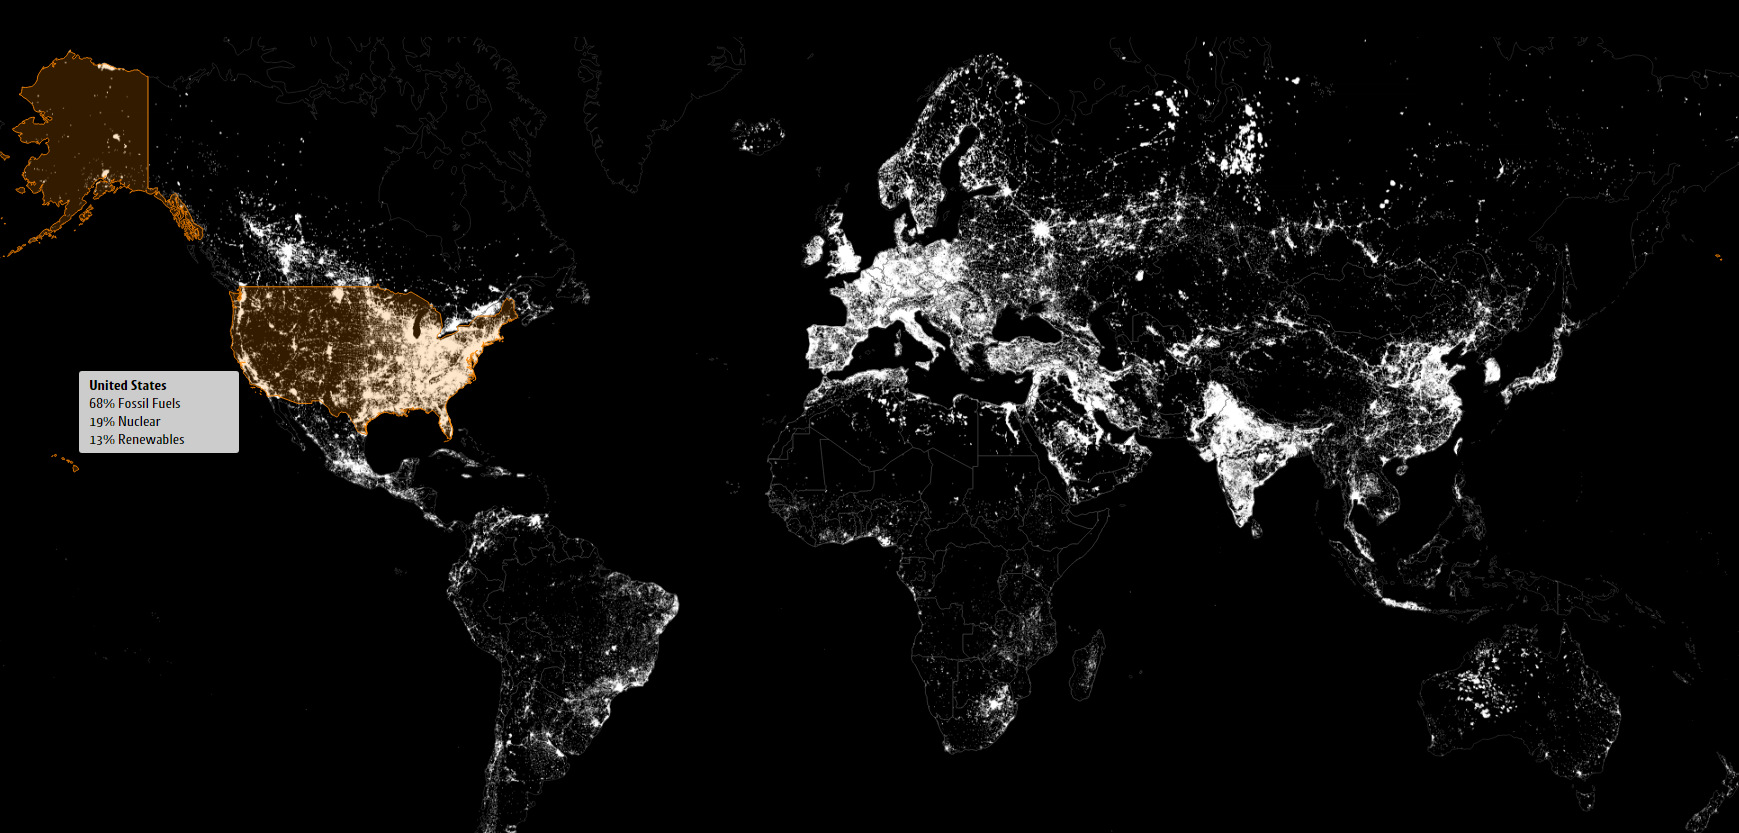
To start, here are the places on Earth that are powered by fossil fuels.
(Click image to see larger version)
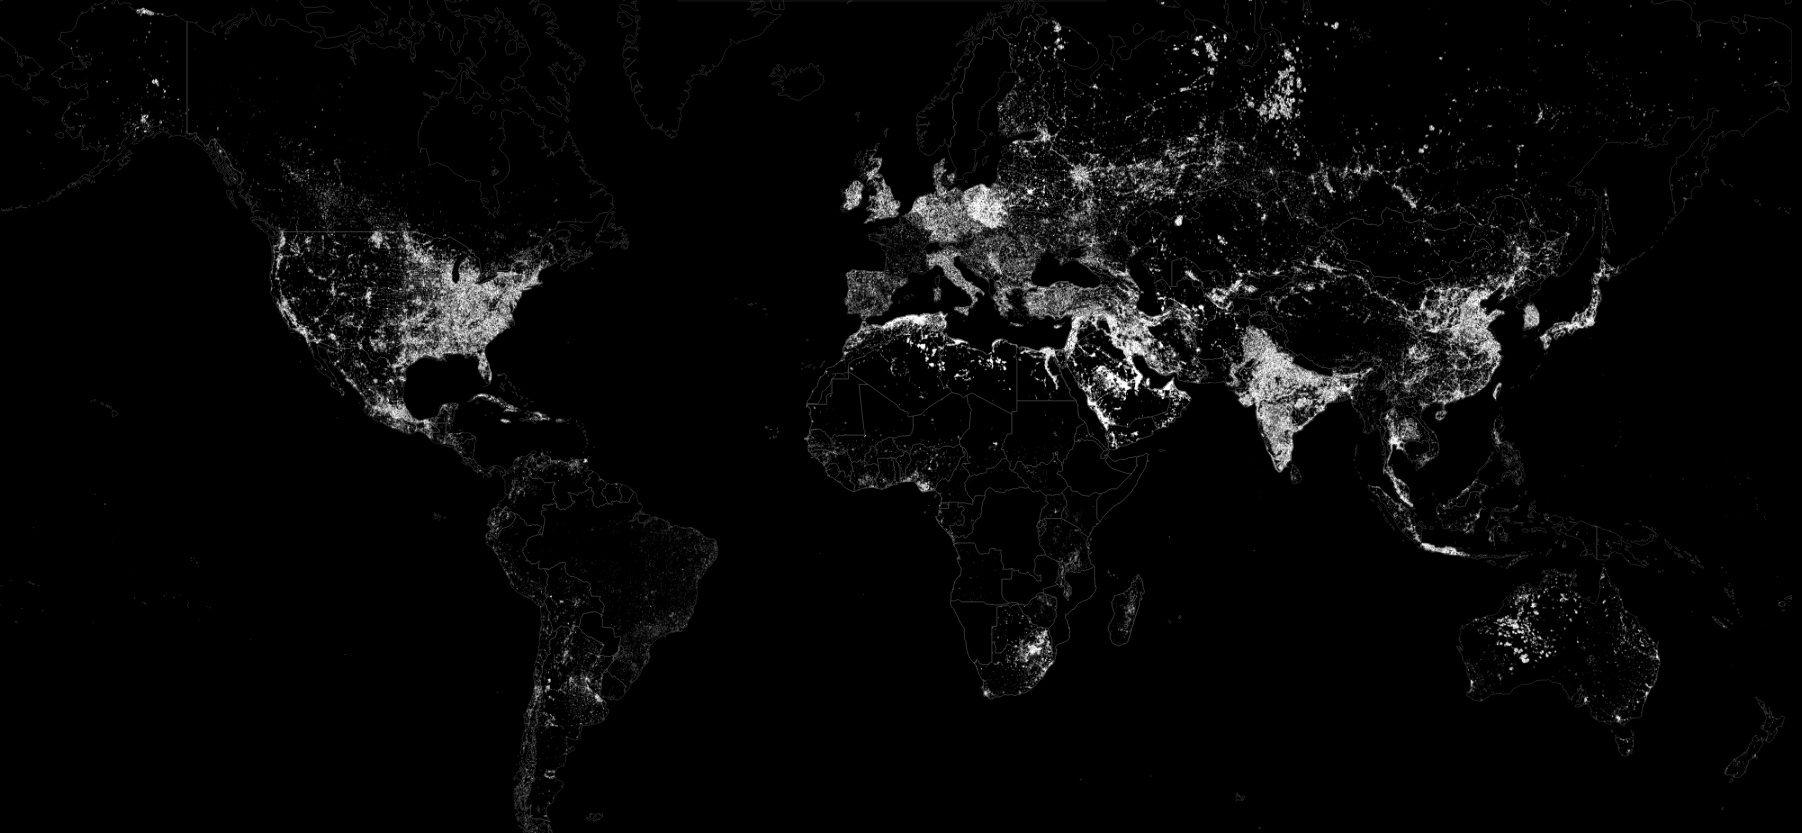
Globally, fossil fuels represent about two-thirds of electricity usage. It’s also worth noting that fossil fuels also make up the majority of non-electrical sources needed for things like automobiles, aircraft, and ships, which are not shown on the map.
For further interest, we have previously shown the evolution over time of total U.S. energy usage, as well as a detailed breakdown of current U.S. usage – both which are still dominated by fossil fuels such as oil, natural gas, and coal.
Nuclear Only
Here are the places on Earth powered by nuclear fission.
(Click image to see larger version)
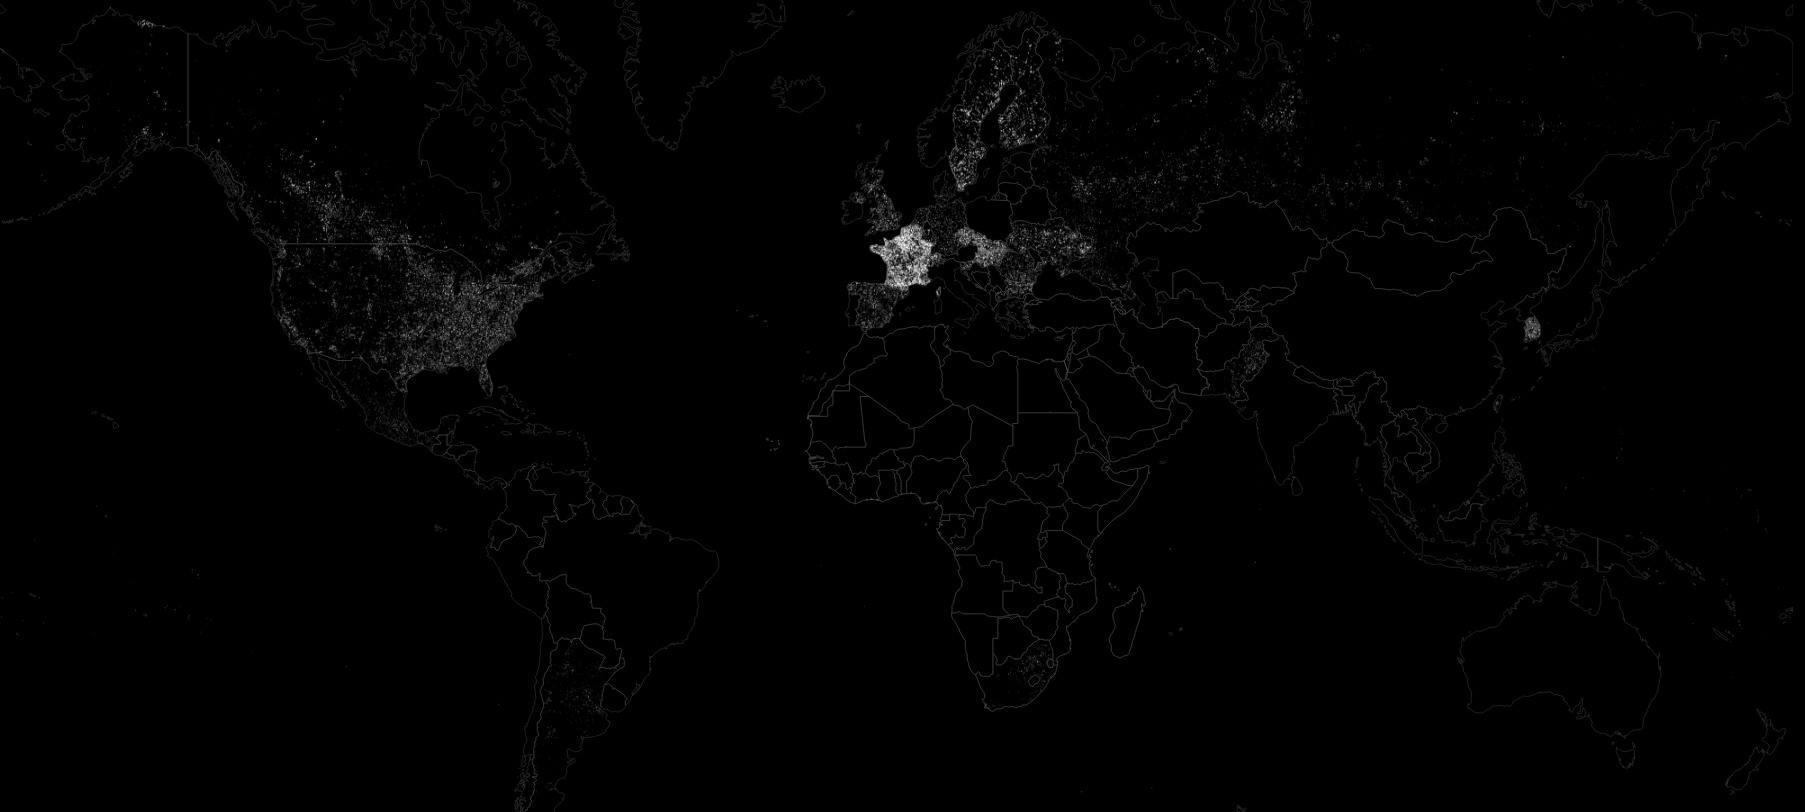
Nuclear makes up about 10% of all global electricity usage – and France is the world’s most reliant country, getting about 74% of its power mix from nuclear. Also noteworthy is Japan, which has switched its major electrical source from nuclear to fossil fuels since the Fukushima incident in 2011.
Nuclear is a major source of energy in the rest of Europe as well.
Belgium (51%), Sweden (43%), Hungary (51%), Slovakia (55%), Czech Republic (35%), Slovenia (33%), Ukraine (43%), and Finland (33%) all draw significant amounts of their electricity from nuclear reactors.
Renewables
Last, but not least, are renewables.
(Click image to see larger version)
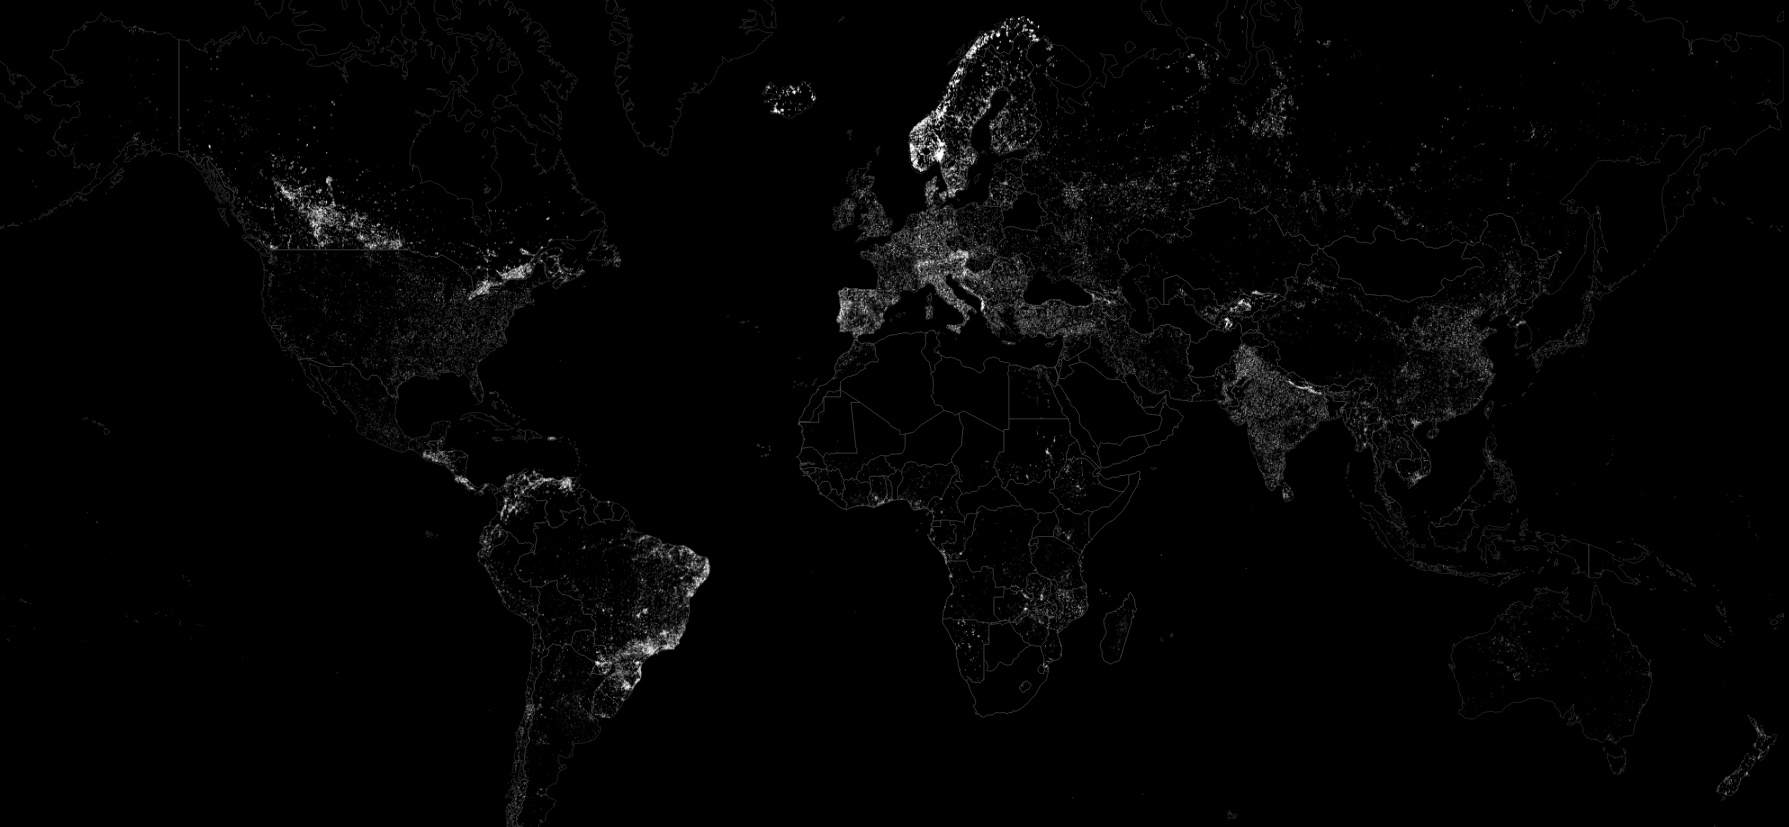
It’s important to remember here that hydroelectricity is the largest renewable energy source by far, and that countries like Canada and Brazil rely on hydro extensively.
Outside of hydro, Italy is a leader in solar generation (6% of all electricity). Meanwhile, just eight countries host over 80% of all installed wind power: France, Canada, United Kingdom, Spain, India, Germany, USA, and China.
Finally, it’s worth noting that there are four smaller countries that get all, or nearly all, of their electricity from renewable sources. Those include Iceland (72% hydro, 28% geothermal), Albania (100% hydro), Paraguay (100% hydro), and Norway (97% hydro, 2% fossil fuels, and 1% other).


Energy
The World’s Biggest Oil Producers in 2023
Just three countries accounted for 40% of global oil production last year.
The World’s Biggest Oil Producers in 2023
This was originally posted on Elements. Sign up to the free mailing list to get beautiful visualizations on natural resource megatrends in your email.
Despite efforts to decarbonize the global economy, oil still remains one of the world’s most important resources. It’s also produced by a fairly limited group of countries, which can be a source of economic and political leverage.
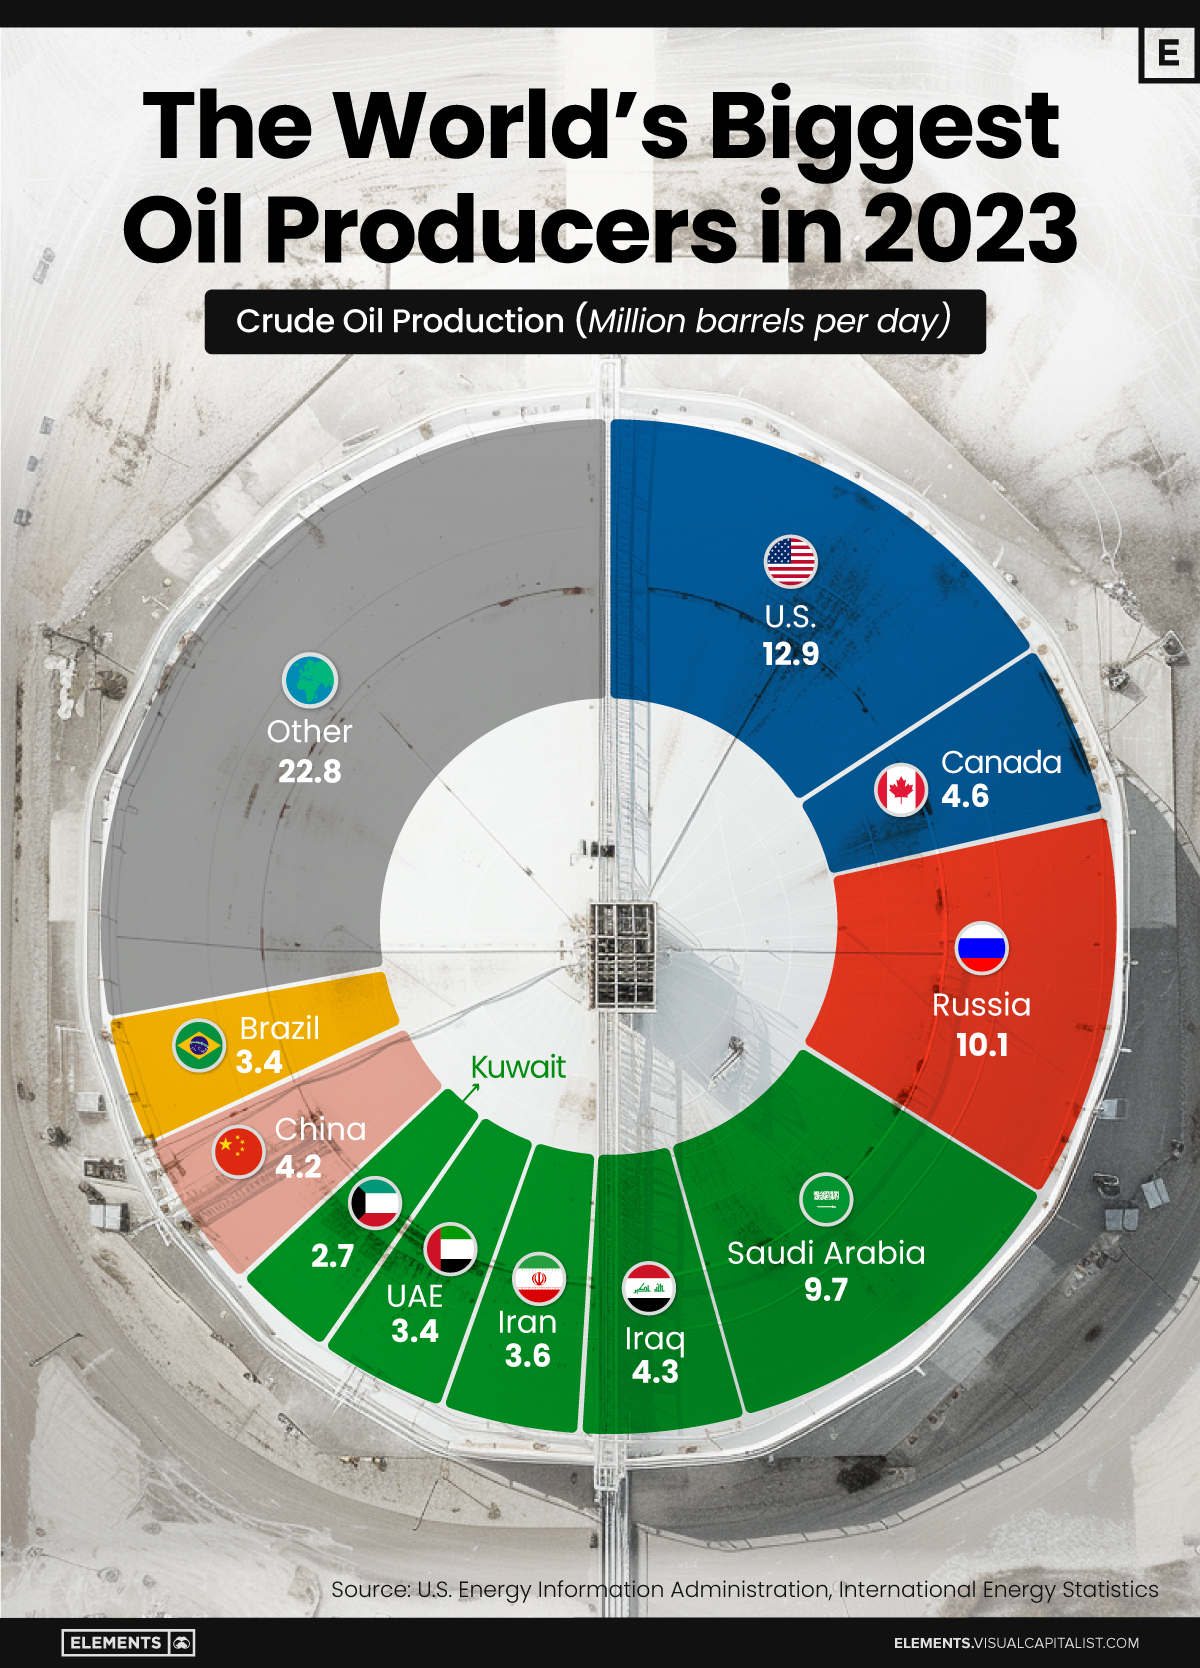
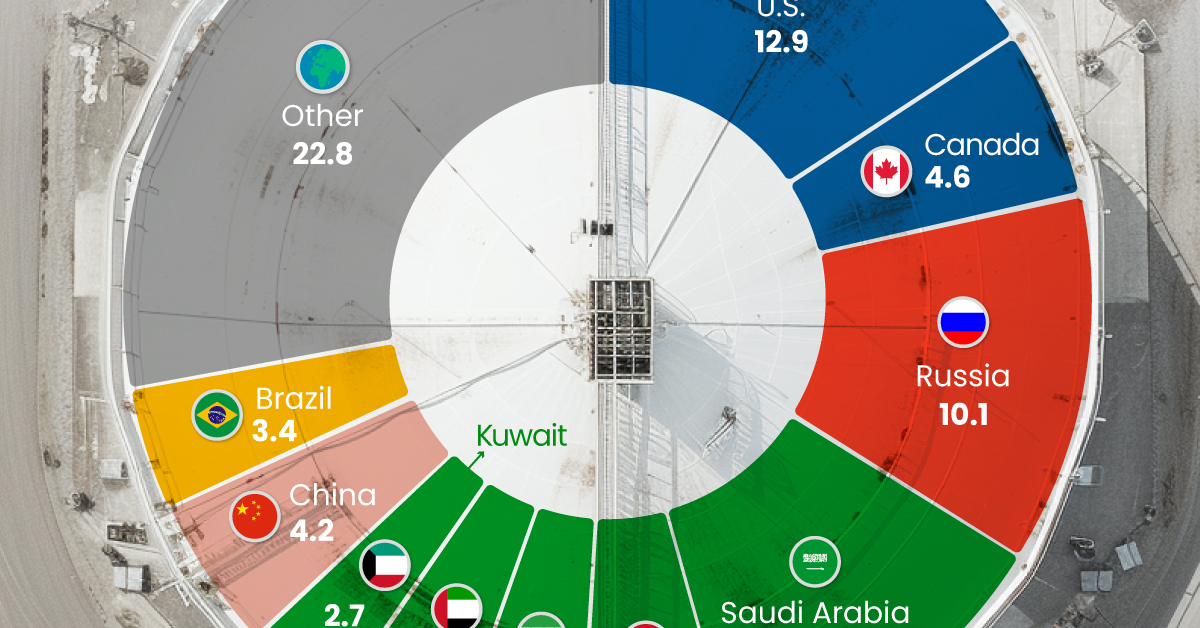
This graphic illustrates global crude oil production in 2023, measured in million barrels per day, sourced from the U.S. Energy Information Administration (EIA).
Three Countries Account for 40% of Global Oil Production
In 2023, the United States, Russia, and Saudi Arabia collectively contributed 32.7 million barrels per day to global oil production.
| Oil Production 2023 | Million barrels per day |
|---|---|
| 🇺🇸 U.S. | 12.9 |
| 🇷🇺 Russia | 10.1 |
| 🇸🇦 Saudi Arabia | 9.7 |
| 🇨🇦 Canada | 4.6 |
| 🇮🇶 Iraq | 4.3 |
| 🇨🇳 China | 4.2 |
| 🇮🇷 Iran | 3.6 |
| 🇧🇷 Brazil | 3.4 |
| 🇦🇪 UAE | 3.4 |
| 🇰🇼 Kuwait | 2.7 |
| 🌍 Other | 22.8 |
These three nations have consistently dominated oil production since 1971. The leading position, however, has alternated among them over the past five decades.
In contrast, the combined production of the next three largest producers—Canada, Iraq, and China—reached 13.1 million barrels per day in 2023, just surpassing the production of the United States alone.
In the near term, no country is likely to surpass the record production achieved by the U.S. in 2023, as no other producer has ever reached a daily capacity of 13.0 million barrels. Recently, Saudi Arabia’s state-owned Saudi Aramco scrapped plans to increase production capacity to 13.0 million barrels per day by 2027.
In 2024, analysts forecast that the U.S. will maintain its position as the top oil producer. In fact, according to Macquarie Group, U.S. oil production is expected to achieve a record pace of about 14 million barrels per day by the end of the year.

-

 Business2 weeks ago
America’s Top Companies by Revenue (1994 vs. 2023)
-

 Environment1 week ago
Ranked: Top Countries by Total Forest Loss Since 2001
-

 Markets1 week ago
Visualizing America’s Shortage of Affordable Homes
-

 Maps2 weeks ago
Mapped: Average Wages Across Europe
-

 Mining2 weeks ago
Charted: The Value Gap Between the Gold Price and Gold Miners
-

 Demographics2 weeks ago
Visualizing the Size of the Global Senior Population
-

 Misc2 weeks ago
Tesla Is Once Again the World’s Best-Selling EV Company
-

 Technology2 weeks ago
Ranked: The Most Popular Smartphone Brands in the U.S.