Energy
Charting the Flows of Energy Consumption by Source and Country (1969-2018)
View the interactive version of this visualization
Charting Energy Consumption by Source and Country
View the interactive version of this post by clicking here.
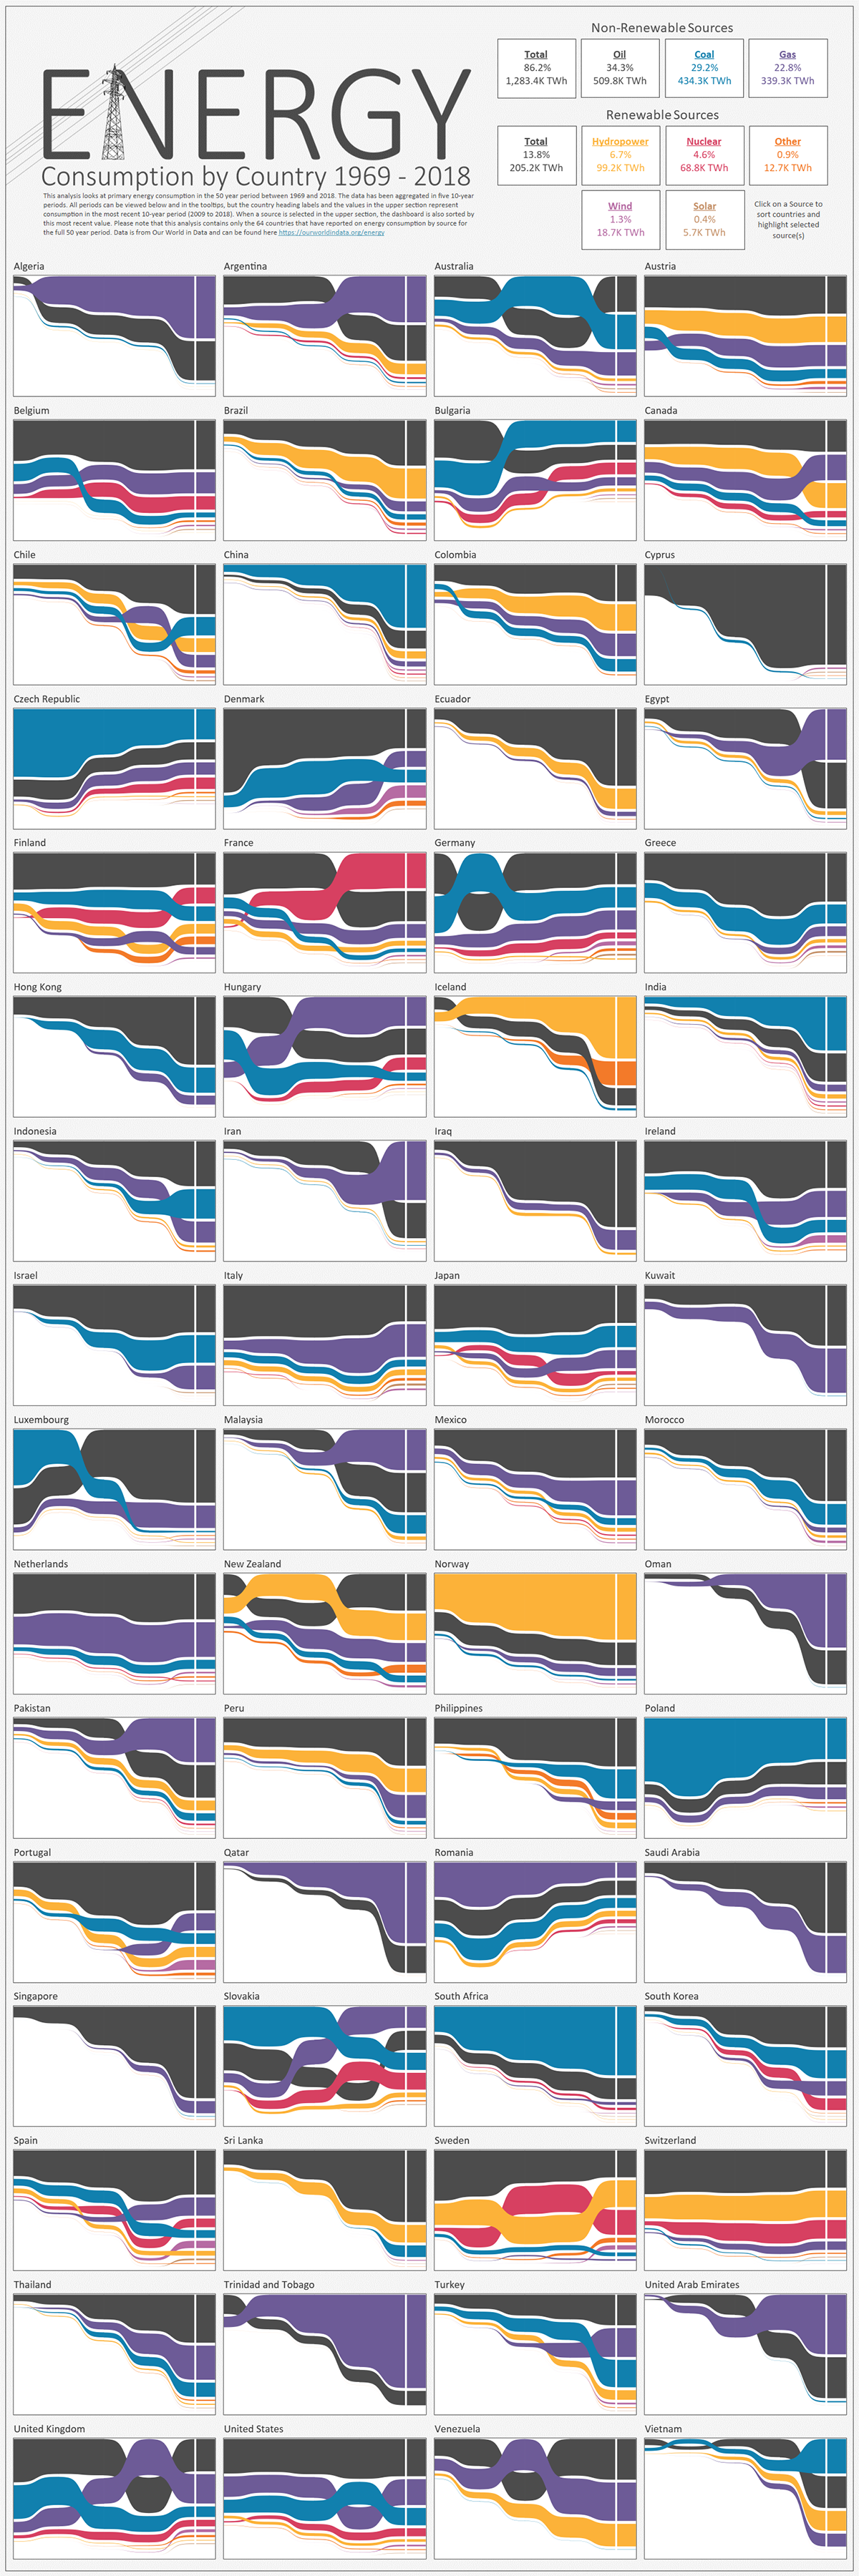
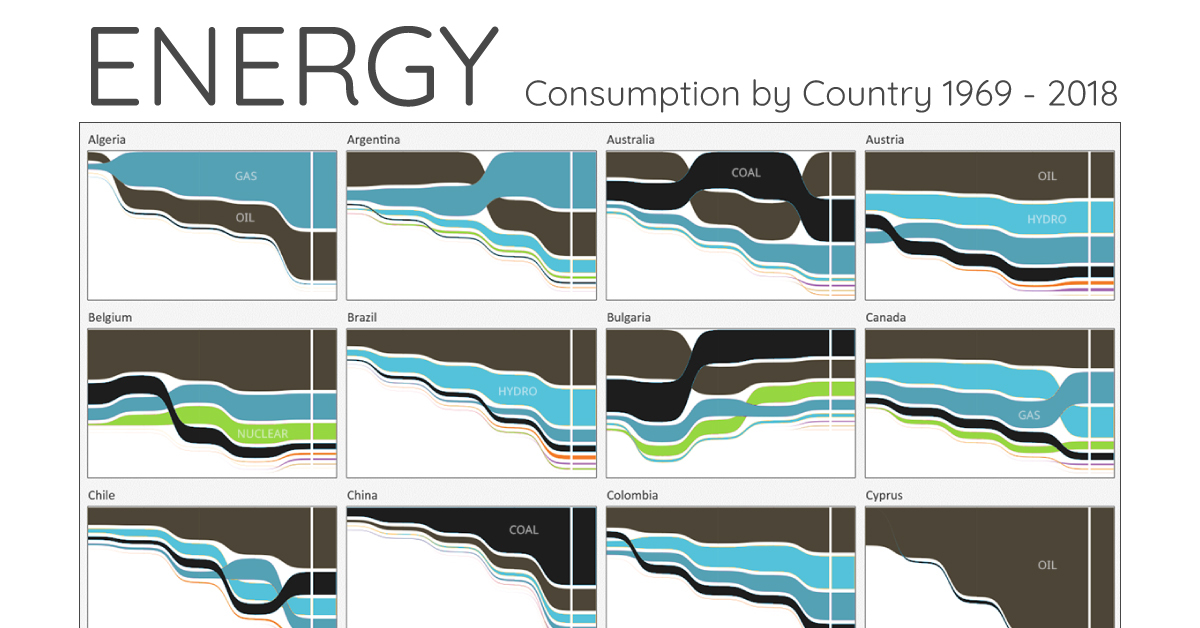
Over the last 50 years, the world has seen a colossal increase in energy consumption—and with the ongoing transition to renewable energy, it’s interesting to look at how these sources of energy have been evolving over time.
While some countries continue to rely heavily on fossil fuels like oil, coal, and natural gas, others have integrated alternative energy sources into their mix.
This visualization comes to us from Brian Moore and it charts the evolution of energy consumption in the 64 countries that have data available for all of the last 50 years.
Tera-What? The Most Prominent Sources of Energy (2009-2018)
First, let’s take a look at which sources have produced the most energy over the last decade of data. Energy consumption is measured in terawatt-hours (TWh)—a unit of energy equal to outputting one trillion watts for an hour.
| Energy Source | % of Total Energy Consumption (2009-2018) | Sum of Total Energy (2009-2018) (TWh) |
|---|---|---|
| Oil | 34.3% | 509,800 |
| Coal | 29.2% | 434,300 |
| Gas | 22.8% | 339,300 |
| Hydropower | 6.7% | 99,200 |
| Nuclear | 4.6% | 68,800 |
| Wind | 1.3% | 18,700 |
| Geothermal/Biomass/Other | 0.9% | 12,700 |
| Solar | 0.4% | 5,700 |
| Total | 100.0% | 1,389,300 TWh |
Looking at this data, it’s clear that fossil fuels have been used much more than alternative sources. A deeper dive into the topic helps explain why.
Fossil Fuels: What the Data Shows
As the predominant source of energy, fossil fuels collectively accounted for a massive 86.2% of total energy consumption over 2009-2018, or roughly 1.2 million TWh. If you’re wondering, that’s enough to power the equivalent of 109 billion U.S. homes with electricity for a year.
Among fossil fuel sources, oil emerges as the clear leader, responsible for 34.3% or 509,800 TWh of energy consumption over 2009-2018. Apart from being the primary fuel for transportation throughout history, oil remains relatively affordable—making it an easy choice for producers and consumers alike.
Closely following oil is coal, which countries rely on for its abundance, low costs, and low infrastructure requirements. Over the last decade of data, 29.2% of total energy came from coal, amounting to a substantial 434,300 TWh.
As a cleaner alternative to coal, natural gas has increased in popularity. Gas accounted for 22.8% or 339,300 TWh of energy consumed between 2009-2018, mainly attributed to its ample supply and affordability.
What About Renewables?
Only 13.8% of energy consumption over 2009-2018 came from renewable or alternative sources of energy, and hydropower accounts for nearly half of it. Why has the use of environmentally-friendly energy sources been so low?
Setting up alternative power plants—especially wind, solar, and nuclear—requires significant capital investment, while facing competition from cheaper and more convenient fossil fuels. The barriers to adopting renewable energy have been weakening, but still remain quite high for low-income countries.
Wind and solar energy were responsible for a mere 1.7% of energy consumption. Compared to fossil fuels like oil and coal, this percentage seems even more minuscule than it does on its own—mainly attributable to the high costs traditionally associated with wind and solar energy.
The Top 10 Countries Relying on Fossil Fuels
Fossil fuels have been the predominant source of energy over the years. After all, 43 of these 64 countries sourced more than 80% of their energy from fossil fuels over 2009-2018.
Here are the ones that come out on top:
| Country | % of Energy Consumed From Fossil Fuels (2009-2018) | Most Used Fossil Fuel (2009-2018) |
|---|---|---|
| Oman 🇴🇲 | 100% | Gas |
| Saudi Arabia 🇸🇦 | 100% | Oil |
| Trinidad and Tobago 🇹🇹 | 100% | Gas |
| Kuwait 🇰🇼 | 100% | Oil |
| Qatar 🇶🇦 | 99.9% | Gas |
| United Arab Emirates 🇦🇪 | 99.9% | Gas |
| Hong Kong 🇭🇰 | 99.9% | Oil |
| Algeria 🇩🇿 | 98.8% | Gas |
| Singapore 🇸🇬 | 98.8% | Oil |
| Israel 🇮🇱 | 98.1% | Oil |
Although it is startling to see that several countries were 100% reliant on fossil fuels, it comes as no surprise that these are countries with abundant reserves of oil or natural gas. Not only are fossil fuels central to certain economies in Middle Eastern and North African (MENA), but they also remain highly affordable for consumers in these places.
On a broader scale, developing and low-income countries are heavily dependent on fossil fuels such as coal for access to cheap electricity and ease of installation.
The Top 10 Countries Using Alternative Energy Sources
The transition to alternative energy sources has been welcomed by many countries, but only a few have prioritized its adoption in the energy mix. Here’s a look at the top 10:
| Country | % of Energy From Alternative Sources (2009-2018) | Most Used Alternative Energy Source (2009-2018) |
|---|---|---|
| Iceland 🇮🇸 | 81.6% | Hydropower |
| Norway 🇳🇴 | 67.5% | Hydropower |
| Sweden 🇸🇪 | 65.3% | Hydropower |
| Switzerland 🇨🇭 | 50.5% | Hydropower |
| France 🇫🇷 | 47.0% | Nuclear |
| Finland 🇫🇮 | 39.5% | Nuclear |
| New Zealand 🇳🇿 | 37.2% | Hydropower |
| Brazil 🇧🇷 | 37.2% | Hydropower |
| Canada 🇨🇦 | 34.8% | Hydropower |
| Austria 🇦🇹 | 31.7% | Hydropower |
Iceland is the only country to have sourced over 80% of its energy from alternative sources over 2009-2018. In general, developed European countries are leading the charge—with Iceland, Norway, Sweden, Switzerland, and France making the top five.
The dominance of hydropower is notable, and so is the lack of wind and solar energy sources. Denmark had the highest percentage of wind energy in its mix, with 14.5%, whereas Italy had the highest percentage of solar, with just 2.4%.
It should be kept in mind that this percentage does not account for population differences. For example, although Italy boasted the highest percentage of solar in its energy mix with 2.4%, China consumed the most amount of energy from solar sources—despite it accounting for only 0.3% of total Chinese energy consumption.
Nevertheless, the costs of solar and wind energy have been falling continuously, and the potential for growth in the renewable energy sector is higher than ever.
The Transition to Renewables: Are We On Track?
Since the Industrial Revolution, fossil fuels have been the primary source of energy worldwide. More recently, the use of renewable energy sources has increased, but not substantially enough.
This predominant reliance on fossil fuels is not doing the transition to renewable energy any favors, but it shines a light on the massive untapped potential for alternative energies, especially in the developing world.
With the prices of renewable energy at record lows and increasing investment flows, the next decade will be a defining one for the global transition to clean energy.
Correction: A modified version of Brian Moore’s visualization was previous published here. We’ve since updated it to the original design.


Energy
Charted: 4 Reasons Why Lithium Could Be the Next Gold Rush
Visual Capitalist has partnered with EnergyX to show why drops in prices and growing demand may make now the right time to invest in lithium.


4 Reasons Why You Should Invest in Lithium
Lithium’s importance in powering EVs makes it a linchpin of the clean energy transition and one of the world’s most precious minerals.
In this graphic, Visual Capitalist partnered with EnergyX to explore why now may be the time to invest in lithium.
1. Lithium Prices Have Dropped
One of the most critical aspects of evaluating an investment is ensuring that the asset’s value is higher than its price would indicate. Lithium is integral to powering EVs, and, prices have fallen fast over the last year:
| Date | LiOH·H₂O* | Li₂CO₃** |
|---|---|---|
| Feb 2023 | $76 | $71 |
| March 2023 | $71 | $61 |
| Apr 2023 | $43 | $33 |
| May 2023 | $43 | $33 |
| June 2023 | $47 | $45 |
| July 2023 | $44 | $40 |
| Aug 2023 | $35 | $35 |
| Sept 2023 | $28 | $27 |
| Oct 2023 | $24 | $23 |
| Nov 2023 | $21 | $21 |
| Dec 2023 | $17 | $16 |
| Jan 2024 | $14 | $15 |
| Feb 2024 | $13 | $14 |
Note: Monthly spot prices were taken as close to the 14th of each month as possible.
*Lithium hydroxide monohydrate MB-LI-0033
**Lithium carbonate MB-LI-0029
2. Lithium-Ion Battery Prices Are Also Falling
The drop in lithium prices is just one reason to invest in the metal. Increasing economies of scale, coupled with low commodity prices, have caused the cost of lithium-ion batteries to drop significantly as well.
In fact, BNEF reports that between 2013 and 2023, the price of a Li-ion battery dropped by 82%.
| Year | Price per KWh |
|---|---|
| 2023 | $139 |
| 2022 | $161 |
| 2021 | $150 |
| 2020 | $160 |
| 2019 | $183 |
| 2018 | $211 |
| 2017 | $258 |
| 2016 | $345 |
| 2015 | $448 |
| 2014 | $692 |
| 2013 | $780 |

3. EV Adoption is Sustainable
One of the best reasons to invest in lithium is that EVs, one of the main drivers behind the demand for lithium, have reached a price point similar to that of traditional vehicle.
According to the Kelly Blue Book, Tesla’s average transaction price dropped by 25% between 2022 and 2023, bringing it in line with many other major manufacturers and showing that EVs are a realistic transport option from a consumer price perspective.
| Manufacturer | September 2022 | September 2023 |
|---|---|---|
| BMW | $69,000 | $72,000 |
| Ford | $54,000 | $56,000 |
| Volkswagon | $54,000 | $56,000 |
| General Motors | $52,000 | $53,000 |
| Tesla | $68,000 | $51,000 |
4. Electricity Demand in Transport is Growing
As EVs become an accessible transport option, there’s an investment opportunity in lithium. But possibly the best reason to invest in lithium is that the IEA reports global demand for the electricity in transport could grow dramatically by 2030:
| Transport Type | 2022 | 2025 | 2030 |
|---|---|---|---|
| Buses 🚌 | 23,000 GWh | 50,000 GWh | 130,000 GWh |
| Cars 🚙 | 65,000 GWh | 200,000 GWh | 570,000 GWh |
| Trucks 🛻 | 4,000 GWh | 15,000 GWh | 94,000 GWh |
| Vans 🚐 | 6,000 GWh | 16,000 GWh | 72,000 GWh |
The Lithium Investment Opportunity
Lithium presents a potentially classic investment opportunity. Lithium and battery prices have dropped significantly, and recently, EVs have reached a price point similar to other vehicles. By 2030, the demand for clean energy, especially in transport, will grow dramatically.
With prices dropping and demand skyrocketing, now is the time to invest in lithium.
EnergyX is poised to exploit lithium demand with cutting-edge lithium extraction technology capable of extracting 300% more lithium than current processes.

-

 Lithium2 days ago
Ranked: The Top 10 EV Battery Manufacturers in 2023
Asia dominates this ranking of the world’s largest EV battery manufacturers in 2023.
-

 Energy1 week ago
The World’s Biggest Nuclear Energy Producers
China has grown its nuclear capacity over the last decade, now ranking second on the list of top nuclear energy producers.
-

 Energy4 weeks ago
The World’s Biggest Oil Producers in 2023
Just three countries accounted for 40% of global oil production last year.
-

 Energy1 month ago
How Much Does the U.S. Depend on Russian Uranium?
Currently, Russia is the largest foreign supplier of nuclear power fuel to the U.S.
-

 Uranium2 months ago
Charted: Global Uranium Reserves, by Country
We visualize the distribution of the world’s uranium reserves by country, with 3 countries accounting for more than half of total reserves.
-

 Energy3 months ago
Visualizing the Rise of the U.S. as Top Crude Oil Producer
Over the last decade, the United States has established itself as the world’s top producer of crude oil, surpassing Saudi Arabia and Russia.


-

 Markets1 week ago
U.S. Debt Interest Payments Reach $1 Trillion
-

 Business2 weeks ago
Charted: Big Four Market Share by S&P 500 Audits
-

 Real Estate2 weeks ago
Ranked: The Most Valuable Housing Markets in America
-

 Money2 weeks ago
Which States Have the Highest Minimum Wage in America?
-

 AI2 weeks ago
Ranked: Semiconductor Companies by Industry Revenue Share
-

 Markets2 weeks ago
Ranked: The World’s Top Flight Routes, by Revenue
-

 Demographics2 weeks ago
Population Projections: The World’s 6 Largest Countries in 2075
-

 Markets2 weeks ago
The Top 10 States by Real GDP Growth in 2023