Markets
Discount Domination: Dollar Stores are Thriving in America
The retail landscape is in a constant state of flux.
E-commerce is indisputably disrupting almost every imaginable aspect of retail, creating what has been coined as the “retail apocalypse”. As a result, certain segments of the market have had well publicized meltdowns – electronics and apparel, in particular – and the U.S. now has far more retail floor space available than any other nation.
That said, there is one type of store that’s thriving in this unpredictable landscape – dollar stores. Today, we examine data from the Institute of Local Self-Reliance, which puts the scale of the United States’ dollar store boom into perspective.
Escaping the Retail Apocalypse
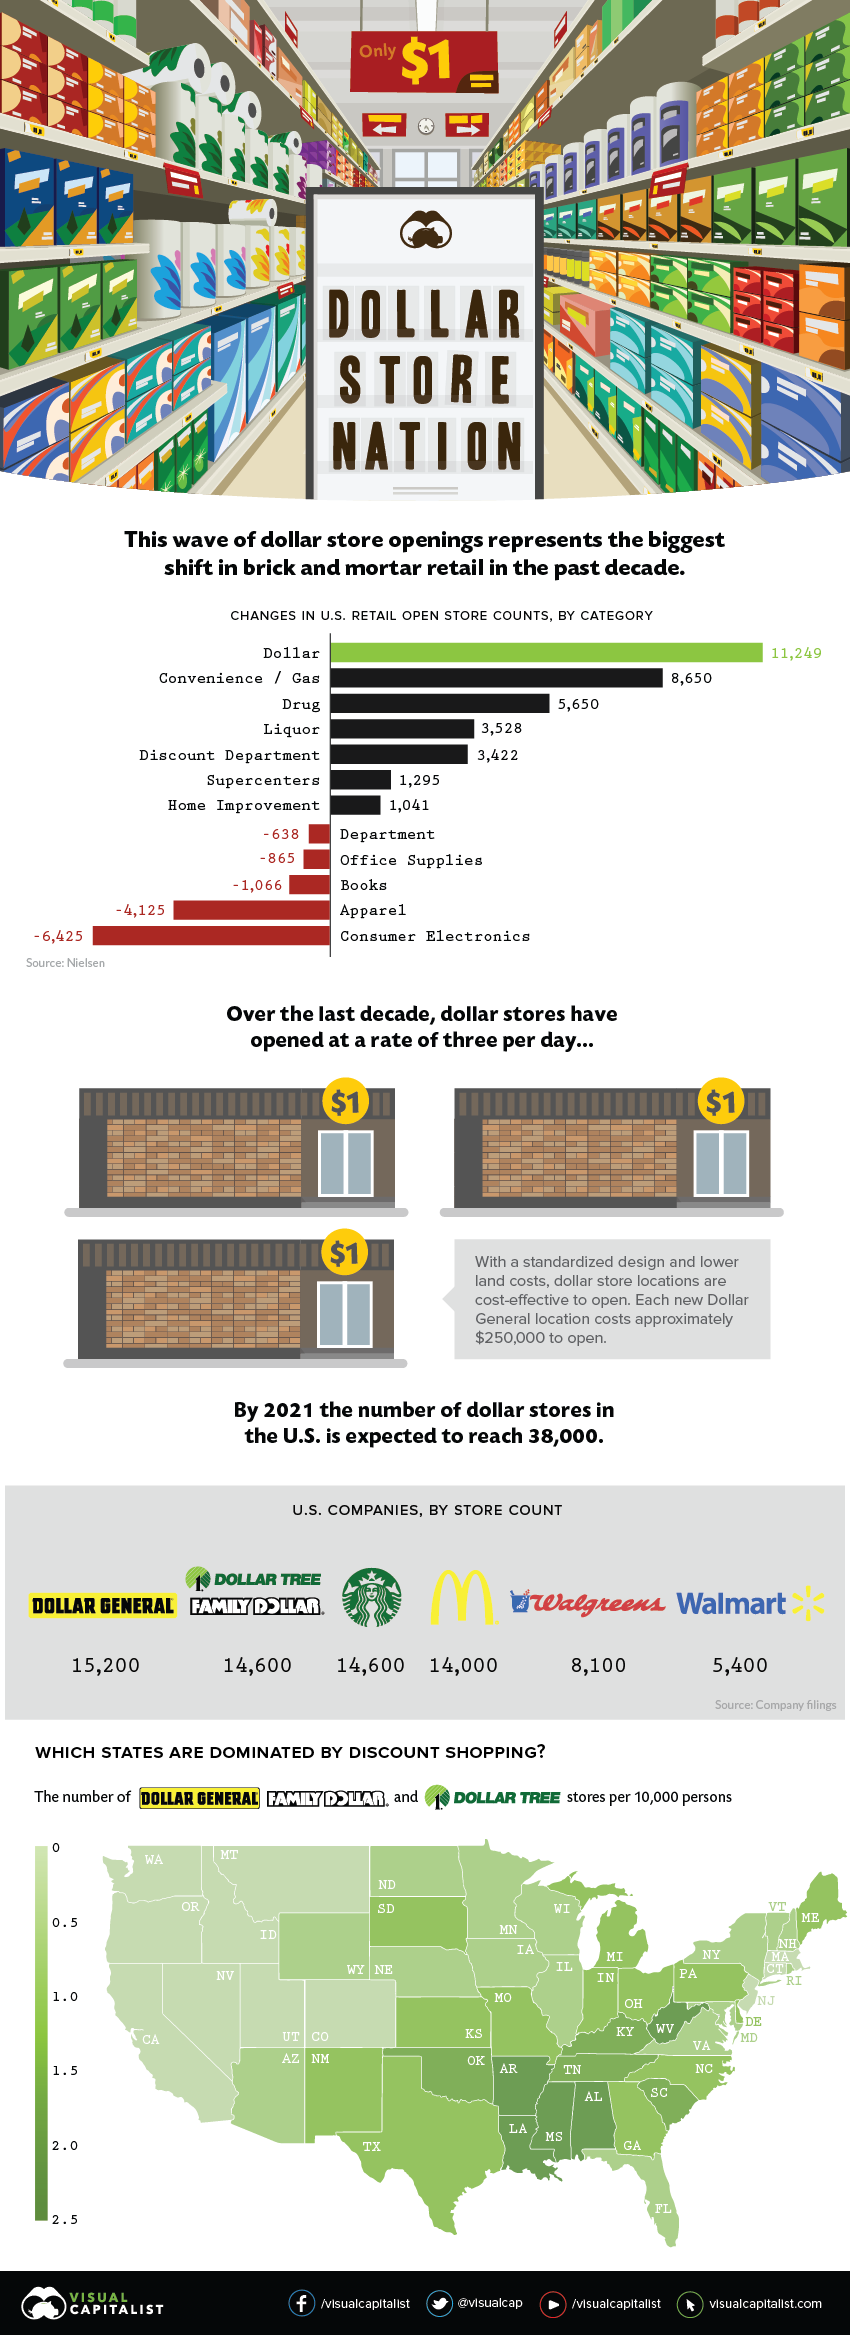
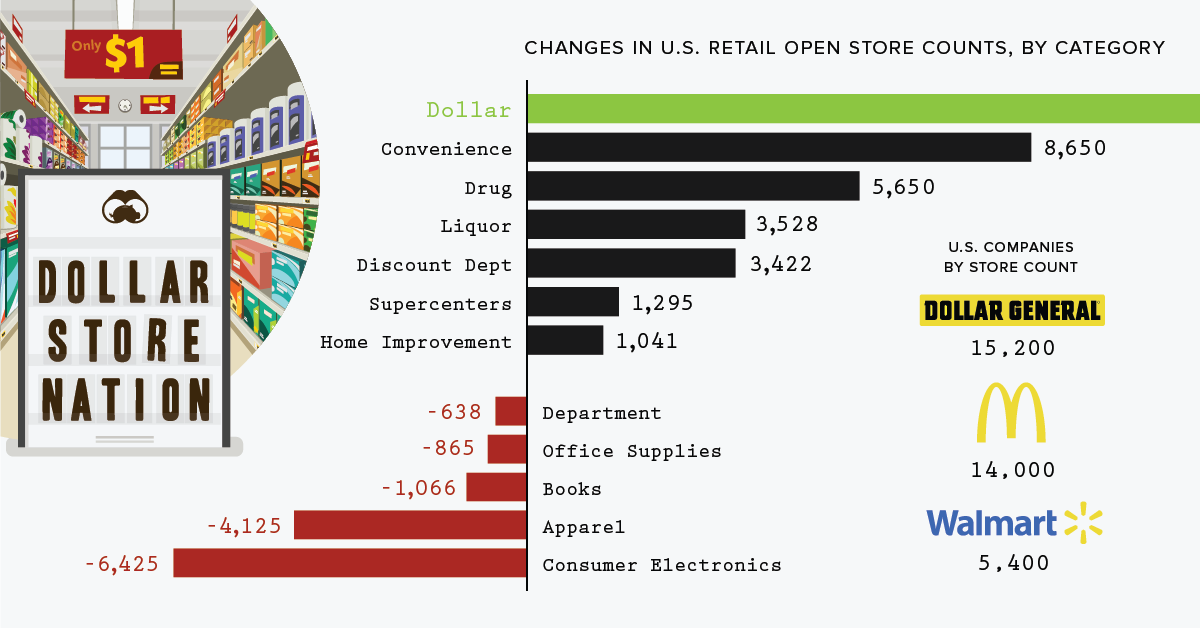
The rise of e-commerce giants like Amazon has led to a relentless wave of closures for brick and mortar retailers. Department stores and consumer electronics are taking hard hits, yet a curious trend emerges through the cracks – dollar stores are multiplying like rabbits.
The persistent growth of dollar stores is the biggest retail trend in the past decade. Between 2007 and 2017, over 11,000 new dollar stores were opened; that’s roughly 93 new stores a month, or three per day. Dollar General, in particular, is reaping the rewards: the company has a market cap of over $30 billion.
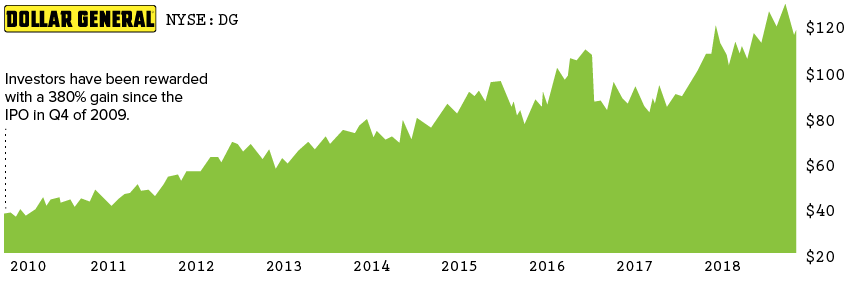
Compared to mammoth retailer Walmart, Dollar General is the little store that could. Despite reporting lower sales per square foot, Dollar General outperforms Walmart in 5-year gross profit margins.
| Store | Sales per square foot | 5-year gross profit margins | Cost of a new store |
|---|---|---|---|
| Dollar General | $184 | 30.9% | $250,000 |
| Walmart | $432 | 25.1% | $15,000,000 |
Sources: Bloomberg, E-Marketer
This whopping difference in launching a new location contributes to the fast and furious spread of dollar stores. Dollar General and Dollar Tree (which now owns Family Dollar) boast 30,000 stores between them, eclipsing the six biggest U.S. retailers combined. Their combined annual sales also rival Apple Stores, including iTunes.
The Dollar Store Strategy
What makes dollar stores so lucrative? In a nutshell, they’re willing to go where others won’t.
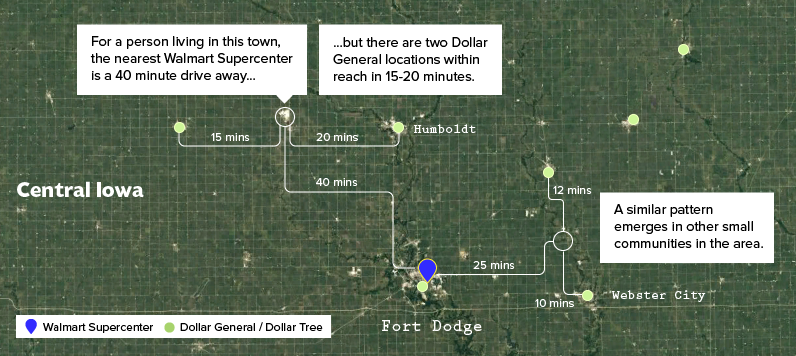
Dollar General focuses on rural areas, while Dollar Tree and Family Dollar are more prominent in urban and suburban areas. But they have one thing in common – all three chains target small towns in rural America, resulting in a high concentration per capita, especially in the South.
Wal-Mart’s 40 miles away and we can meet those people’s needs.
– David Perdue, Former CEO of Dollar General
Dollar General’s ambitious expansion into smaller towns has proven successful. Residents can find many everyday products at prices similar to those at Walmart, but without the longer drive to a Supercenter. Despite the 3,500 Walmart Supercenters spread out across the country, chances are, there’s a dollar store even closer.
Dollar stores fill a need in cash-strapped communities, saving time and gas money during a trip to the store, and then offering an affordable and enticing products inside the store itself.
America’s Grocery Gap
The no-frills shopping experience is also a quintessential trait of dollar stores. Dollar stores focus on a limited selection of private label goods, selling basics in small quantities instead of bulk.
However, there’s also a dark underbelly to this trend. Dollar stores often enter areas with no grocery stores at all, called food deserts. In the absence of choice, dollar stores are welcomed with open arms – but the lack of fresh produce and abundance of processed, packaged foods leave much to be desired.
If you live in Whole Foods-land – not the dollar store world – it’s an invisible reality that they’re supplying a lot of the groceries.
— Stacy Mitchell, Institute for Local Self-Reliance
On the other hand, when dollar stores compete with locally-owned grocery stores in the same area, sales in the latter can be cut by over 30% in some cases – taking an enormous toll on the community.
The ILSR report suggests that dollar stores may not always be a by-product of economic distress, but a cause of it. Regardless of what perspective you have on the spread of dollar stores, it’s clear they’re here to stay.


Markets
U.S. Debt Interest Payments Reach $1 Trillion
U.S. debt interest payments have surged past the $1 trillion dollar mark, amid high interest rates and an ever-expanding debt burden.


U.S. Debt Interest Payments Reach $1 Trillion
This was originally posted on our Voronoi app. Download the app for free on iOS or Android and discover incredible data-driven charts from a variety of trusted sources.
The cost of paying for America’s national debt crossed the $1 trillion dollar mark in 2023, driven by high interest rates and a record $34 trillion mountain of debt.
Over the last decade, U.S. debt interest payments have more than doubled amid vast government spending during the pandemic crisis. As debt payments continue to soar, the Congressional Budget Office (CBO) reported that debt servicing costs surpassed defense spending for the first time ever this year.
This graphic shows the sharp rise in U.S. debt payments, based on data from the Federal Reserve.
A $1 Trillion Interest Bill, and Growing
Below, we show how U.S. debt interest payments have risen at a faster pace than at another time in modern history:
| Date | Interest Payments | U.S. National Debt |
|---|---|---|
| 2023 | $1.0T | $34.0T |
| 2022 | $830B | $31.4T |
| 2021 | $612B | $29.6T |
| 2020 | $518B | $27.7T |
| 2019 | $564B | $23.2T |
| 2018 | $571B | $22.0T |
| 2017 | $493B | $20.5T |
| 2016 | $460B | $20.0T |
| 2015 | $435B | $18.9T |
| 2014 | $442B | $18.1T |
| 2013 | $425B | $17.2T |
| 2012 | $417B | $16.4T |
| 2011 | $433B | $15.2T |
| 2010 | $400B | $14.0T |
| 2009 | $354B | $12.3T |
| 2008 | $380B | $10.7T |
| 2007 | $414B | $9.2T |
| 2006 | $387B | $8.7T |
| 2005 | $355B | $8.2T |
| 2004 | $318B | $7.6T |
| 2003 | $294B | $7.0T |
| 2002 | $298B | $6.4T |
| 2001 | $318B | $5.9T |
| 2000 | $353B | $5.7T |
| 1999 | $353B | $5.8T |
| 1998 | $360B | $5.6T |
| 1997 | $368B | $5.5T |
| 1996 | $362B | $5.3T |
| 1995 | $357B | $5.0T |
| 1994 | $334B | $4.8T |
| 1993 | $311B | $4.5T |
| 1992 | $306B | $4.2T |
| 1991 | $308B | $3.8T |
| 1990 | $298B | $3.4T |
| 1989 | $275B | $3.0T |
| 1988 | $254B | $2.7T |
| 1987 | $240B | $2.4T |
| 1986 | $225B | $2.2T |
| 1985 | $219B | $1.9T |
| 1984 | $205B | $1.7T |
| 1983 | $176B | $1.4T |
| 1982 | $157B | $1.2T |
| 1981 | $142B | $1.0T |
| 1980 | $113B | $930.2B |
| 1979 | $96B | $845.1B |
| 1978 | $84B | $789.2B |
| 1977 | $69B | $718.9B |
| 1976 | $61B | $653.5B |
| 1975 | $55B | $576.6B |
| 1974 | $50B | $492.7B |
| 1973 | $45B | $469.1B |
| 1972 | $39B | $448.5B |
| 1971 | $36B | $424.1B |
| 1970 | $35B | $389.2B |
| 1969 | $30B | $368.2B |
| 1968 | $25B | $358.0B |
| 1967 | $23B | $344.7B |
| 1966 | $21B | $329.3B |
Interest payments represent seasonally adjusted annual rate at the end of Q4.
At current rates, the U.S. national debt is growing by a remarkable $1 trillion about every 100 days, equal to roughly $3.6 trillion per year.
As the national debt has ballooned, debt payments even exceeded Medicaid outlays in 2023—one of the government’s largest expenditures. On average, the U.S. spent more than $2 billion per day on interest costs last year. Going further, the U.S. government is projected to spend a historic $12.4 trillion on interest payments over the next decade, averaging about $37,100 per American.
Exacerbating matters is that the U.S. is running a steep deficit, which stood at $1.1 trillion for the first six months of fiscal 2024. This has accelerated due to the 43% increase in debt servicing costs along with a $31 billion dollar increase in defense spending from a year earlier. Additionally, a $30 billion increase in funding for the Federal Deposit Insurance Corporation in light of the regional banking crisis last year was a major contributor to the deficit increase.
Overall, the CBO forecasts that roughly 75% of the federal deficit’s increase will be due to interest costs by 2034.

-

 Real Estate2 weeks ago
Visualizing America’s Shortage of Affordable Homes
-

 Technology1 week ago
Ranked: Semiconductor Companies by Industry Revenue Share
-

 Money1 week ago
Which States Have the Highest Minimum Wage in America?
-

 Real Estate1 week ago
Ranked: The Most Valuable Housing Markets in America
-

 Business1 week ago
Charted: Big Four Market Share by S&P 500 Audits
-

 AI1 week ago
The Stock Performance of U.S. Chipmakers So Far in 2024
-

 Misc2 weeks ago
Almost Every EV Stock is Down After Q1 2024
-

 Money2 weeks ago
Where Does One U.S. Tax Dollar Go?