Markets
Uncovering Income: Dividend Stocks With Strong Yields


Uncovering Income: Dividend Stocks with Strong Yields
Amid the current market volatility, attractive income-generating investments can be hard to find.
Treasury bond yields hover near record lows, and U.S. companies face restrictions on issuing dividends if they accept COVID-19 stimulus funds. Moreover, Goldman Sachs estimates dividends for S&P 500 stocks will decline by 25% this year.
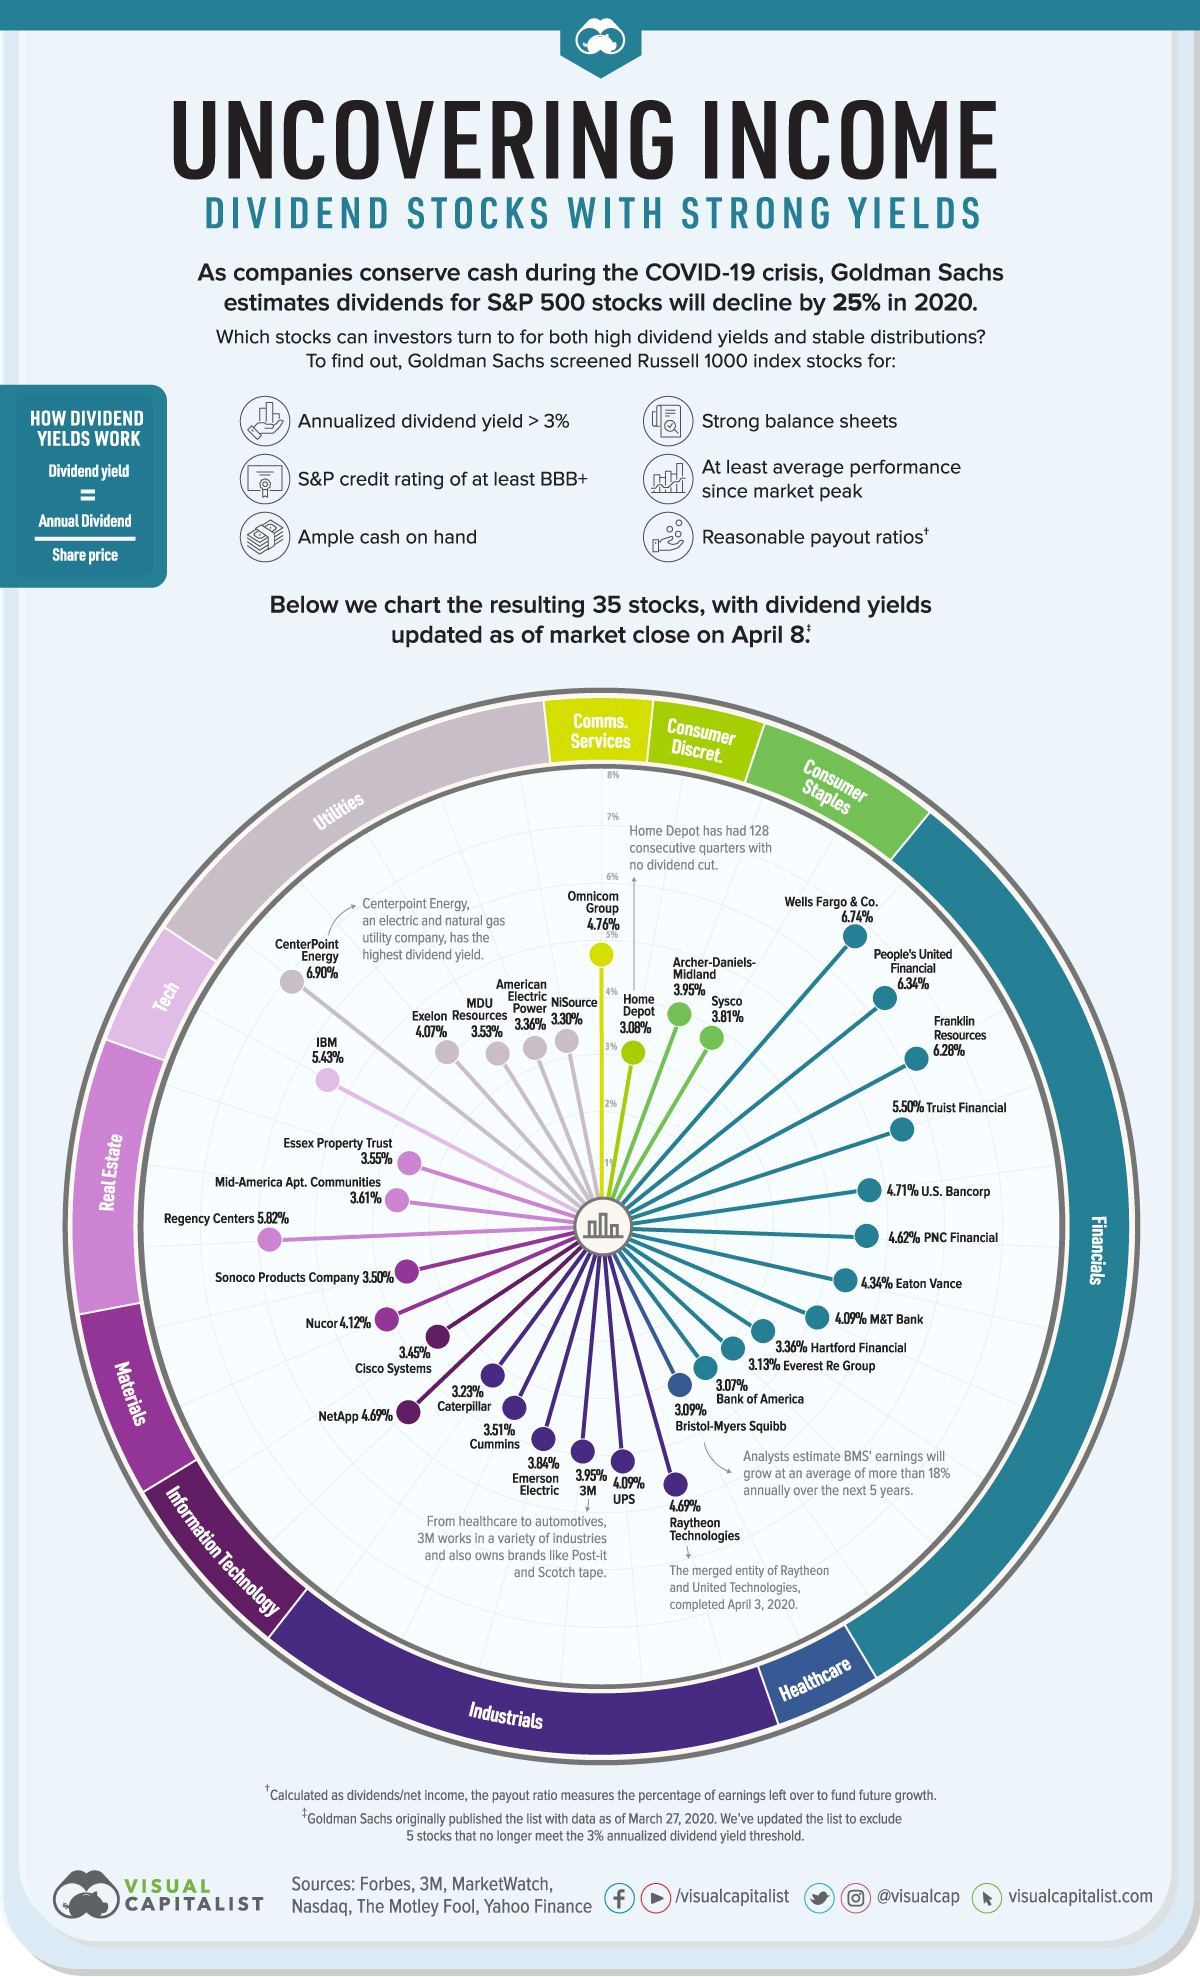
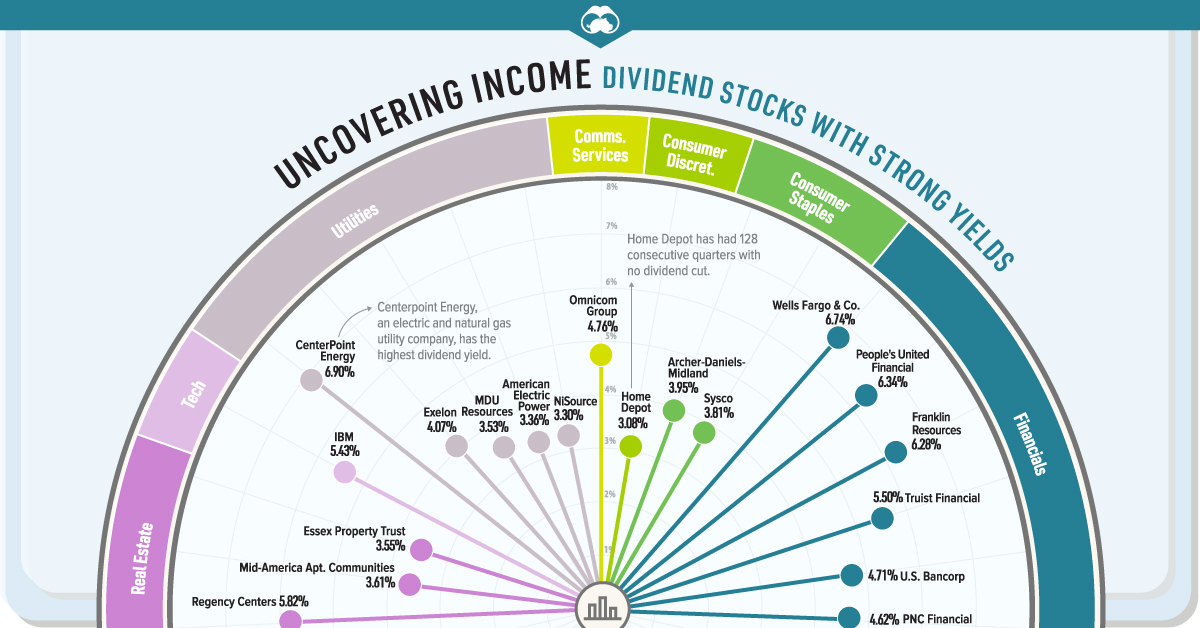
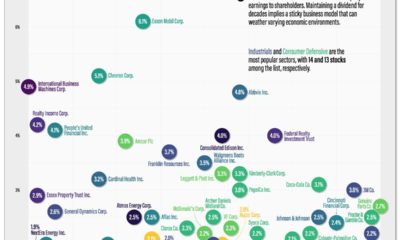
Which stocks can investors turn to for stable distributions and relatively high dividend yields? Today’s visualization shows 35 stocks that may meet this criteria, leveraging Goldman Sachs data as published by Forbes.
The Dividend Stocks to Watch
To compile the list, Goldman Sachs identified stocks from the Russell 1000 index that met a number of requirements:
- A minimum annualized dividend yield of 3%
- An S&P credit rating of at least BBB+
- Ample cash on hand
- Strong balance sheets
- ”Reasonable” payout ratios
- At least average performance since the market peak
Dividend yields, which measure dividend income in relation to the share price, were initially calculated March 27. We have updated them as of market close on April 8. Here’s the full breakdown, sorted from highest to lowest dividend yield:
| Rank | Company | Ticker | Annual Dividend Yield | Sector |
|---|---|---|---|---|
| 1 | CenterPoint Energy, Inc. | NYSE: CNP | 6.90% | Utilities |
| 2 | Wells Fargo & Company | NYSE: WFC | 6.74% | Financials |
| 3 | People's United Financial, Inc. | NASDAQGS: PBCT | 6.34% | Financials |
| 4 | Franklin Resources, Inc. | NYSE: BEN | 6.28% | Financials |
| 5 | Regency Centers | NASDAQGS: REG | 5.82% | Real estate |
| 6 | Truist Financial | NYSE: TFC | 5.50% | Financials |
| 7 | International Business Machines | NYSE: IBM | 5.43% | Tech |
| 8 | Omnicom Group Inc. | NYSE: OMC | 4.76% | Communication services |
| 9 | U.S. Bancorp | NYSE: USB | 4.71% | Financials |
| 10 | Raytheon Technologies (merger of Raytheon and United Tech.) | NYSE: RTX | 4.69% | Industrials |
| 11 | NetApp, Inc. | NASDAQGS: NTAP | 4.69% | Information Technology |
| 12 | The PNC Financial Services Group, Inc. | NYSE: PNC | 4.62% | Financials |
| 13 | Eaton Vance Corp. | NYSE: EV | 4.34% | Financials |
| 14 | Nucor Corporation | NYSE: NUE | 4.12% | Materials |
| 15 | United Parcel Service, Inc. | NYSE: UPS | 4.09% | Industrials |
| 16 | M&T Bank Corporation | NYSE: MTB | 4.09% | Financials |
| 17 | Exelon Corporation | NASDAQGS: EXC | 4.07% | Utilities |
| 18 | Archer-Daniels-Midland Company | NYSE: ADM | 3.95% | Consumer staples |
| 19 | 3M Company | NYSE: MMM | 3.95% | Industrials |
| 20 | Emerson Electric Co. | NYSE: EMR | 3.84% | Industrials |
| 21 | Sysco Corp. | NYSE: SYY | 3.81% | Consumer staples |
| 22 | Mid-America Apartment Communities | NYSE: MAA | 3.61% | Real Estate |
| 23 | Essex Property Trust, Inc. | NYSE: ESS | 3.55% | Real Estate |
| 24 | MDU Resources Group | NYSE: MDU | 3.53% | Utilities |
| 25 | Cummins Inc. | NYSE: CMI | 3.51% | Industrials |
| 26 | Sonoco Products Co. | NYSE: SON | 3.50% | Materials |
| 27 | Cisco Systems, Inc. | NASDAQGS: CSCO | 3.45% | Information Technology |
| 28 | American Electric Power Company, Inc. | NYSE: AEP | 3.36% | Utilities |
| 29 | The Hartford Financial Services Group, Inc. | NYSE: HIG | 3.36% | Financials |
| 30 | NiSource Inc. | NYSE: NI | 3.30% | Utilities |
| 31 | Caterpillar Inc. | NYSE: CAT | 3.23% | Industrials |
| 32 | Everest Re Group, Ltd. | NYSE: RE | 3.13% | Financials |
| 33 | Bristol-Myers Squibb Company | NYSE: BMY | 3.09% | Health care, pharmaceuticals |
| 34 | The Home Depot, Inc. | NYSE: HD | 3.08% | Consumer discretionary |
| 35 | Bank of America Corporation | NYSE: BAC | 3.07% | Financials |
Note: From the original list, 5 stocks have been excluded as they no longer meet the 3% annualized yield threshold.
Centerpoint Energy, an electric and natural gas utility company, is at the top of the list. Since utility stocks are generally considered to be recession-resistant, investors may benefit from both the company’s yield and its defensive qualities.
Financials are the most-represented sector, with 11 companies on the list. Although regulators have pressured European banks to suspend dividend payments, U.S. banks will likely be able to continue their distributions. Top banking executives have argued they have sufficient capital to weather the COVID-19 crisis, and that halting payments would be “destabilizing to investors.”
There are also a number of well-known names on the list, including Home Depot, IBM, and 3M. The latter is the largest maker of respirator masks worldwide, and has been providing critical supplies to the U.S., Canada, and Latin America.
Caution: Volatility Ahead
As the pandemic’s financial impact continues, it’s likely many companies will delay or suspend their dividends. To avoid falling into “yield traps”—a trap in which an attractive yield could be due to a fundamental business problem—investors can screen for the qualities laid out above.
A strong balance sheet, good credit rating, and average or better performance since the downturn can all help point towards stability.


Markets
U.S. Debt Interest Payments Reach $1 Trillion
U.S. debt interest payments have surged past the $1 trillion dollar mark, amid high interest rates and an ever-expanding debt burden.


U.S. Debt Interest Payments Reach $1 Trillion
This was originally posted on our Voronoi app. Download the app for free on iOS or Android and discover incredible data-driven charts from a variety of trusted sources.
The cost of paying for America’s national debt crossed the $1 trillion dollar mark in 2023, driven by high interest rates and a record $34 trillion mountain of debt.
Over the last decade, U.S. debt interest payments have more than doubled amid vast government spending during the pandemic crisis. As debt payments continue to soar, the Congressional Budget Office (CBO) reported that debt servicing costs surpassed defense spending for the first time ever this year.
This graphic shows the sharp rise in U.S. debt payments, based on data from the Federal Reserve.
A $1 Trillion Interest Bill, and Growing
Below, we show how U.S. debt interest payments have risen at a faster pace than at another time in modern history:
| Date | Interest Payments | U.S. National Debt |
|---|---|---|
| 2023 | $1.0T | $34.0T |
| 2022 | $830B | $31.4T |
| 2021 | $612B | $29.6T |
| 2020 | $518B | $27.7T |
| 2019 | $564B | $23.2T |
| 2018 | $571B | $22.0T |
| 2017 | $493B | $20.5T |
| 2016 | $460B | $20.0T |
| 2015 | $435B | $18.9T |
| 2014 | $442B | $18.1T |
| 2013 | $425B | $17.2T |
| 2012 | $417B | $16.4T |
| 2011 | $433B | $15.2T |
| 2010 | $400B | $14.0T |
| 2009 | $354B | $12.3T |
| 2008 | $380B | $10.7T |
| 2007 | $414B | $9.2T |
| 2006 | $387B | $8.7T |
| 2005 | $355B | $8.2T |
| 2004 | $318B | $7.6T |
| 2003 | $294B | $7.0T |
| 2002 | $298B | $6.4T |
| 2001 | $318B | $5.9T |
| 2000 | $353B | $5.7T |
| 1999 | $353B | $5.8T |
| 1998 | $360B | $5.6T |
| 1997 | $368B | $5.5T |
| 1996 | $362B | $5.3T |
| 1995 | $357B | $5.0T |
| 1994 | $334B | $4.8T |
| 1993 | $311B | $4.5T |
| 1992 | $306B | $4.2T |
| 1991 | $308B | $3.8T |
| 1990 | $298B | $3.4T |
| 1989 | $275B | $3.0T |
| 1988 | $254B | $2.7T |
| 1987 | $240B | $2.4T |
| 1986 | $225B | $2.2T |
| 1985 | $219B | $1.9T |
| 1984 | $205B | $1.7T |
| 1983 | $176B | $1.4T |
| 1982 | $157B | $1.2T |
| 1981 | $142B | $1.0T |
| 1980 | $113B | $930.2B |
| 1979 | $96B | $845.1B |
| 1978 | $84B | $789.2B |
| 1977 | $69B | $718.9B |
| 1976 | $61B | $653.5B |
| 1975 | $55B | $576.6B |
| 1974 | $50B | $492.7B |
| 1973 | $45B | $469.1B |
| 1972 | $39B | $448.5B |
| 1971 | $36B | $424.1B |
| 1970 | $35B | $389.2B |
| 1969 | $30B | $368.2B |
| 1968 | $25B | $358.0B |
| 1967 | $23B | $344.7B |
| 1966 | $21B | $329.3B |
Interest payments represent seasonally adjusted annual rate at the end of Q4.
At current rates, the U.S. national debt is growing by a remarkable $1 trillion about every 100 days, equal to roughly $3.6 trillion per year.
As the national debt has ballooned, debt payments even exceeded Medicaid outlays in 2023—one of the government’s largest expenditures. On average, the U.S. spent more than $2 billion per day on interest costs last year. Going further, the U.S. government is projected to spend a historic $12.4 trillion on interest payments over the next decade, averaging about $37,100 per American.
Exacerbating matters is that the U.S. is running a steep deficit, which stood at $1.1 trillion for the first six months of fiscal 2024. This has accelerated due to the 43% increase in debt servicing costs along with a $31 billion dollar increase in defense spending from a year earlier. Additionally, a $30 billion increase in funding for the Federal Deposit Insurance Corporation in light of the regional banking crisis last year was a major contributor to the deficit increase.
Overall, the CBO forecasts that roughly 75% of the federal deficit’s increase will be due to interest costs by 2034.

-

 Maps2 weeks ago
Mapped: Average Wages Across Europe
-

 Money1 week ago
Which States Have the Highest Minimum Wage in America?
-

 Real Estate1 week ago
Ranked: The Most Valuable Housing Markets in America
-

 Markets1 week ago
Charted: Big Four Market Share by S&P 500 Audits
-

 AI1 week ago
The Stock Performance of U.S. Chipmakers So Far in 2024
-

 Automotive2 weeks ago
Almost Every EV Stock is Down After Q1 2024
-

 Money2 weeks ago
Where Does One U.S. Tax Dollar Go?
-

 Green2 weeks ago
Ranked: Top Countries by Total Forest Loss Since 2001