Markets
Uncovering Income: Dividend Stocks With Strong Yields
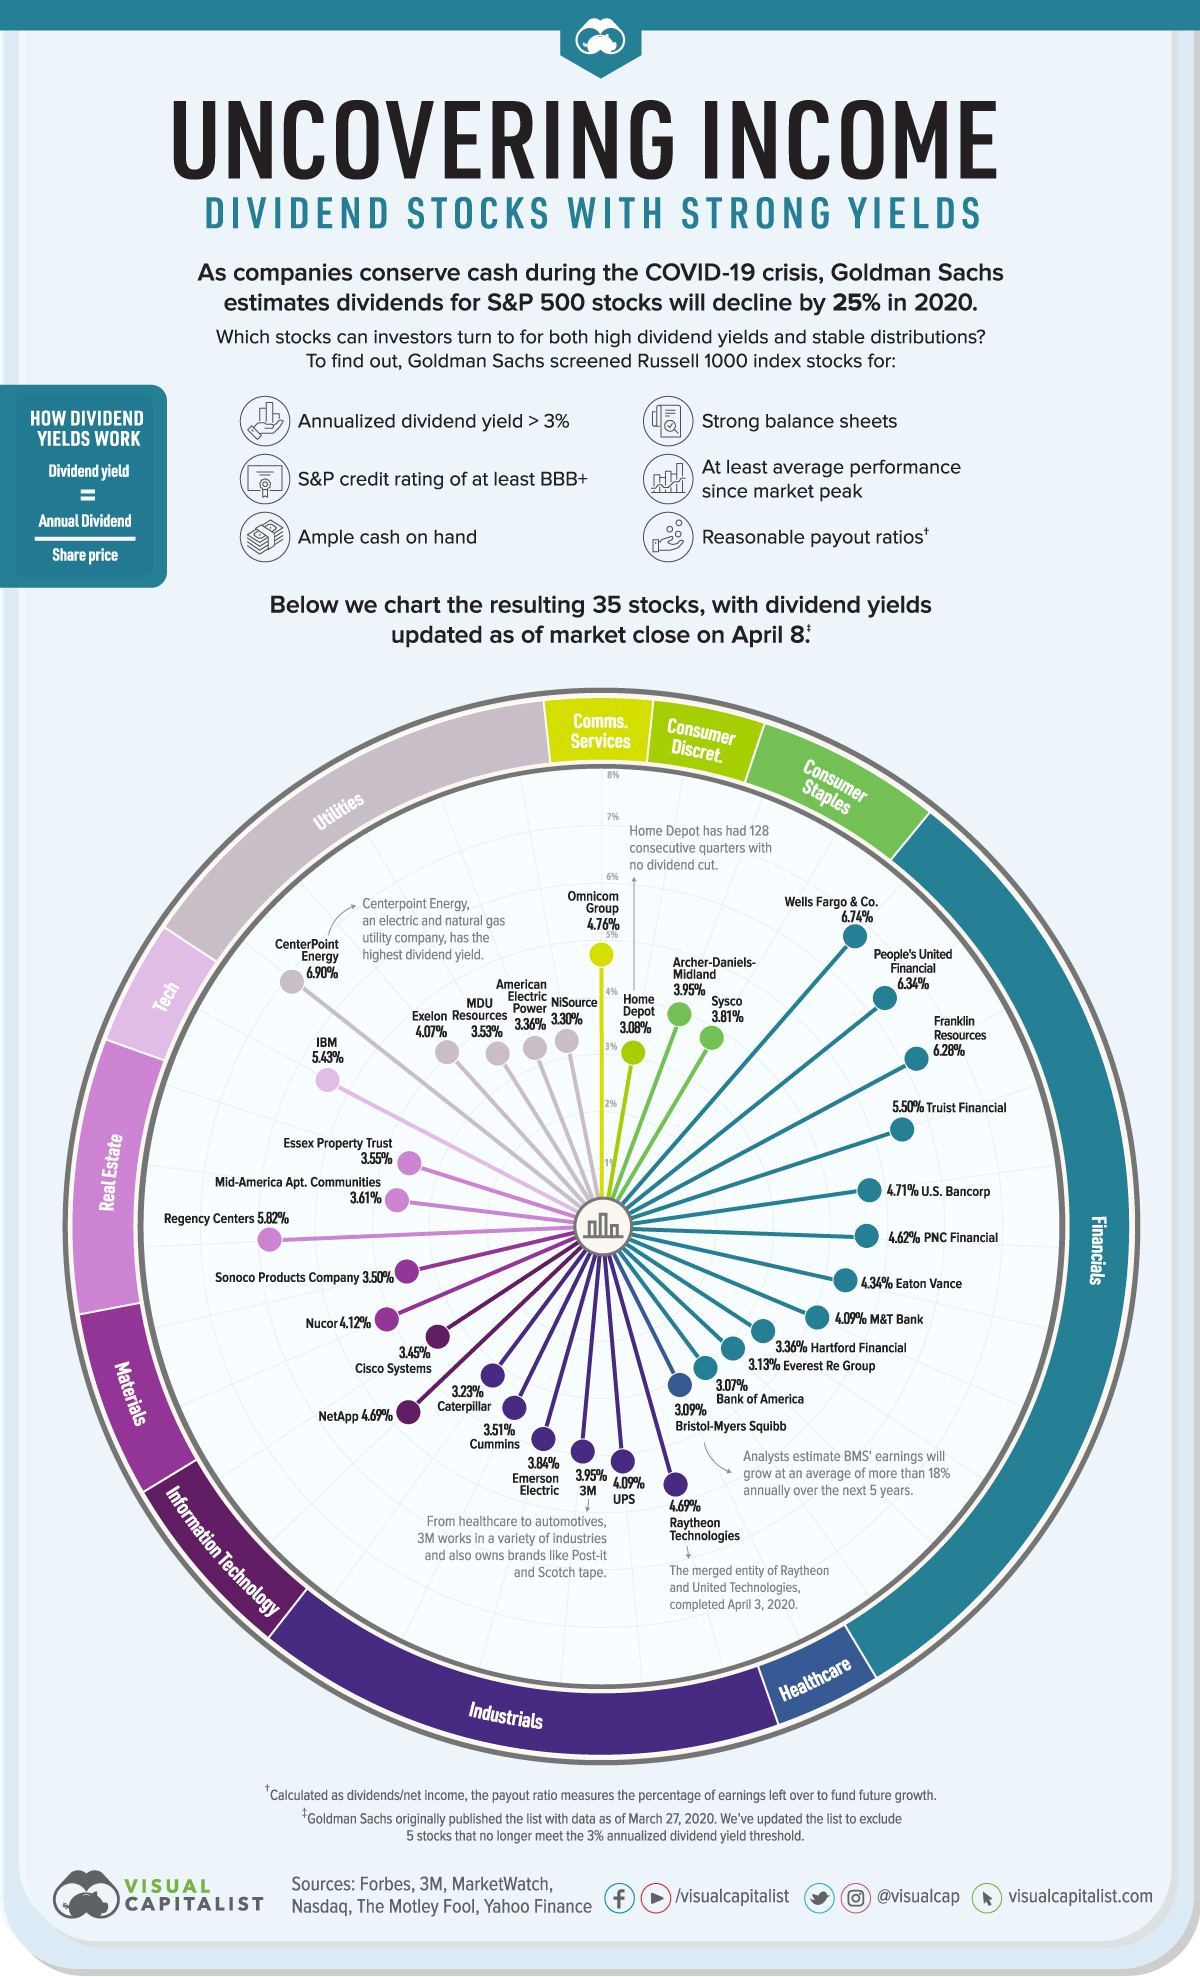


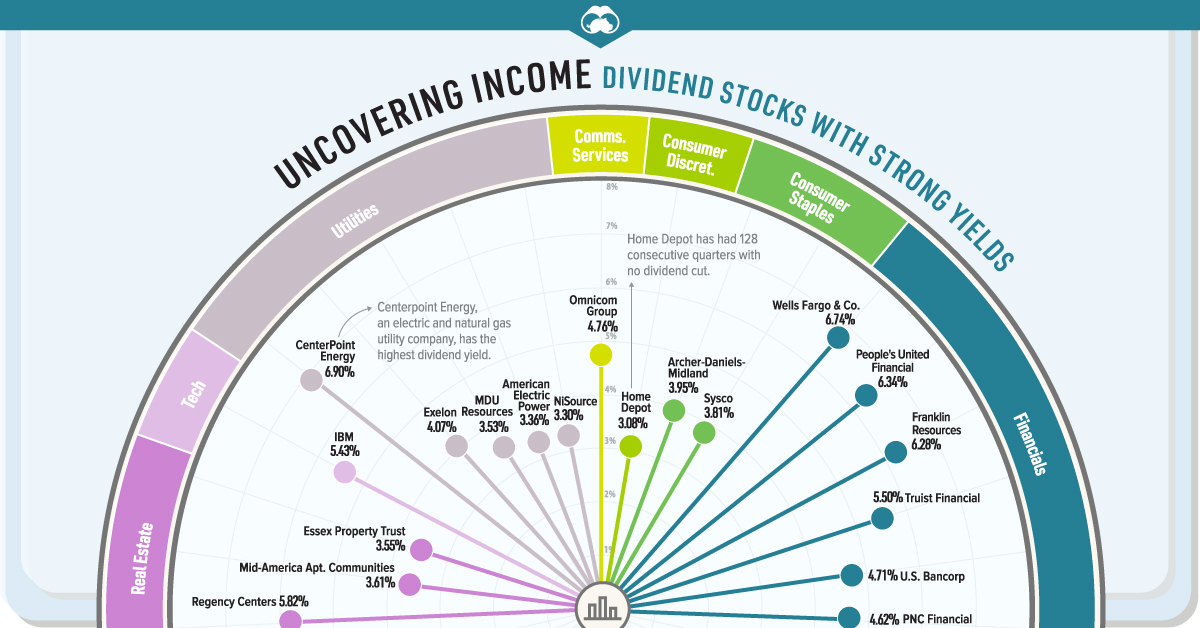
Uncovering Income: Dividend Stocks with Strong Yields
Amid the current market volatility, attractive income-generating investments can be hard to find.
Treasury bond yields hover near record lows, and U.S. companies face restrictions on issuing dividends if they accept COVID-19 stimulus funds. Moreover, Goldman Sachs estimates dividends for S&P 500 stocks will decline by 25% this year.
Which stocks can investors turn to for stable distributions and relatively high dividend yields? Today’s visualization shows 35 stocks that may meet this criteria, leveraging Goldman Sachs data as published by Forbes.
The Dividend Stocks to Watch
To compile the list, Goldman Sachs identified stocks from the Russell 1000 index that met a number of requirements:
- A minimum annualized dividend yield of 3%
- An S&P credit rating of at least BBB+
- Ample cash on hand
- Strong balance sheets
- ”Reasonable” payout ratios
- At least average performance since the market peak
Dividend yields, which measure dividend income in relation to the share price, were initially calculated March 27. We have updated them as of market close on April 8. Here’s the full breakdown, sorted from highest to lowest dividend yield:
| Rank | Company | Ticker | Annual Dividend Yield | Sector |
|---|---|---|---|---|
| 1 | CenterPoint Energy, Inc. | NYSE: CNP | 6.90% | Utilities |
| 2 | Wells Fargo & Company | NYSE: WFC | 6.74% | Financials |
| 3 | People's United Financial, Inc. | NASDAQGS: PBCT | 6.34% | Financials |
| 4 | Franklin Resources, Inc. | NYSE: BEN | 6.28% | Financials |
| 5 | Regency Centers | NASDAQGS: REG | 5.82% | Real estate |
| 6 | Truist Financial | NYSE: TFC | 5.50% | Financials |
| 7 | International Business Machines | NYSE: IBM | 5.43% | Tech |
| 8 | Omnicom Group Inc. | NYSE: OMC | 4.76% | Communication services |
| 9 | U.S. Bancorp | NYSE: USB | 4.71% | Financials |
| 10 | Raytheon Technologies (merger of Raytheon and United Tech.) | NYSE: RTX | 4.69% | Industrials |
| 11 | NetApp, Inc. | NASDAQGS: NTAP | 4.69% | Information Technology |
| 12 | The PNC Financial Services Group, Inc. | NYSE: PNC | 4.62% | Financials |
| 13 | Eaton Vance Corp. | NYSE: EV | 4.34% | Financials |
| 14 | Nucor Corporation | NYSE: NUE | 4.12% | Materials |
| 15 | United Parcel Service, Inc. | NYSE: UPS | 4.09% | Industrials |
| 16 | M&T Bank Corporation | NYSE: MTB | 4.09% | Financials |
| 17 | Exelon Corporation | NASDAQGS: EXC | 4.07% | Utilities |
| 18 | Archer-Daniels-Midland Company | NYSE: ADM | 3.95% | Consumer staples |
| 19 | 3M Company | NYSE: MMM | 3.95% | Industrials |
| 20 | Emerson Electric Co. | NYSE: EMR | 3.84% | Industrials |
| 21 | Sysco Corp. | NYSE: SYY | 3.81% | Consumer staples |
| 22 | Mid-America Apartment Communities | NYSE: MAA | 3.61% | Real Estate |
| 23 | Essex Property Trust, Inc. | NYSE: ESS | 3.55% | Real Estate |
| 24 | MDU Resources Group | NYSE: MDU | 3.53% | Utilities |
| 25 | Cummins Inc. | NYSE: CMI | 3.51% | Industrials |
| 26 | Sonoco Products Co. | NYSE: SON | 3.50% | Materials |
| 27 | Cisco Systems, Inc. | NASDAQGS: CSCO | 3.45% | Information Technology |
| 28 | American Electric Power Company, Inc. | NYSE: AEP | 3.36% | Utilities |
| 29 | The Hartford Financial Services Group, Inc. | NYSE: HIG | 3.36% | Financials |
| 30 | NiSource Inc. | NYSE: NI | 3.30% | Utilities |
| 31 | Caterpillar Inc. | NYSE: CAT | 3.23% | Industrials |
| 32 | Everest Re Group, Ltd. | NYSE: RE | 3.13% | Financials |
| 33 | Bristol-Myers Squibb Company | NYSE: BMY | 3.09% | Health care, pharmaceuticals |
| 34 | The Home Depot, Inc. | NYSE: HD | 3.08% | Consumer discretionary |
| 35 | Bank of America Corporation | NYSE: BAC | 3.07% | Financials |
Note: From the original list, 5 stocks have been excluded as they no longer meet the 3% annualized yield threshold.
Centerpoint Energy, an electric and natural gas utility company, is at the top of the list. Since utility stocks are generally considered to be recession-resistant, investors may benefit from both the company’s yield and its defensive qualities.
Financials are the most-represented sector, with 11 companies on the list. Although regulators have pressured European banks to suspend dividend payments, U.S. banks will likely be able to continue their distributions. Top banking executives have argued they have sufficient capital to weather the COVID-19 crisis, and that halting payments would be “destabilizing to investors.”
There are also a number of well-known names on the list, including Home Depot, IBM, and 3M. The latter is the largest maker of respirator masks worldwide, and has been providing critical supplies to the U.S., Canada, and Latin America.
Caution: Volatility Ahead
As the pandemic’s financial impact continues, it’s likely many companies will delay or suspend their dividends. To avoid falling into “yield traps”—a trap in which an attractive yield could be due to a fundamental business problem—investors can screen for the qualities laid out above.
A strong balance sheet, good credit rating, and average or better performance since the downturn can all help point towards stability.


Markets
The European Stock Market: Attractive Valuations Offer Opportunities
On average, the European stock market has valuations that are nearly 50% lower than U.S. valuations. But how can you access the market?


European Stock Market: Attractive Valuations Offer Opportunities
Europe is known for some established brands, from L’Oréal to Louis Vuitton. However, the European stock market offers additional opportunities that may be lesser known.
The above infographic, sponsored by STOXX, outlines why investors may want to consider European stocks.
Attractive Valuations
Compared to most North American and Asian markets, European stocks offer lower or comparable valuations.
| Index | Price-to-Earnings Ratio | Price-to-Book Ratio |
|---|---|---|
| EURO STOXX 50 | 14.9 | 2.2 |
| STOXX Europe 600 | 14.4 | 2 |
| U.S. | 25.9 | 4.7 |
| Canada | 16.1 | 1.8 |
| Japan | 15.4 | 1.6 |
| Asia Pacific ex. China | 17.1 | 1.8 |
Data as of February 29, 2024. See graphic for full index names. Ratios based on trailing 12 month financials. The price to earnings ratio excludes companies with negative earnings.
On average, European valuations are nearly 50% lower than U.S. valuations, potentially offering an affordable entry point for investors.
Research also shows that lower price ratios have historically led to higher long-term returns.
Market Movements Not Closely Connected
Over the last decade, the European stock market had low-to-moderate correlation with North American and Asian equities.
The below chart shows correlations from February 2014 to February 2024. A value closer to zero indicates low correlation, while a value of one would indicate that two regions are moving in perfect unison.
| EURO STOXX 50 | STOXX EUROPE 600 | U.S. | Canada | Japan | Asia Pacific ex. China |
|
|---|---|---|---|---|---|---|
| EURO STOXX 50 | 1.00 | 0.97 | 0.55 | 0.67 | 0.24 | 0.43 |
| STOXX EUROPE 600 | 1.00 | 0.56 | 0.71 | 0.28 | 0.48 | |
| U.S. | 1.00 | 0.73 | 0.12 | 0.25 | ||
| Canada | 1.00 | 0.22 | 0.40 | |||
| Japan | 1.00 | 0.88 | ||||
| Asia Pacific ex. China | 1.00 |
Data is based on daily USD returns.
European equities had relatively independent market movements from North American and Asian markets. One contributing factor could be the differing sector weights in each market. For instance, technology makes up a quarter of the U.S. market, but health care and industrials dominate the broader European market.
Ultimately, European equities can enhance portfolio diversification and have the potential to mitigate risk for investors.
Tracking the Market
For investors interested in European equities, STOXX offers a variety of flagship indices:
| Index | Description | Market Cap |
|---|---|---|
| STOXX Europe 600 | Pan-regional, broad market | €10.5T |
| STOXX Developed Europe | Pan-regional, broad-market | €9.9T |
| STOXX Europe 600 ESG-X | Pan-regional, broad market, sustainability focus | €9.7T |
| STOXX Europe 50 | Pan-regional, blue-chip | €5.1T |
| EURO STOXX 50 | Eurozone, blue-chip | €3.5T |
Data is as of February 29, 2024. Market cap is free float, which represents the shares that are readily available for public trading on stock exchanges.
The EURO STOXX 50 tracks the Eurozone’s biggest and most traded companies. It also underlies one of the world’s largest ranges of ETFs and mutual funds. As of November 2023, there were €27.3 billion in ETFs and €23.5B in mutual fund assets under management tracking the index.
“For the past 25 years, the EURO STOXX 50 has served as an accurate, reliable and tradable representation of the Eurozone equity market.”
— Axel Lomholt, General Manager at STOXX
Partnering with STOXX to Track the European Stock Market
Are you interested in European equities? STOXX can be a valuable partner:
- Comprehensive, liquid and investable ecosystem
- European heritage, global reach
- Highly sophisticated customization capabilities
- Open architecture approach to using data
- Close partnerships with clients
- Part of ISS STOXX and Deutsche Börse Group
With a full suite of indices, STOXX can help you benchmark against the European stock market.
Learn how STOXX’s European indices offer liquid and effective market access.

-

 Economy1 day ago
Economic Growth Forecasts for G7 and BRICS Countries in 2024
The IMF has released its economic growth forecasts for 2024. How do the G7 and BRICS countries compare?
-

 Markets1 week ago
U.S. Debt Interest Payments Reach $1 Trillion
U.S. debt interest payments have surged past the $1 trillion dollar mark, amid high interest rates and an ever-expanding debt burden.
-

 United States1 week ago
Ranked: The Largest U.S. Corporations by Number of Employees
We visualized the top U.S. companies by employees, revealing the massive scale of retailers like Walmart, Target, and Home Depot.
-

 Markets2 weeks ago
The Top 10 States by Real GDP Growth in 2023
This graphic shows the states with the highest real GDP growth rate in 2023, largely propelled by the oil and gas boom.
-

 Markets2 weeks ago
Ranked: The World’s Top Flight Routes, by Revenue
In this graphic, we show the highest earning flight routes globally as air travel continued to rebound in 2023.
-

 Markets2 weeks ago
Ranked: The Most Valuable Housing Markets in America
The U.S. residential real estate market is worth a staggering $47.5 trillion. Here are the most valuable housing markets in the country.


-

 Mining1 week ago
Gold vs. S&P 500: Which Has Grown More Over Five Years?
-
Markets2 weeks ago
Ranked: The Most Valuable Housing Markets in America
-

 Money2 weeks ago
Which States Have the Highest Minimum Wage in America?
-

 AI2 weeks ago
Ranked: Semiconductor Companies by Industry Revenue Share
-
Markets2 weeks ago
Ranked: The World’s Top Flight Routes, by Revenue
-

 Demographics2 weeks ago
Population Projections: The World’s 6 Largest Countries in 2075
-
Markets2 weeks ago
The Top 10 States by Real GDP Growth in 2023
-

 Demographics2 weeks ago
The Smallest Gender Wage Gaps in OECD Countries