Economy
This Simple Chart Reveals the Distribution Of Global Wealth


The Global Wealth Distribution in One Chart
The pandemic resulted in global wealth taking a significant dip in the first part of 2020. By the end of March, global household wealth had already declined by around 4.4%.
Interestingly, after much monetary and fiscal stimulus from governments around the world, global household wealth was more than able to recover, finishing up the year at $418.3 trillion, a 7.4% gain from the previous year.
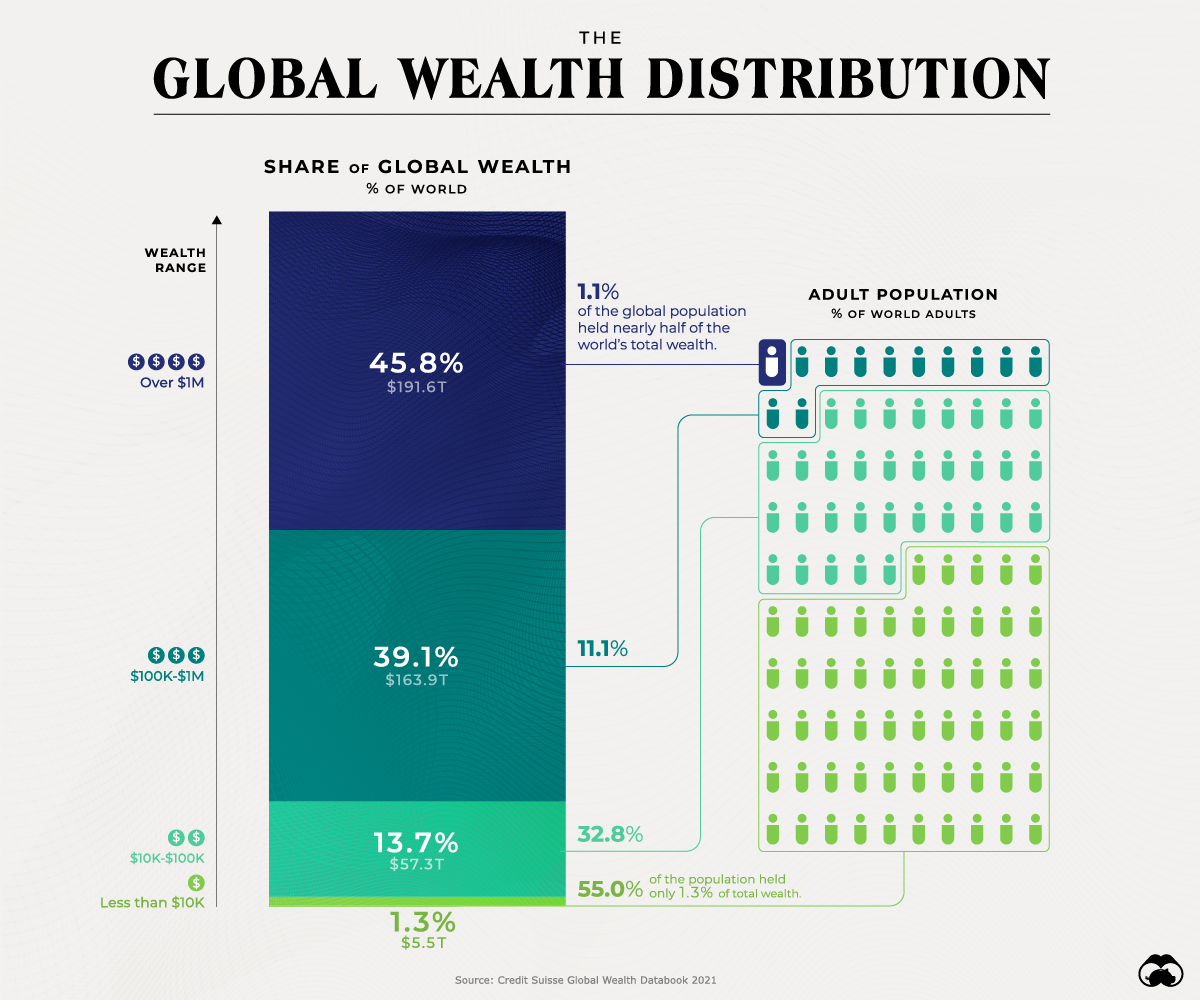
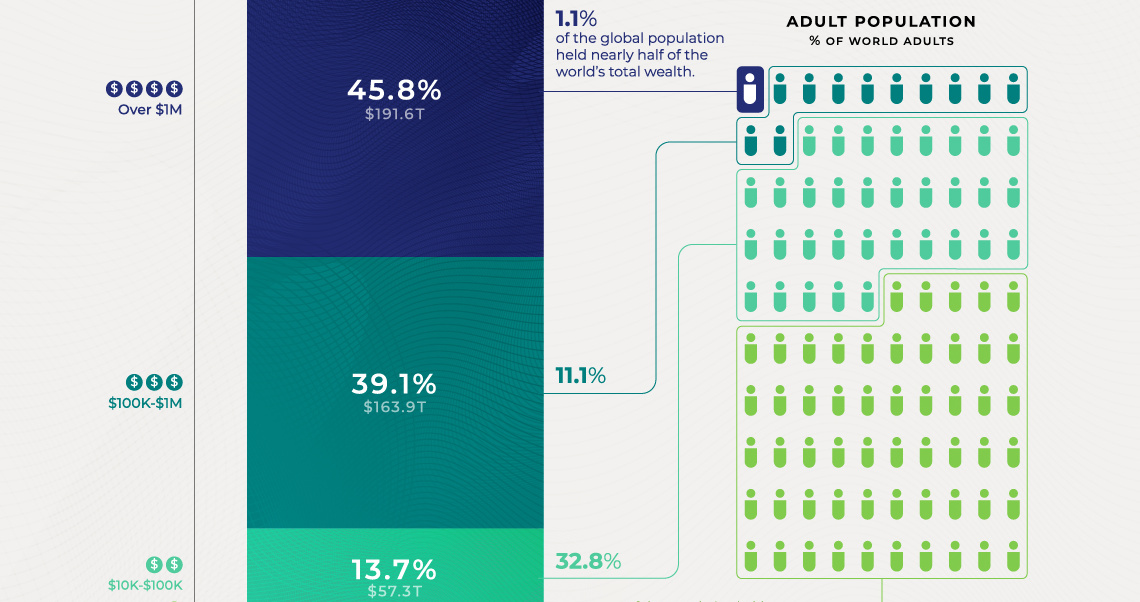
Using data from Credit Suisse, this graphic looks at how global wealth is distributed among the adult population.
How is Global Wealth Distributed?
While individuals worth more than $1 million constitute just 1.1% of the world’s population, they hold 45.8% of global wealth.
| Wealth Range | Wealth | Global Share (%) | Adult Population |
|---|---|---|---|
| Over $1M | $191.6 trillion | 45.8% | Held by 1.1% |
| $100k-$1M | $163.9 trillion | 39.1% | Held by 11.1% |
| $10k-$100k | $57.3 trillion | 13.7% | Held by 32.8% |
| Less than $10k | $5.5 trillion | 1.3% | Held by 55.0% |
| Total | $418.3 trillion | 100.0% | Held by 100.0% |
On the other end of the spectrum, 55% of the population owns only 1.3% of global wealth.
And between these two extreme wealth distribution cases, the rest of the world’s population has a combined 52.8% of the wealth.
Global Wealth Distribution by Region
While wealth inequality is especially evident within the wealth ranges mentioned above, these differences can also be seen on a more regional basis between countries.
In 2020, total wealth rose by $12.4 trillion in North America and $9.2 trillion in Europe. These two regions accounted for the bulk of the wealth gains, with China adding another $4.2 trillion and the Asia-Pacific region (excluding China and India) another $4.7 trillion.
Here is a breakdown of global wealth distribution by region:
| Region | Total Wealth (US$B) | Change in Total Wealth (US$B) | Change % | Wealth Per Adult (US$) | Change % |
|---|---|---|---|---|---|
| North America | 136,316 | 12,370 | 10.0 | 486,930 | 9.1 |
| Europe | 103,213 | 9,179 | 9.8 | 174,836 | 9.8 |
| Asia-Pacific | 75,277 | 4,694 | 6.7 | 60,790 | 5.0 |
| China | 74,884 | 4,246 | 6.0 | 67,771 | 5.4 |
| India | 12,833 | -594 | -4.4 | 14,252 | -6.1 |
| Latin America | 10,872 | -1,215 | -10.1 | 24,301 | -11.4 |
| Africa | 4,946 | 36 | 0.7 | 7,371 | -2.1 |
| World | 418,342 | 28,716 | 7.4 | 79,952 | 6.0 |
India and Latin America both recorded losses in 2020.
Total wealth fell in India by $594 billion, or 4.4%. Meanwhile, Latin America appears to have been the worst-performing region, with total wealth dropping by 11.4% or $1.2 trillion.
Post-COVID Global Outlook 2020-2025
Despite the burden of COVID-19 on the global economy, the world can expect robust GDP growth in the coming years, especially in 2021. The latest estimates by the International Monetary Fund in April 2021 suggest that global GDP in 2021 will total $100.1 trillion in nominal terms, up by 4.1% compared to last year.
The link in normal times between GDP growth and household wealth growth, combined with the expected rapid return of economic activity to its pre-pandemic levels, suggests that global wealth could grow again at a fast pace. According to Credit Suisse estimates, global wealth may rise by 39% over the next five years.
Low and middle-income countries will also play an essential role in the coming year. They are responsible for 42% of the growth, even though they account for just 33% of current wealth.


Markets
Ranked: The Largest U.S. Corporations by Number of Employees
We visualized the top U.S. companies by employees, revealing the massive scale of retailers like Walmart, Target, and Home Depot.


The Largest U.S. Corporations by Number of Employees
This was originally posted on our Voronoi app. Download the app for free on Apple or Android and discover incredible data-driven charts from a variety of trusted sources.
Revenue and profit are common measures for measuring the size of a business, but what about employee headcount?
To see how big companies have become from a human perspective, we’ve visualized the top U.S. companies by employees. These figures come from companiesmarketcap.com, and were accessed in March 2024. Note that this ranking includes publicly-traded companies only.
Data and Highlights
The data we used to create this list of largest U.S. corporations by number of employees can be found in the table below.
| Company | Sector | Number of Employees |
|---|---|---|
| Walmart | Consumer Staples | 2,100,000 |
| Amazon | Consumer Discretionary | 1,500,000 |
| UPS | Industrials | 500,000 |
| Home Depot | Consumer Discretionary | 470,000 |
| Concentrix | Information Technology | 440,000 |
| Target | Consumer Staples | 440,000 |
| Kroger | Consumer Staples | 430,000 |
| UnitedHealth | Health Care | 400,000 |
| Berkshire Hathaway | Financials | 383,000 |
| Starbucks | Consumer Discretionary | 381,000 |
| Marriott International | Consumer Discretionary | 377,000 |
| Cognizant | Information Technology | 346,600 |
Retail and Logistics Top the List
Companies like Walmart, Target, and Kroger have a massive headcount due to having many locations spread across the country, which require everything from cashiers to IT professionals.
Moving goods around the world is also highly labor intensive, explaining why UPS has half a million employees globally.
Below the Radar?
Two companies that rank among the largest U.S. corporations by employees which may be less familiar to the public include Concentrix and Cognizant. Both of these companies are B2B brands, meaning they primarily work with other companies rather than consumers. This contrasts with brands like Amazon or Home Depot, which are much more visible among average consumers.
A Note on Berkshire Hathaway
Warren Buffett’s company doesn’t directly employ 383,000 people. This headcount actually includes the employees of the firm’s many subsidiaries, such as GEICO (insurance), Dairy Queen (retail), and Duracell (batteries).
If you’re curious to see how Buffett’s empire has grown over the years, check out this animated graphic that visualizes the growth of Berkshire Hathaway’s portfolio from 1994 to 2022.

-

 Business2 weeks ago
America’s Top Companies by Revenue (1994 vs. 2023)
-

 Environment1 week ago
Ranked: Top Countries by Total Forest Loss Since 2001
-

 Real Estate1 week ago
Visualizing America’s Shortage of Affordable Homes
-

 Maps2 weeks ago
Mapped: Average Wages Across Europe
-

 Mining2 weeks ago
Charted: The Value Gap Between the Gold Price and Gold Miners
-

 Demographics2 weeks ago
Visualizing the Size of the Global Senior Population
-

 Misc2 weeks ago
Tesla Is Once Again the World’s Best-Selling EV Company
-

 Technology2 weeks ago
Ranked: The Most Popular Smartphone Brands in the U.S.