Datastream
Disruptive Materials: Visualizing America’s Import Dependency
The following content is sponsored by Global X ETFs
The Briefing
- The U.S. is 100% import dependent on manganese and graphite
- China and Canada are the two nations the U.S. is most import reliant on
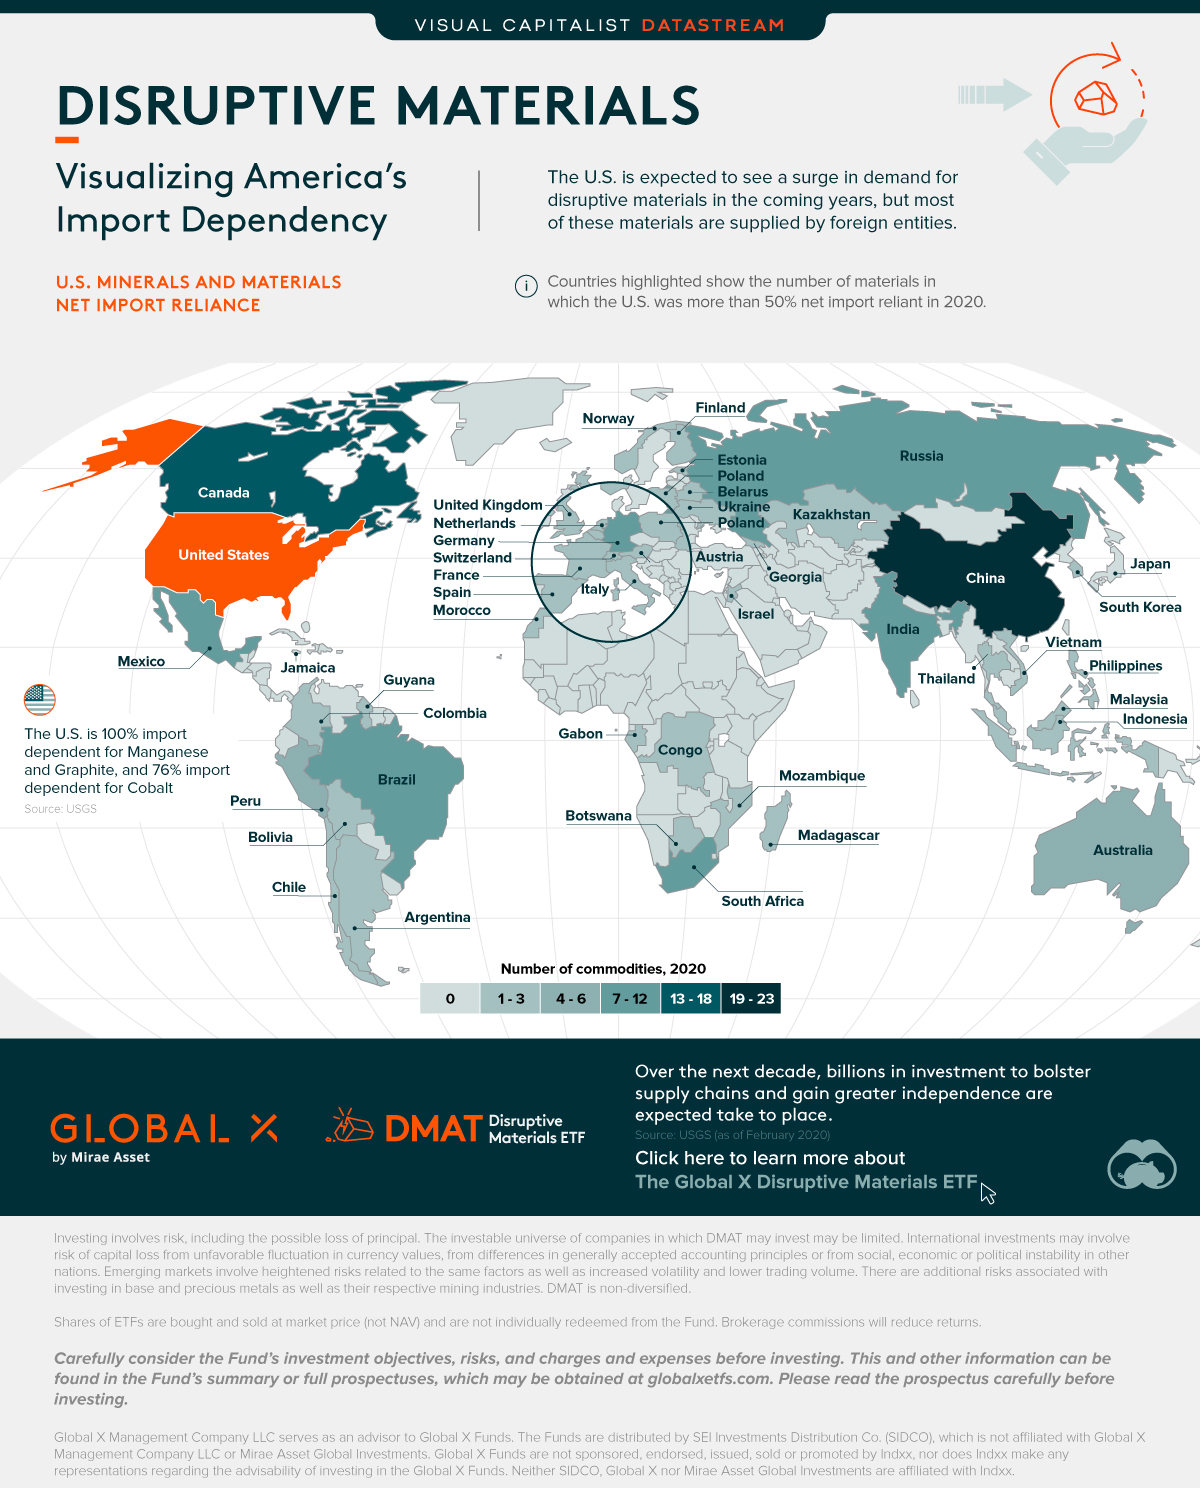
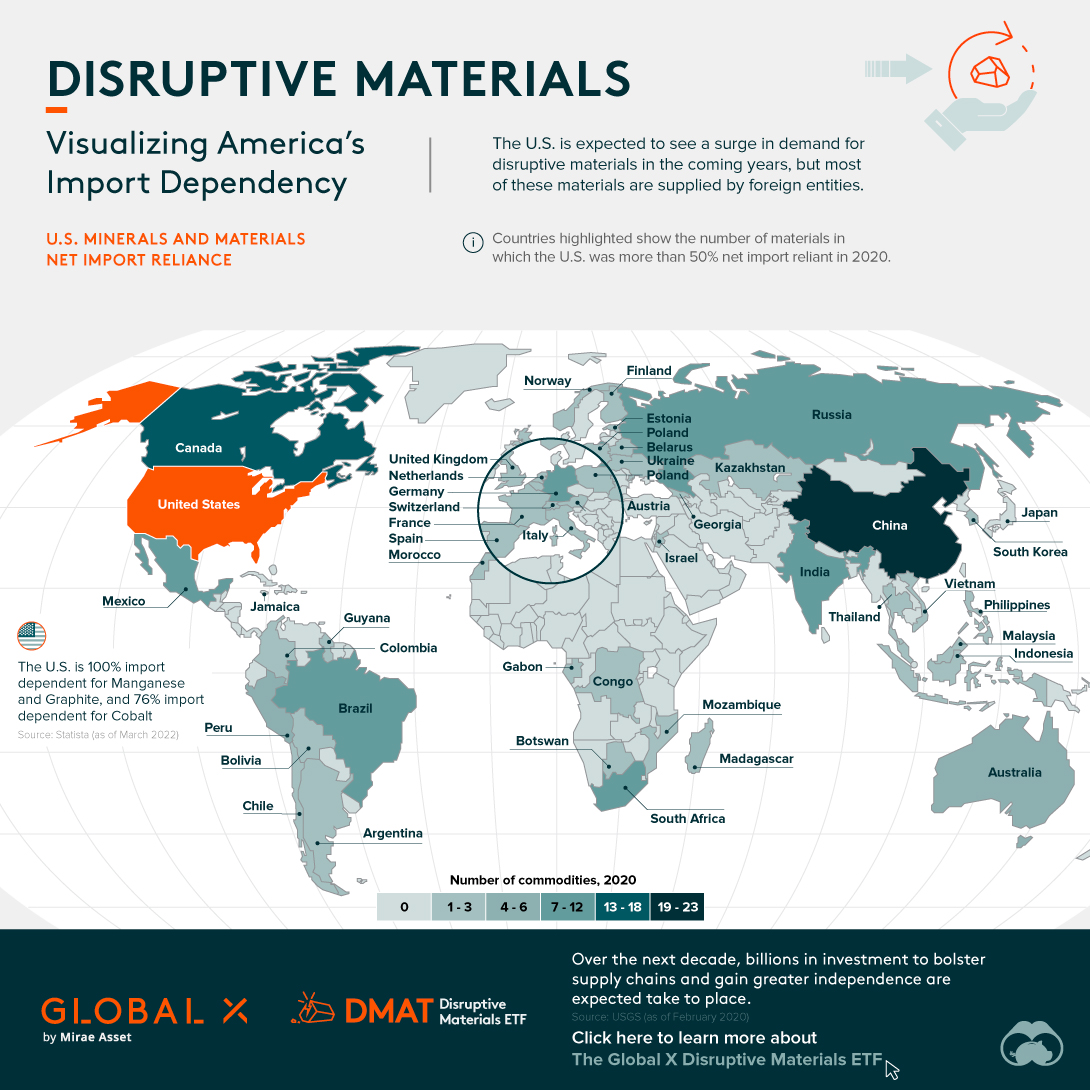
America’s Import Dependency for Disruptive Materials
The U.S. is expected to see surging demand for disruptive materials, which are those deemed to have high level importance for their role in next generation technologies. But many of these disruptive materials like manganese, cobalt, and lithium are primarily imported from foreign countries.
This graphic from Global X ETFs takes a closer look at America’s reliance on net imports for these disruptive materials. Countries are ranked by how many commodities of which the U.S. is a net importer. And net importer is defined as over 50% of domestic use or consumption comes from foreign sources rather than domestic production.
Ranking Country Reliance
The U.S. imports commodities from a lot of countries, including from economic rivals. And these commodities include well known ones like nickel, zinc, and lithium, which are critical to climate-friendly technologies. However, the data reveals that there are a select number of countries where dependency is highest. Here’s a look at the top eight countries.
| Country | Number of Commodities Net Import Reliant |
|---|---|
| 🇨🇳 China | 19-23 |
| 🇨🇦 Canada | 13-18 |
| 🇷🇺 Russia | 7-12 |
| 🇮🇳 India | 7-12 |
| 🇧🇷 Brazil | 7-12 |
| 🇿🇦 South Africa | 7-12 |
| 🇩🇪 Germany | 7-12 |
| 🇲🇽 Mexico | 7-12 |
The U.S. is most dependent on China where they are net import reliant on 19-23 different commodities, followed by Canada with 13-18. In addition, the U.S. is 100% import reliant on manganese and graphite, and 76% import reliant on cobalt.
As these materials become increasingly important for AI, robotics, drone technology, as well as for climate infrastructure like solar panels and wind turbines, nations will desire to bolster their own supply chains and be less reliant on other countries. This may also accelerate due to the pandemic highlighting the fragility behind global supply chains.
Overall, this creates an environment where the market for disruptive materials will see extended periods of high demand and rising prices, otherwise known as a demand supercycle.
Introducing the Global X Disruptive Materials ETF
The Global X Disruptive Materials ETF (Ticker: DMAT) seeks to provide investment results that correspond generally to the price and yield performance, before fees and expenses, of the Solactive Disruptive Materials Index.
To learn more about gaining exposure to the rising demand for disruptive materials, click here now.


Datastream
Can You Calculate Your Daily Carbon Footprint?
Discover how the average person’s carbon footprint impacts the environment and learn how carbon credits can offset your carbon footprint.


The Briefing
- A person’s carbon footprint is substantial, with activities such as food consumption creating as much as 4,500 g of CO₂ emissions daily.
- By purchasing carbon credits from Carbon Streaming Corporation, you can offset your own emissions and fund positive climate action.
Your Everyday Carbon Footprint
While many large businesses and countries have committed to net-zero goals, it is essential to acknowledge that your everyday activities also contribute to global emissions.
In this graphic, sponsored by Carbon Streaming Corporation, we will explore how the choices we make and the products we use have a profound impact on our carbon footprint.
Carbon Emissions by Activity
Here are some of the daily activities and products of the average person and their carbon footprint, according to Clever Carbon.
| Household Activities & Products | CO2 Emissions (g) |
|---|---|
| 💡 Standard Light Bulb (100 watts, four hours) | 172 g |
| 📱 Mobile Phone Use (195 minutes per day)* | 189 g |
| 👕 Washing Machine (0.63 kWh) | 275 g |
| 🔥 Electric Oven (1.56 kWh) | 675 g |
| ♨️ Tumble Dryer (2.5 kWh) | 1,000 g |
| 🧻 Toilet Roll (2 ply) | 1,300 g |
| 🚿 Hot Shower (10 mins) | 2,000 g |
| 🚙 Daily Commute (one hour, by car) | 3,360 g |
| 🍽️ Average Daily Food Consumption (three meals of 600 calories) | 4,500 g |
| *Phone use based on yearly use of 69kg per the source, Reboxed | |
Your choice of transportation plays a crucial role in determining your carbon footprint. For instance, a 15 km daily commute to work on public transport generates an average of 1,464 g of CO₂ emissions. Compared to 3,360 g—twice the volume for a journey the same length by car.
By opting for more sustainable modes of transport, such as cycling, walking, or public transportation, you can significantly reduce your carbon footprint.
Addressing Your Carbon Footprint
One way to compensate for your emissions is by purchasing high-quality carbon credits.
Carbon credits are used to help fund projects that avoid, reduce or remove CO₂ emissions. This includes nature-based solutions such as reforestation and improved forest management, or technology-based solutions such as the production of biochar and carbon capture and storage (CCS).
While carbon credits offer a potential solution for individuals to help reduce global emissions, public awareness remains a significant challenge. A BCG-Patch survey revealed that only 34% of U.S. consumers are familiar with carbon credits, and only 3% have purchased them in the past.
About Carbon Streaming
By financing the creation or expansion of carbon projects, Carbon Streaming Corporation secures the rights to future carbon credits generated by these sustainable projects. You can then purchase these carbon credits to help fund climate solutions around the world and compensate for your own emissions.
Ready to get involved?
>> Learn more about purchasing carbon credits at Carbon Streaming

-

 Markets1 week ago
U.S. Debt Interest Payments Reach $1 Trillion
-

 Business2 weeks ago
Charted: Big Four Market Share by S&P 500 Audits
-

 Real Estate2 weeks ago
Ranked: The Most Valuable Housing Markets in America
-

 Money2 weeks ago
Which States Have the Highest Minimum Wage in America?
-

 AI2 weeks ago
Ranked: Semiconductor Companies by Industry Revenue Share
-

 Markets2 weeks ago
Ranked: The World’s Top Flight Routes, by Revenue
-

 Demographics2 weeks ago
Population Projections: The World’s 6 Largest Countries in 2075
-

 Markets2 weeks ago
The Top 10 States by Real GDP Growth in 2023