Markets
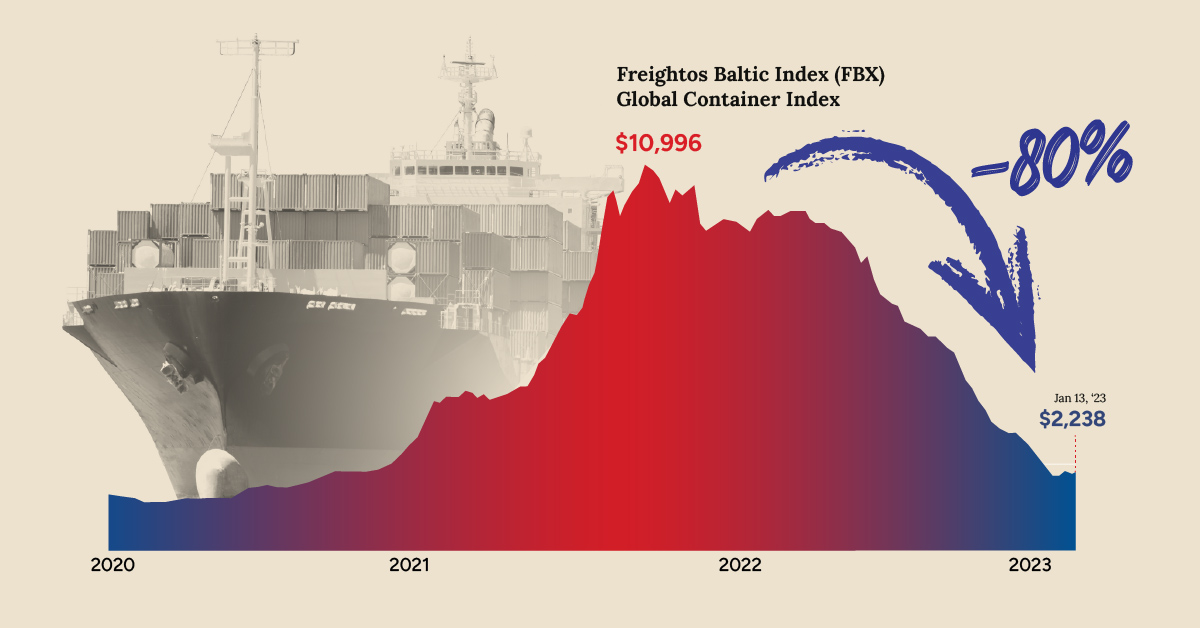
Charted: The Dipping Cost of Shipping
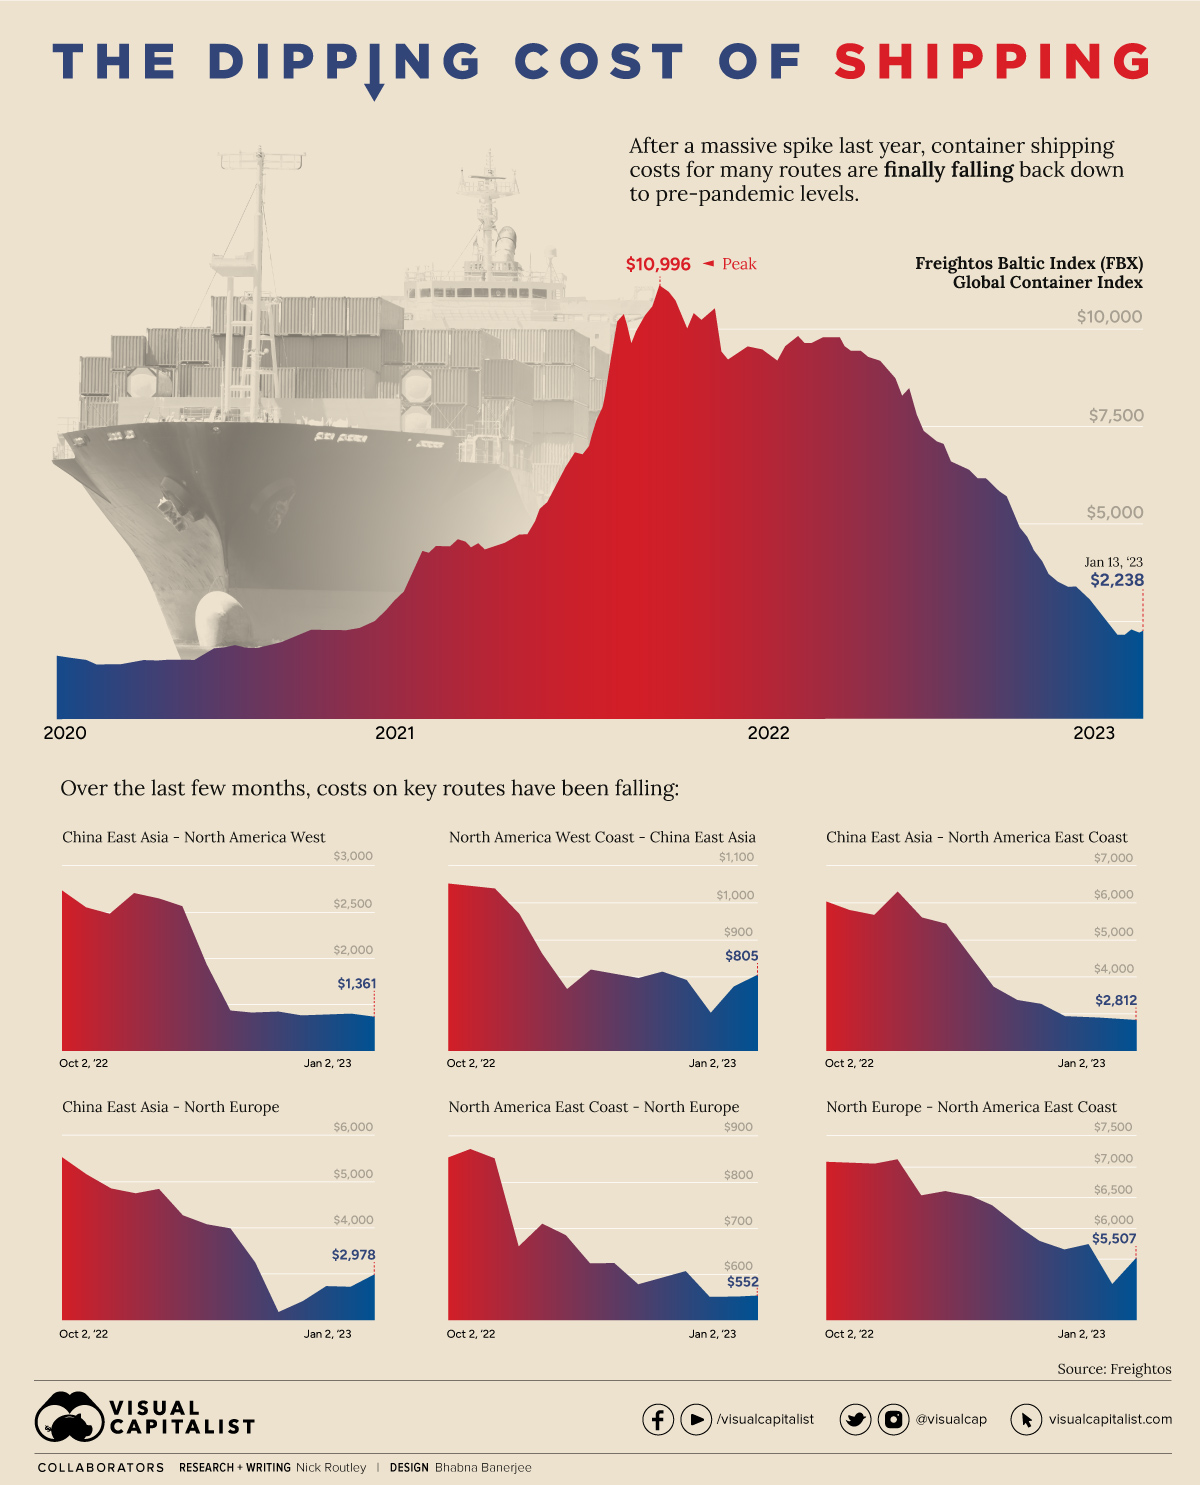


The Dipping Cost of Shipping
A little over one year ago, congestion at America’s West Coast ports were making headlines, and the global cost of shipping containers had reached record highs.
Today, shipping costs have come back down to Earth, with some routes approaching pre-pandemic levels. The graphic above, using data from Freightos, shows just how dramatically costs have fallen in a short amount of time.
The Freightos Baltic Index (FBX)—a widely recognized benchmark for global freight rates—has fallen 80% since its peak in late 2021.
| Shipping Route | Peak Price (Last 90 days) | Recent Price | Change |
|---|---|---|---|
| East Asia -> North America West | $2,702 | $1,323 | -51% |
| North America West -> East Asia | $1,037 | $805 | -22% |
| East Asia -> North America East | $6,296 | $2,812 | -55% |
| East Asia -> North Europe | $4,853 | $2,978 | -39% |
| North America East -> North Europe | $850 | $552 | -35% |
| North Europe -> North America East | $7,102 | $5,507 | -22% |
Why Shipping Costs Matter
The vast majority of trade is conducted over the world’s oceans, so skyrocketing shipping costs can wreak havoc on the global economy.
A recent study from the IMF, which included 143 countries over the past 30 years, found that shipping costs are an important driver of inflation around the world. In fact, when freight rates double, inflation increases by 0.7 of a percentage point.
Of course, some nations feel the effects of higher shipping costs more acutely than others. Countries that import more of what they consume and that are more integrated into the global supply chain are more likely to see inflation rise as shipping costs elevate.
Falling Freight Rates Are a Good Thing, Right?
Falling shipping costs are great news for everyone except, well…shippers.
While most of us can eventually look forward to improved supply chain efficiency and less inflationary pressure, shipping companies are seeing the end of a two-year boom period.
For example, major shippers like COSCO and Hapag-Lloyd saw a staggering 10x or more increase in profit per 20-foot equivalent unit (TEU) shipped.
For the time being, carriers are canceling voyages and sending obsolete ships to scrap to keep prices from bottoming out completely. In early January, container spot freight rates rose for first time in 43 weeks, signaling that the rollercoaster ride that shipping rates have been on since the start of the pandemic may be coming to an end.


Economy
Economic Growth Forecasts for G7 and BRICS Countries in 2024
The IMF has released its economic growth forecasts for 2024. How do the G7 and BRICS countries compare?


G7 & BRICS Real GDP Growth Forecasts for 2024
The International Monetary Fund’s (IMF) has released its real gross domestic product (GDP) growth forecasts for 2024, and while global growth is projected to stay steady at 3.2%, various major nations are seeing declining forecasts.
This chart visualizes the 2024 real GDP growth forecasts using data from the IMF’s 2024 World Economic Outlook for G7 and BRICS member nations along with Saudi Arabia, which is still considering an invitation to join the bloc.
Get the Key Insights of the IMF’s World Economic Outlook
Want a visual breakdown of the insights from the IMF’s 2024 World Economic Outlook report?
This visual is part of a special dispatch of the key takeaways exclusively for VC+ members.
Get the full dispatch of charts by signing up to VC+.
Mixed Economic Growth Prospects for Major Nations in 2024
Economic growth projections by the IMF for major nations are mixed, with the majority of G7 and BRICS countries forecasted to have slower growth in 2024 compared to 2023.
Only three BRICS-invited or member countries, Saudi Arabia, the UAE, and South Africa, have higher projected real GDP growth rates in 2024 than last year.
| Group | Country | Real GDP Growth (2023) | Real GDP Growth (2024P) |
|---|---|---|---|
| G7 | 🇺🇸 U.S. | 2.5% | 2.7% |
| G7 | 🇨🇦 Canada | 1.1% | 1.2% |
| G7 | 🇯🇵 Japan | 1.9% | 0.9% |
| G7 | 🇫🇷 France | 0.9% | 0.7% |
| G7 | 🇮🇹 Italy | 0.9% | 0.7% |
| G7 | 🇬🇧 UK | 0.1% | 0.5% |
| G7 | 🇩🇪 Germany | -0.3% | 0.2% |
| BRICS | 🇮🇳 India | 7.8% | 6.8% |
| BRICS | 🇨🇳 China | 5.2% | 4.6% |
| BRICS | 🇦🇪 UAE | 3.4% | 3.5% |
| BRICS | 🇮🇷 Iran | 4.7% | 3.3% |
| BRICS | 🇷🇺 Russia | 3.6% | 3.2% |
| BRICS | 🇪🇬 Egypt | 3.8% | 3.0% |
| BRICS-invited | 🇸🇦 Saudi Arabia | -0.8% | 2.6% |
| BRICS | 🇧🇷 Brazil | 2.9% | 2.2% |
| BRICS | 🇿🇦 South Africa | 0.6% | 0.9% |
| BRICS | 🇪🇹 Ethiopia | 7.2% | 6.2% |
| 🌍 World | 3.2% | 3.2% |
China and India are forecasted to maintain relatively high growth rates in 2024 at 4.6% and 6.8% respectively, but compared to the previous year, China is growing 0.6 percentage points slower while India is an entire percentage point slower.
On the other hand, four G7 nations are set to grow faster than last year, which includes Germany making its comeback from its negative real GDP growth of -0.3% in 2023.
Faster Growth for BRICS than G7 Nations
Despite mostly lower growth forecasts in 2024 compared to 2023, BRICS nations still have a significantly higher average growth forecast at 3.6% compared to the G7 average of 1%.
While the G7 countries’ combined GDP is around $15 trillion greater than the BRICS nations, with continued higher growth rates and the potential to add more members, BRICS looks likely to overtake the G7 in economic size within two decades.
BRICS Expansion Stutters Before October 2024 Summit
BRICS’ recent expansion has stuttered slightly, as Argentina’s newly-elected president Javier Milei declined its invitation and Saudi Arabia clarified that the country is still considering its invitation and has not joined BRICS yet.
Even with these initial growing pains, South Africa’s Foreign Minister Naledi Pandor told reporters in February that 34 different countries have submitted applications to join the growing BRICS bloc.
Any changes to the group are likely to be announced leading up to or at the 2024 BRICS summit which takes place October 22-24 in Kazan, Russia.
Get the Full Analysis of the IMF’s Outlook on VC+
This visual is part of an exclusive special dispatch for VC+ members which breaks down the key takeaways from the IMF’s 2024 World Economic Outlook.
For the full set of charts and analysis, sign up for VC+.

-

 Markets1 week ago
U.S. Debt Interest Payments Reach $1 Trillion
-

 Markets2 weeks ago
Ranked: The Most Valuable Housing Markets in America
-

 Money2 weeks ago
Which States Have the Highest Minimum Wage in America?
-

 AI2 weeks ago
Ranked: Semiconductor Companies by Industry Revenue Share
-

 Markets2 weeks ago
Ranked: The World’s Top Flight Routes, by Revenue
-

 Countries2 weeks ago
Population Projections: The World’s 6 Largest Countries in 2075
-

 Markets2 weeks ago
The Top 10 States by Real GDP Growth in 2023
-

 Money2 weeks ago
The Smallest Gender Wage Gaps in OECD Countries