Technology
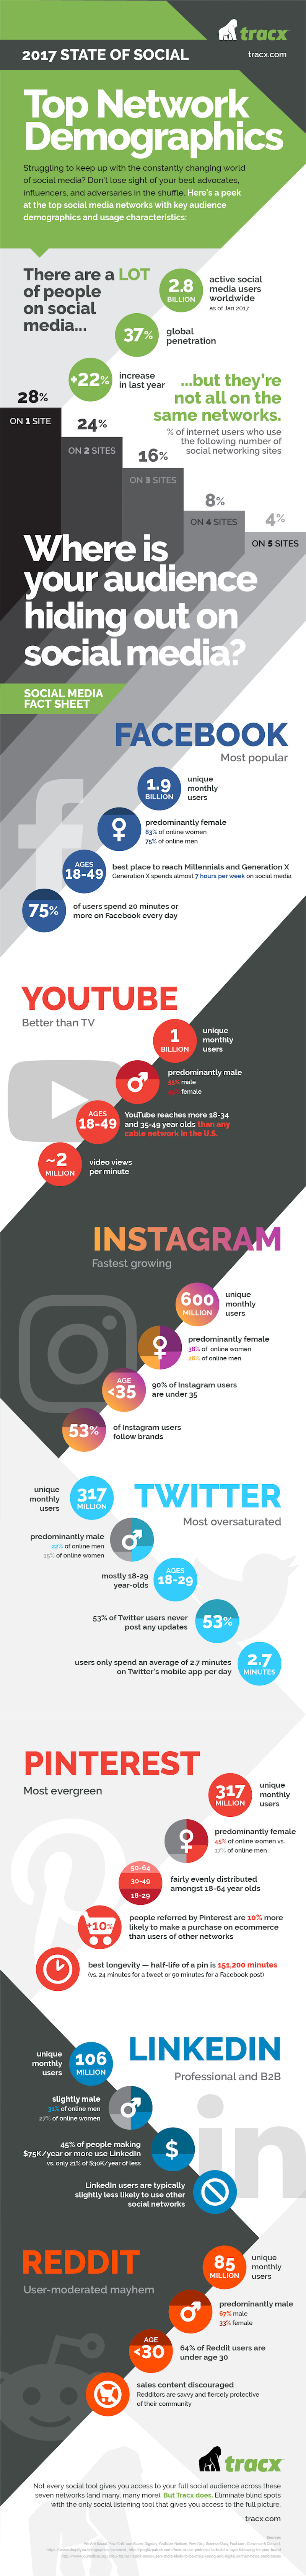
The Key Differences in Demographics for the Top 7 Social Networks
In today’s multi-platform world, the smart businesses are tailoring their messages to audiences based on a variety of factors.
Of course, there are the benefits and limitations to each platform to be considered – but even more importantly, the audience and activity on each platform can differ considerably. The demographics of Pinterest vary from those of YouTube or Facebook, and content creators need to think about these fundamental differences in order to maximize user engagement.
Breaking Down the Top Social Networks
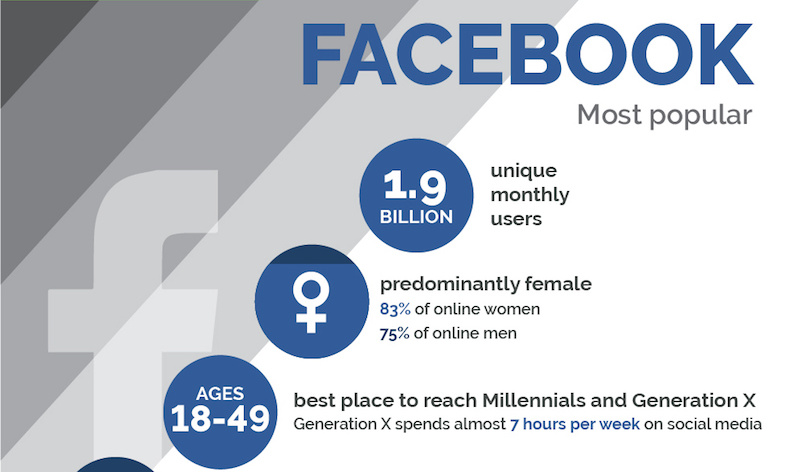
The following infographic comes to us from Tracx, and it dives deep into the demographic differences between the top seven social networks.
We noticed that Snapchat, owned by newly-IPO’d Snap Inc., is not included in the above infographic. While the growth of the $25 billion company has been extremely impressive, by some metrics it is still closing in on some of the smaller social networks (Twitter, Pinterest).
In any case, here’s what you need to know on the fast-growing, millennial-focused network.
The Missing Social Network
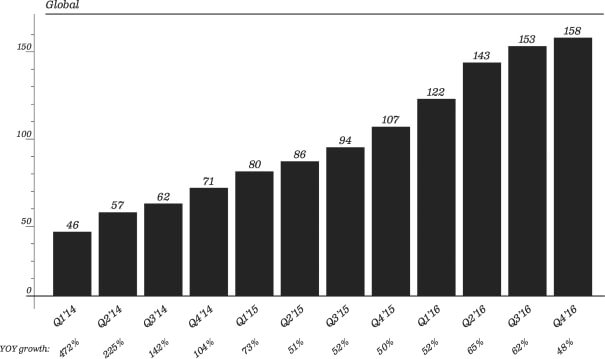
According to the most recent S-1 filing, Snapchat currently has 2.5 billion snaps created per day by an audience of 161 million Daily Active Users (DAUs) as of December 2016.
Here’s what growth looks like, on a quarterly level, for DAUs:
Some other interesting Snapchat stats?
- Users who were 25 years old or older opened Snapchat around 12 times a day and spent 20 minutes a day in the app on average.
- Users who were younger than 25 visited Snapchat more than 20 times a day and spent 30 minutes in it on average.
- Millennials account for 7 out of every 10 Snapchatters.
- Between 500,000 and 1 million Snapchat ads are seen per day.
- About 70% of Snapchatters are female.
- 30% of teens rank Snapchat as their most important social network.
Snapchat is already considered an important piece for companies looking to hit the North American millennial market. As a result, investors value the company over 2x more than Twitter, even despite Snapchat’s monetization problems.
The question is: how long can the growth continue – and when it stops, will it be a top three social network in North America overall?


Technology
Visualizing AI Patents by Country
See which countries have been granted the most AI patents each year, from 2012 to 2022.


Visualizing AI Patents by Country
This was originally posted on our Voronoi app. Download the app for free on iOS or Android and discover incredible data-driven charts from a variety of trusted sources.
This infographic shows the number of AI-related patents granted each year from 2010 to 2022 (latest data available). These figures come from the Center for Security and Emerging Technology (CSET), accessed via Stanford University’s 2024 AI Index Report.
From this data, we can see that China first overtook the U.S. in 2013. Since then, the country has seen enormous growth in the number of AI patents granted each year.
| Year | China | EU and UK | U.S. | RoW | Global Total |
|---|---|---|---|---|---|
| 2010 | 307 | 137 | 984 | 571 | 1,999 |
| 2011 | 516 | 129 | 980 | 581 | 2,206 |
| 2012 | 926 | 112 | 950 | 660 | 2,648 |
| 2013 | 1,035 | 91 | 970 | 627 | 2,723 |
| 2014 | 1,278 | 97 | 1,078 | 667 | 3,120 |
| 2015 | 1,721 | 110 | 1,135 | 539 | 3,505 |
| 2016 | 1,621 | 128 | 1,298 | 714 | 3,761 |
| 2017 | 2,428 | 144 | 1,489 | 1,075 | 5,136 |
| 2018 | 4,741 | 155 | 1,674 | 1,574 | 8,144 |
| 2019 | 9,530 | 322 | 3,211 | 2,720 | 15,783 |
| 2020 | 13,071 | 406 | 5,441 | 4,455 | 23,373 |
| 2021 | 21,907 | 623 | 8,219 | 7,519 | 38,268 |
| 2022 | 35,315 | 1,173 | 12,077 | 13,699 | 62,264 |
In 2022, China was granted more patents than every other country combined.
While this suggests that the country is very active in researching the field of artificial intelligence, it doesn’t necessarily mean that China is the farthest in terms of capability.
Key Facts About AI Patents
According to CSET, AI patents relate to mathematical relationships and algorithms, which are considered abstract ideas under patent law. They can also have different meaning, depending on where they are filed.
In the U.S., AI patenting is concentrated amongst large companies including IBM, Microsoft, and Google. On the other hand, AI patenting in China is more distributed across government organizations, universities, and tech firms (e.g. Tencent).
In terms of focus area, China’s patents are typically related to computer vision, a field of AI that enables computers and systems to interpret visual data and inputs. Meanwhile America’s efforts are more evenly distributed across research fields.
Learn More About AI From Visual Capitalist
If you want to see more data visualizations on artificial intelligence, check out this graphic that shows which job departments will be impacted by AI the most.

-

 Mining1 week ago
Gold vs. S&P 500: Which Has Grown More Over Five Years?
-

 Markets2 weeks ago
Ranked: The Most Valuable Housing Markets in America
-

 Money2 weeks ago
Which States Have the Highest Minimum Wage in America?
-

 AI2 weeks ago
Ranked: Semiconductor Companies by Industry Revenue Share
-

 Markets2 weeks ago
Ranked: The World’s Top Flight Routes, by Revenue
-

 Countries2 weeks ago
Population Projections: The World’s 6 Largest Countries in 2075
-

 Markets2 weeks ago
The Top 10 States by Real GDP Growth in 2023
-

 Demographics2 weeks ago
The Smallest Gender Wage Gaps in OECD Countries