Energy
The Decline of Coal in Three Charts
The Decline of Coal in Three Charts
How coal went from hero to zero in just five short years.
The Chart of the Week is a weekly Visual Capitalist feature on Fridays.
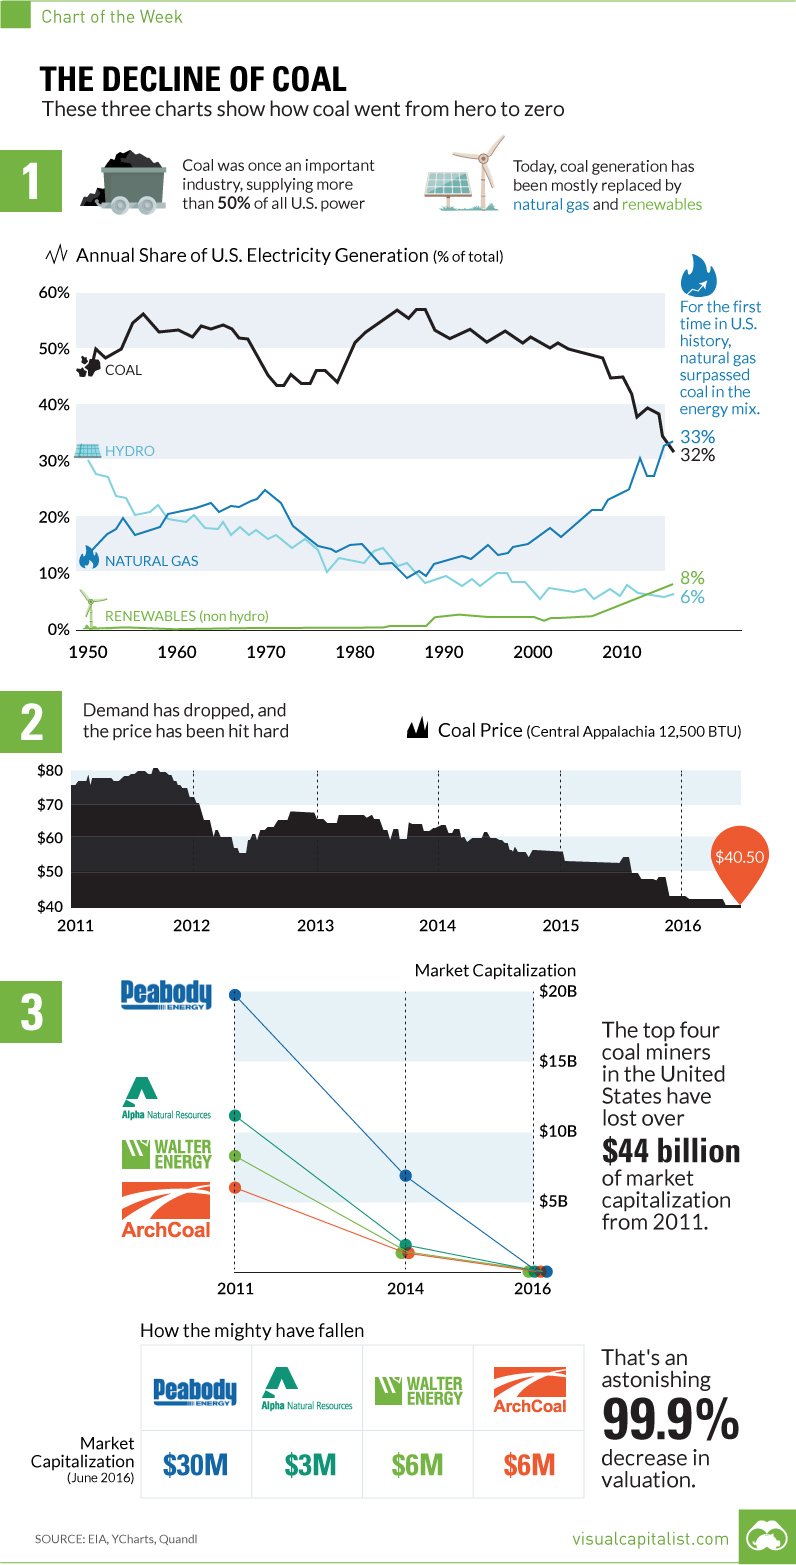
There was a time in the not so distant past that coal was the unquestioned all-star of the energy mix.
Just over a decade ago, coal-fired power generated more than 50% of U.S. electricity. Coal is cheap and found almost everywhere, but it’s also extremely easy to scale with. If you need more power, just burn more coal.
However, the decline of coal has been swift and unprecedented. That’s why it is expected that by 2020, only 22% of electricity will be generated from the fossil fuel.
What’s Behind the Decline of Coal?
While there is obvious environmental pressure on miners and utilities in the coal business, the number one coal killer is an unlikely source: hydraulic fracturing and horizontal drilling.
These two technologies have led to a natural gas supply boom, making the United States the top natural gas producer in the world. From 2005 to 2010, natural gas mostly traded in a range between $5-10 per mcf. Today, excess supply has brought it to a range between $2-3 per mcf, making it extremely desirable for utilities.
This year, for the first time ever, natural gas has surpassed coal in use for power generation in the United States. The EIA expects natural gas and coal to make up 33% and 32% respectively in the energy mix for 2016.
How the Mighty Have Fallen
Not surprisingly, shrinking demand has led to a collapse in coal prices.
The decrease in revenues have slashed margins, and now equity in some of the biggest coal miners in the world is almost worthless. Similar to some oil and gas companies, many coal miners accumulated major debt loads when prices were high and demand seemed sustainable.
Now major US coal miners such as Peabody Energy and ArchCoal have been obliterated:
| 2011 | 2014 | 2016 | |
|---|---|---|---|
| Peabody | $19.7 billion | $7 billion | $0.030 billion |
| Arch Coal | $6.0 billion | $1 billion | $0.006 billion |
| Alpha Natural | $10.7 billion | $1.6 billion | $0.003 billion |
| Walter Energy | $8.2 billion | $1 billion | $0.006 billion |
| Total | $44.6 billion | $10.6 billion | $0.045 billion |
The top four miners have lost over $44 billion in market capitalization from their recent peaks in 2011.
That’s an astonishing 99.9% decrease in value, and possibly exemplifies the decline of coal better than anything else.


Energy
The World’s Biggest Nuclear Energy Producers
China has grown its nuclear capacity over the last decade, now ranking second on the list of top nuclear energy producers.


The World’s Biggest Nuclear Energy Producers
This was originally posted on our Voronoi app. Download the app for free on Apple or Android and discover incredible data-driven charts from a variety of trusted sources.
Scientists in South Korea recently broke a record in a nuclear fusion experiment. For 48 seconds, they sustained a temperature seven times that of the sun’s core.
But generating commercially viable energy from nuclear fusion still remains more science fiction than reality. Meanwhile, its more reliable sibling, nuclear fission, has been powering our world for many decades.
In this graphic, we visualized the top producers of nuclear energy by their share of the global total, measured in terawatt hours (TWh). Data for this was sourced from the Nuclear Energy Institute, last updated in August 2022.
Which Country Generates the Most Nuclear Energy?
Nuclear energy production in the U.S. is more than twice the amount produced by China (ranked second) and France (ranked third) put together. In total, the U.S. accounts for nearly 30% of global nuclear energy output.
However, nuclear power only accounts for one-fifth of America’s electricity supply. This is in contrast to France, which generates 60% of its electricity from nuclear plants.
| Rank | Country | Nuclear Energy Produced (TWh) | % of Total |
|---|---|---|---|
| 1 | 🇺🇸 U.S. | 772 | 29% |
| 2 | 🇨🇳 China | 383 | 14% |
| 3 | 🇫🇷 France | 363 | 14% |
| 4 | 🇷🇺 Russia | 208 | 8% |
| 5 | 🇰🇷 South Korea | 150 | 6% |
| 6 | 🇨🇦 Canada | 87 | 3% |
| 7 | 🇺🇦 Ukraine | 81 | 3% |
| 8 | 🇩🇪 Germany | 65 | 2% |
| 9 | 🇯🇵 Japan | 61 | 2% |
| 10 | 🇪🇸 Spain | 54 | 2% |
| 11 | 🇸🇪 Sweden | 51 | 2% |
| 12 | 🇧🇪 Belgium | 48 | 2% |
| 13 | 🇬🇧 UK | 42 | 2% |
| 14 | 🇮🇳 India | 40 | 2% |
| 15 | 🇨🇿 Czech Republic | 29 | 1% |
| N/A | 🌐 Other | 219 | 8% |
| N/A | 🌍 Total | 2,653 | 100% |
Another highlight is how China has rapidly grown its nuclear energy capabilities in the last decade. Between 2016 and 2021, for example, it increased its share of global nuclear energy output from less than 10% to more than 14%, overtaking France for second place.
On the opposite end, the UK’s share has slipped to 2% over the same time period.
Meanwhile, Ukraine has heavily relied on nuclear energy to power its grid. In March 2022, it lost access to its key Zaporizhzhia Nuclear Power Station after Russian forces wrested control of the facility. With six 1,000 MW reactors, the plant is one of the largest in Europe. It is currently not producing any power, and has been the site of recent drone attacks.

-

 Real Estate2 weeks ago
Visualizing America’s Shortage of Affordable Homes
-

 Technology1 week ago
Ranked: Semiconductor Companies by Industry Revenue Share
-

 Money2 weeks ago
Which States Have the Highest Minimum Wage in America?
-

 Real Estate2 weeks ago
Ranked: The Most Valuable Housing Markets in America
-

 Business2 weeks ago
Charted: Big Four Market Share by S&P 500 Audits
-

 AI2 weeks ago
The Stock Performance of U.S. Chipmakers So Far in 2024
-

 Misc2 weeks ago
Almost Every EV Stock is Down After Q1 2024
-

 Money2 weeks ago
Where Does One U.S. Tax Dollar Go?