Markets
When Will Air Travel Return to Pre-Pandemic Levels?
Article/Editing:
When Will Air Travel Return to Pre-Pandemic Levels?
Many industries were hit hard by the global pandemic, but it can be argued that air travel suffered one of the most severe blows.
The aviation industry as a whole suffered an estimated $370 billion loss in global revenue because of COVID-19. And while air travel has been slowly recovering from the trough, flight passenger traffic has yet to fully bounce back.
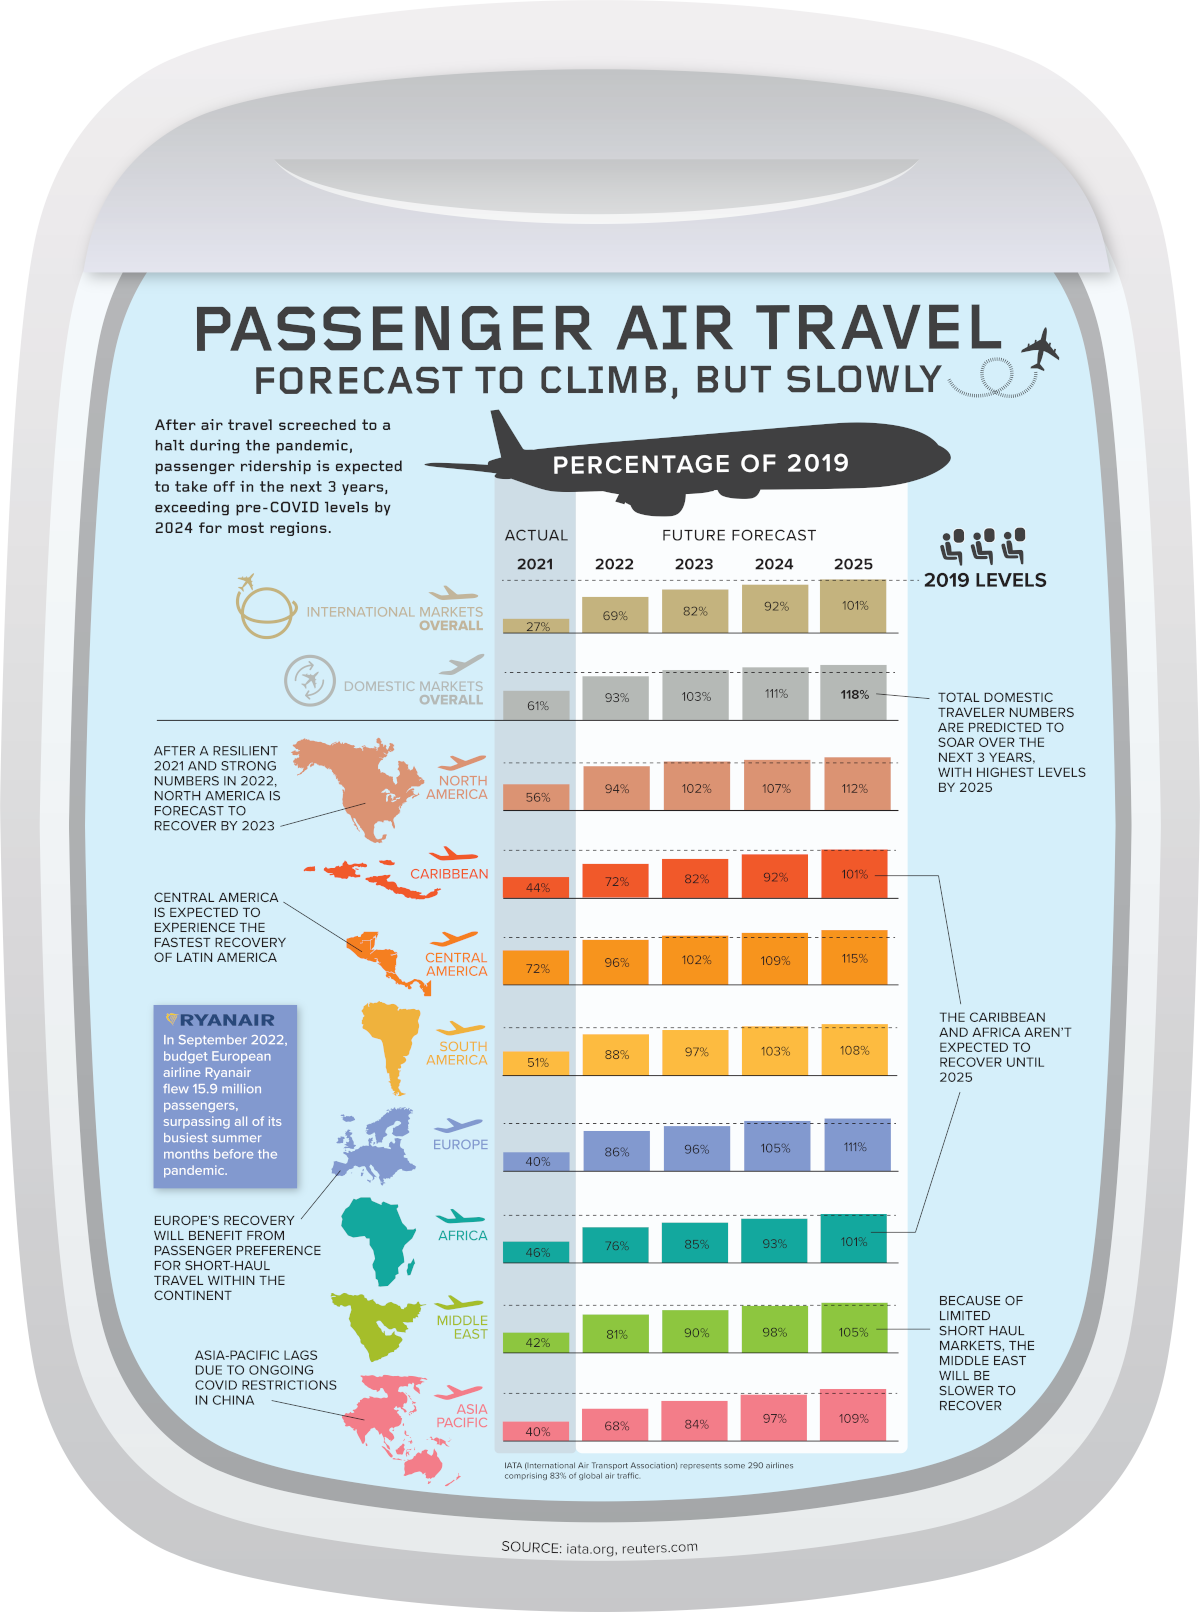
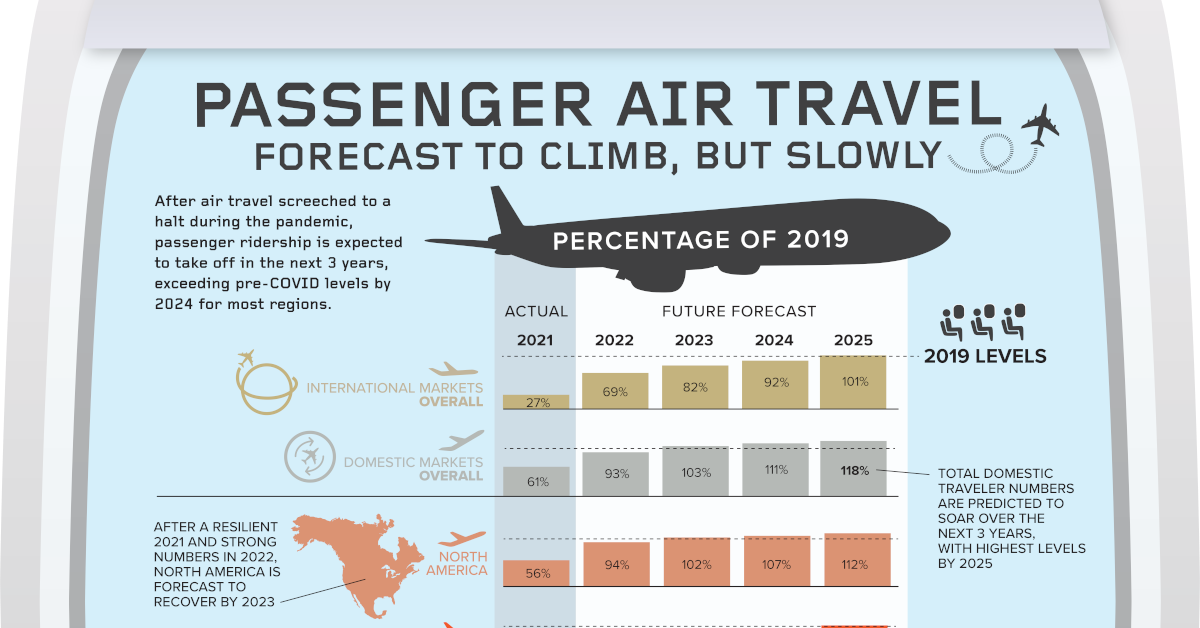
Where is the industry at in 2022 compared to pre-COVID times, and when is air passenger travel expected to return to regular levels? This graphic by Julie R. Peasley uses data from IATA to show current and projected air passenger ridership.
Air Travel Traffic: 2021 and 2022
After an incredibly difficult 2020, the airline industry started to see significant improvements in travel frequency. But compared to pre-pandemic levels, there’s a lot of ground to cover.
In 2021, overall passenger numbers only reached 47% of 2019 levels. This influx was largely driven by domestic travel, with international passenger numbers only reaching 27% of pre-COVID levels.
| Passenger numbers (% of 2019) | 2021 | 2022 |
|---|---|---|
| International | 27% | 69% |
| Domestic | 61% | 93% |
| Africa | 46% | 76% |
| Asia Pacific | 40% | 68% |
| Caribbean | 44% | 72% |
| Central America | 72% | 96% |
| Europe | 40% | 86% |
| Middle East | 42% | 81% |
| North America | 56% | 94% |
| South America | 51% | 88% |
| Industry-wide | 47% | 83% |
From a regional perspective, Central America experienced one of the fastest recoveries. In 2021, overall passenger numbers in the region had reached 72% of 2019 levels, and they are projected to reach 96% by the end of 2022.
In fact, the Americas as a whole has seen a quick recovery. Both North America and South America also reached above 50% of 2019 ridership in 2021, and are projected to reach 94% and 88% ridership in 2022, respectively.
On the opposite end of the spectrum, Asia Pacific has experienced the slowest recovery. This is likely due to stricter lockdowns and travel restrictions put into effect in this region (which was harder hit by SARS in 2003), especially in places like Shanghai.
Forecasting Traffic in 2023 and Beyond
While recovery has looked different from region to region, airlines are largely expected to see a full recovery to their ridership levels by 2025.
| Forecasted Passengers (% of 2019) | 2023 | 2024 | 2025 |
|---|---|---|---|
| International | 82% | 92% | 101% |
| Domestic | 103% | 111% | 118% |
| Africa | 85% | 93% | 101% |
| Asia Pacific | 84% | 97% | 109% |
| Caribbean | 82% | 92% | 101% |
| Central America | 102% | 109% | 115% |
| Europe | 96% | 105% | 111% |
| Middle East | 90% | 98% | 105% |
| North America | 102% | 107% | 112% |
| South America | 97% | 103% | 108% |
| Industry-wide | 94% | 103% | 111% |
This recovery is a signifier of a much broader mindset shift, as governments continue to reassess their COVID-19 management strategies.
But while the future seems promising, IATA stressed that the forecast does not take into account the potential impact of the Russia-Ukraine conflict and other geopolitical concerns, which could have far-reaching consequences on the global economy (and travel) in the coming years.

This article was published as a part of Visual Capitalist's Creator Program, which features data-driven visuals from some of our favorite Creators around the world.


Markets
U.S. Debt Interest Payments Reach $1 Trillion
U.S. debt interest payments have surged past the $1 trillion dollar mark, amid high interest rates and an ever-expanding debt burden.


U.S. Debt Interest Payments Reach $1 Trillion
This was originally posted on our Voronoi app. Download the app for free on iOS or Android and discover incredible data-driven charts from a variety of trusted sources.
The cost of paying for America’s national debt crossed the $1 trillion dollar mark in 2023, driven by high interest rates and a record $34 trillion mountain of debt.
Over the last decade, U.S. debt interest payments have more than doubled amid vast government spending during the pandemic crisis. As debt payments continue to soar, the Congressional Budget Office (CBO) reported that debt servicing costs surpassed defense spending for the first time ever this year.
This graphic shows the sharp rise in U.S. debt payments, based on data from the Federal Reserve.
A $1 Trillion Interest Bill, and Growing
Below, we show how U.S. debt interest payments have risen at a faster pace than at another time in modern history:
| Date | Interest Payments | U.S. National Debt |
|---|---|---|
| 2023 | $1.0T | $34.0T |
| 2022 | $830B | $31.4T |
| 2021 | $612B | $29.6T |
| 2020 | $518B | $27.7T |
| 2019 | $564B | $23.2T |
| 2018 | $571B | $22.0T |
| 2017 | $493B | $20.5T |
| 2016 | $460B | $20.0T |
| 2015 | $435B | $18.9T |
| 2014 | $442B | $18.1T |
| 2013 | $425B | $17.2T |
| 2012 | $417B | $16.4T |
| 2011 | $433B | $15.2T |
| 2010 | $400B | $14.0T |
| 2009 | $354B | $12.3T |
| 2008 | $380B | $10.7T |
| 2007 | $414B | $9.2T |
| 2006 | $387B | $8.7T |
| 2005 | $355B | $8.2T |
| 2004 | $318B | $7.6T |
| 2003 | $294B | $7.0T |
| 2002 | $298B | $6.4T |
| 2001 | $318B | $5.9T |
| 2000 | $353B | $5.7T |
| 1999 | $353B | $5.8T |
| 1998 | $360B | $5.6T |
| 1997 | $368B | $5.5T |
| 1996 | $362B | $5.3T |
| 1995 | $357B | $5.0T |
| 1994 | $334B | $4.8T |
| 1993 | $311B | $4.5T |
| 1992 | $306B | $4.2T |
| 1991 | $308B | $3.8T |
| 1990 | $298B | $3.4T |
| 1989 | $275B | $3.0T |
| 1988 | $254B | $2.7T |
| 1987 | $240B | $2.4T |
| 1986 | $225B | $2.2T |
| 1985 | $219B | $1.9T |
| 1984 | $205B | $1.7T |
| 1983 | $176B | $1.4T |
| 1982 | $157B | $1.2T |
| 1981 | $142B | $1.0T |
| 1980 | $113B | $930.2B |
| 1979 | $96B | $845.1B |
| 1978 | $84B | $789.2B |
| 1977 | $69B | $718.9B |
| 1976 | $61B | $653.5B |
| 1975 | $55B | $576.6B |
| 1974 | $50B | $492.7B |
| 1973 | $45B | $469.1B |
| 1972 | $39B | $448.5B |
| 1971 | $36B | $424.1B |
| 1970 | $35B | $389.2B |
| 1969 | $30B | $368.2B |
| 1968 | $25B | $358.0B |
| 1967 | $23B | $344.7B |
| 1966 | $21B | $329.3B |
Interest payments represent seasonally adjusted annual rate at the end of Q4.
At current rates, the U.S. national debt is growing by a remarkable $1 trillion about every 100 days, equal to roughly $3.6 trillion per year.
As the national debt has ballooned, debt payments even exceeded Medicaid outlays in 2023—one of the government’s largest expenditures. On average, the U.S. spent more than $2 billion per day on interest costs last year. Going further, the U.S. government is projected to spend a historic $12.4 trillion on interest payments over the next decade, averaging about $37,100 per American.
Exacerbating matters is that the U.S. is running a steep deficit, which stood at $1.1 trillion for the first six months of fiscal 2024. This has accelerated due to the 43% increase in debt servicing costs along with a $31 billion dollar increase in defense spending from a year earlier. Additionally, a $30 billion increase in funding for the Federal Deposit Insurance Corporation in light of the regional banking crisis last year was a major contributor to the deficit increase.
Overall, the CBO forecasts that roughly 75% of the federal deficit’s increase will be due to interest costs by 2034.

-

 Maps2 weeks ago
Mapped: Average Wages Across Europe
-

 Money1 week ago
Which States Have the Highest Minimum Wage in America?
-

 Real Estate1 week ago
Ranked: The Most Valuable Housing Markets in America
-

 Markets1 week ago
Charted: Big Four Market Share by S&P 500 Audits
-

 AI1 week ago
The Stock Performance of U.S. Chipmakers So Far in 2024
-

 Automotive2 weeks ago
Almost Every EV Stock is Down After Q1 2024
-

 Money2 weeks ago
Where Does One U.S. Tax Dollar Go?
-

 Green2 weeks ago
Ranked: Top Countries by Total Forest Loss Since 2001