Misc
Visualizing the Current State of the Global Gender Gap
Article/Editing:
The Current State of the Global Gender Gap
As a global society, we still have a long way to go before we reach gender equality around the world.
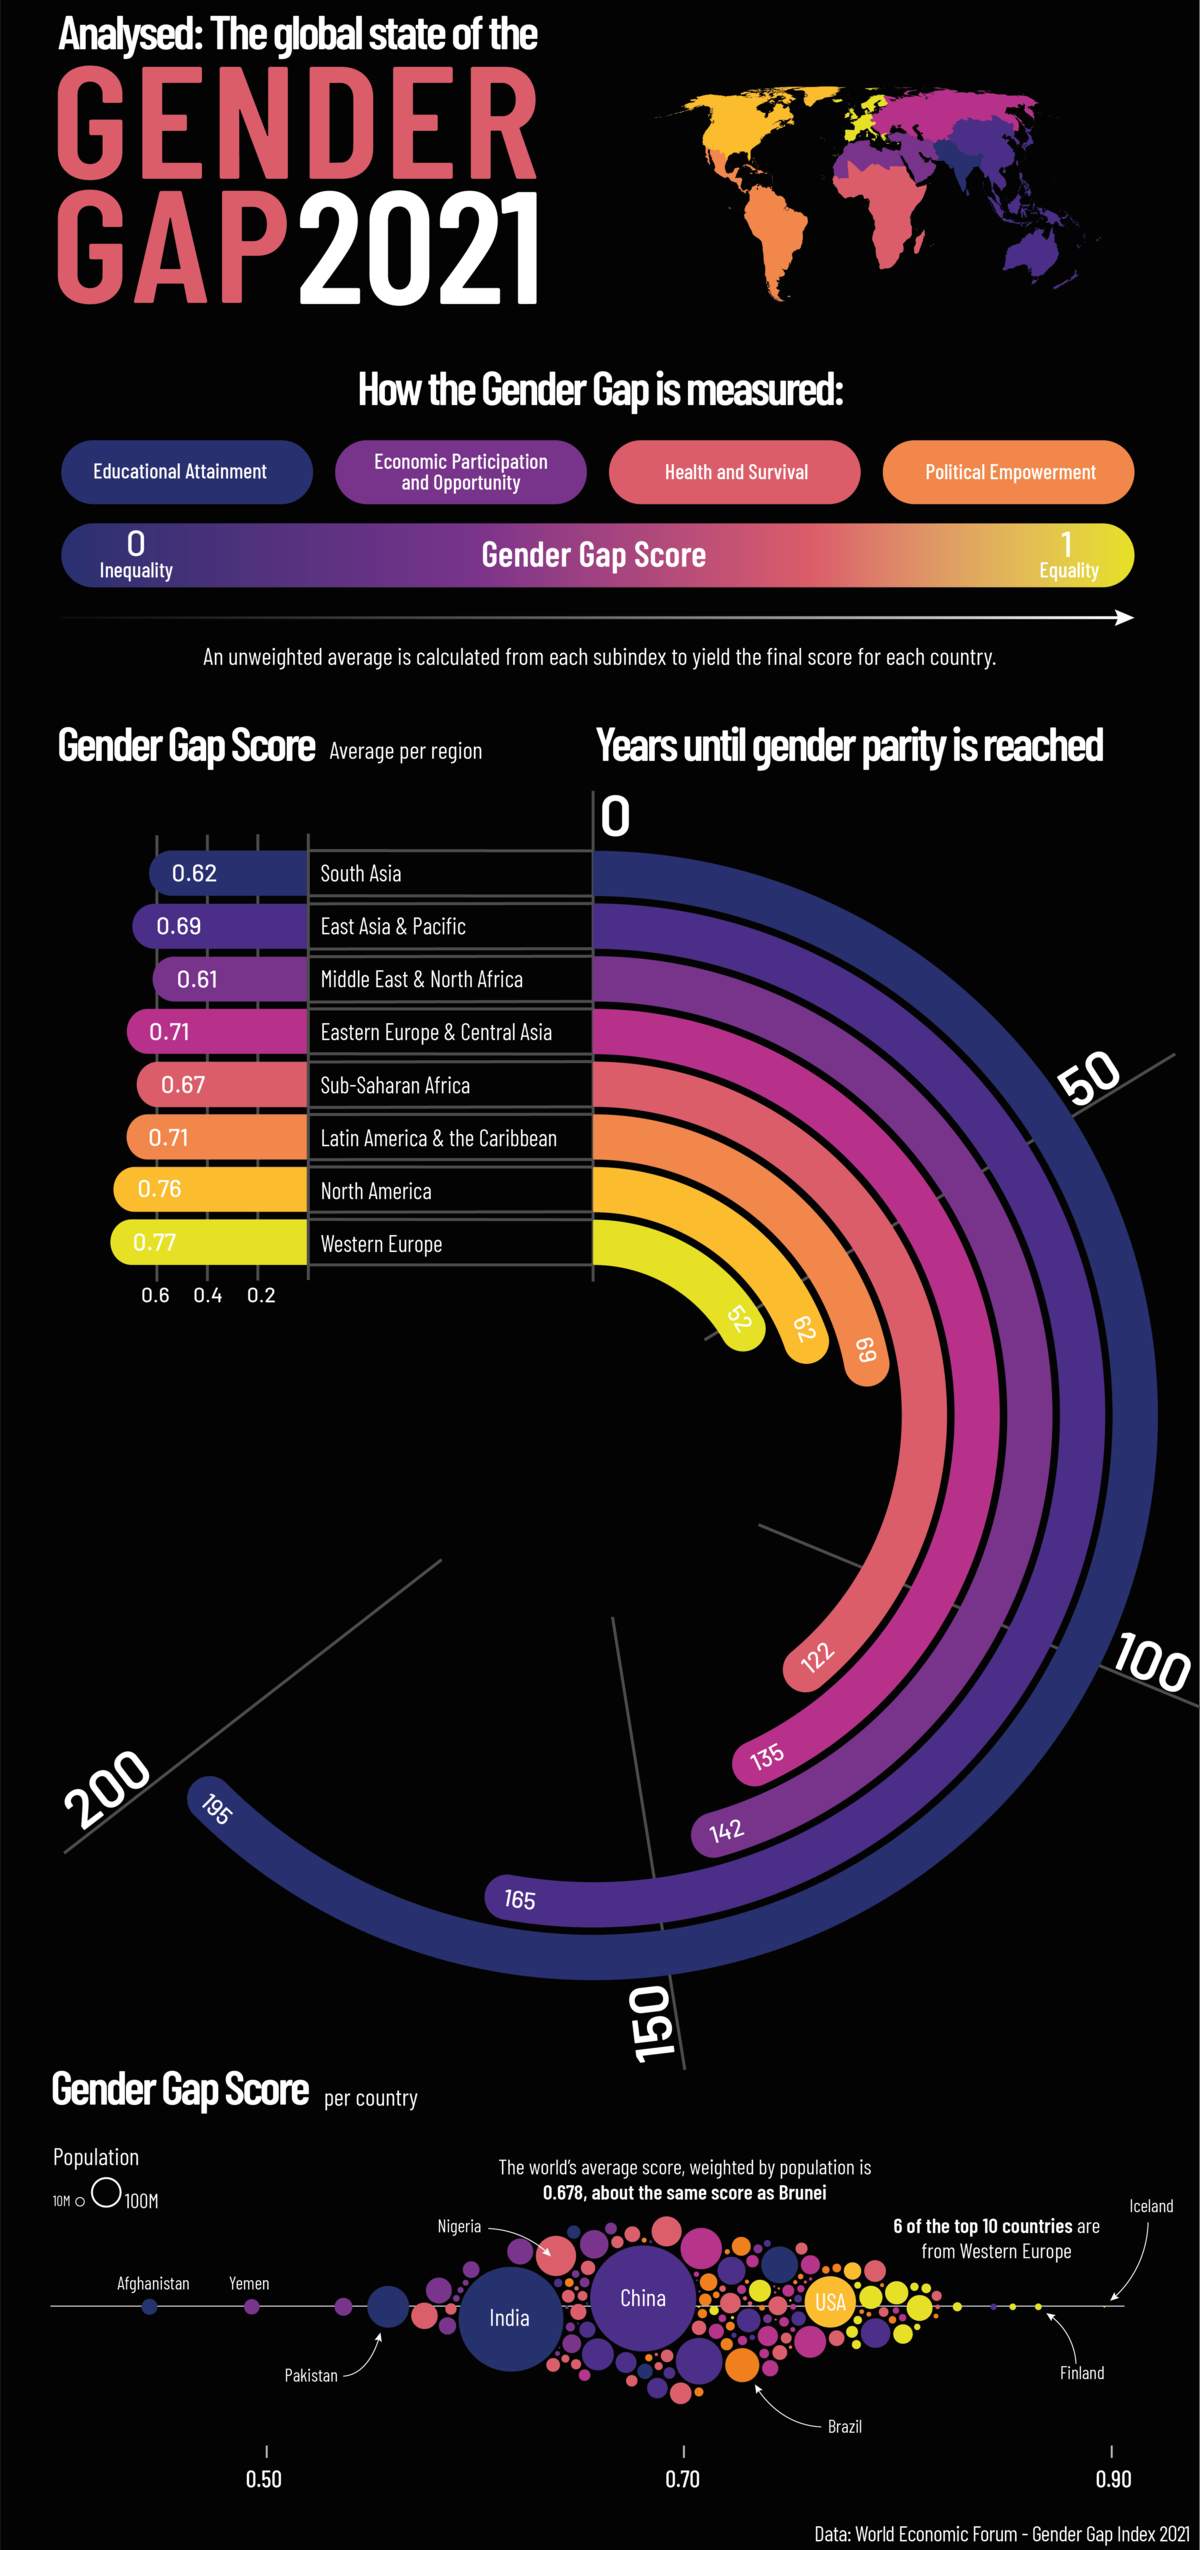
According to the World Economic Forum’s (WEF) latest Global Gender Gap Report, it could take up to 135.6 years to close the global gender gap, based on the current rate of change.
This graphic by Sebastian Gräff gives a breakdown of gender equality worldwide, showing how long it will take before each region reaches gender parity.
How Gender Gap is Measured
In its 15th edition, the Global Gender Gap Report analyzes gender-based discrepancies across 156 different countries. To gauge each region’s gender gap, the report digs into four key areas:
- Economic Participation and Opportunity
- Educational Attainment
- Health and Survival
- Political Empowerment
Each subindex is given its own score, then an average across the four pillars is calculated to give each country a final score between zero (exceptionally unequal) and one (completely equal).
Regional Breakdown
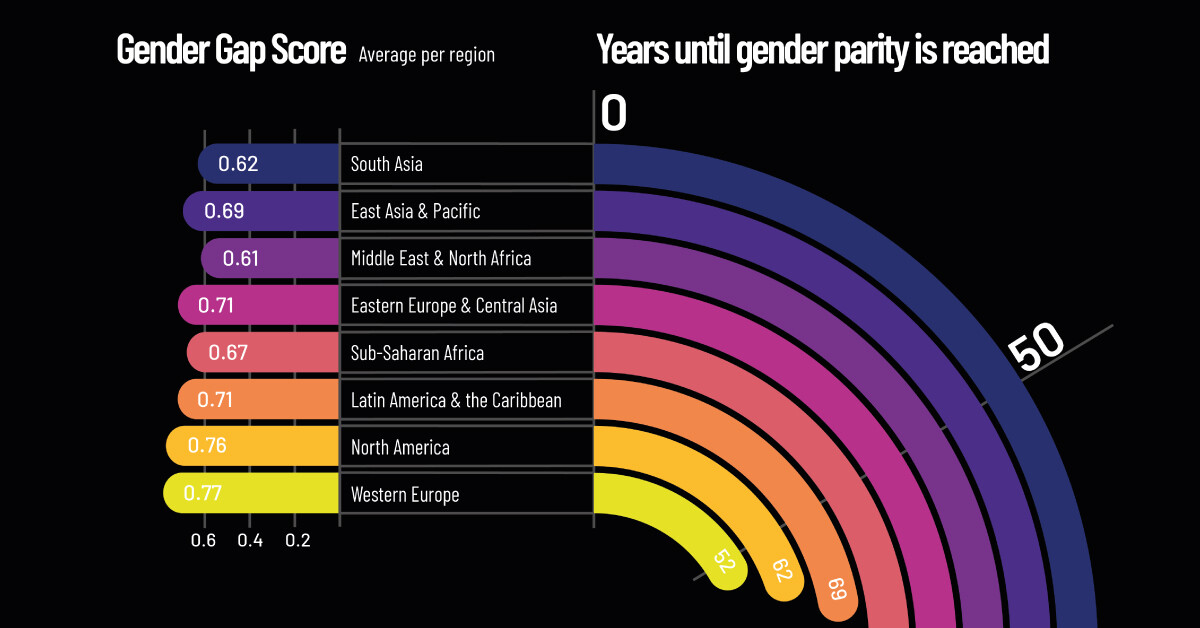
Out of all the regions, Western Europe has the smallest gender gap, with a score of 0.78. At this rate, the gender gap in Western Europe could be closed in approximately 52.1 years, more than 83 years faster than the global estimate.
| Rank | Region | Overall Gender Gap Index (2021) |
|---|---|---|
| 1 | Western Europe | 0.77 |
| 2 | North America | 0.76 |
| 3 | Latin America and the Caribbean | 0.71 |
| 4 | Eastern Europe and Central Asia | 0.71 |
| 5 | East Asia and the Pacific | 0.69 |
| 6 | Sub-Saharan Africa | 0.67 |
| 7 | South Asia | 0.62 |
| 8 | Middle East and North Africa | 0.61 |
| Global Average | 0.69 |
Western Europe scores particularly high in educational attainment (1.0) and health and survival (0.97). Here’s a look at the category breakdown for each region:
| Region | Economic Participation and Opportunity | Educational Attainment | Health and Survival | Political Empowerment |
|---|---|---|---|---|
| Western Europe | 0.70 | 1.00 | 0.97 | 0.44 |
| North America | 0.75 | 1.00 | 0.97 | 0.33 |
| Latin America and the Caribbean | 0.64 | 1.00 | 0.98 | 0.27 |
| Eastern Europe and Central Asia | 0.74 | 1.00 | 0.98 | 0.14 |
| East Asia and the Pacific | 0.70 | 0.98 | 0.95 | 0.14 |
| Sub-Saharan Africa | 0.66 | 0.85 | 0.97 | 0.21 |
| South Asia | 0.34 | 0.93 | 0.94 | 0.28 |
| Middle East and North Africa | 0.41 | 0.94 | 0.97 | 0.12 |
| Global Average | 0.62 | 0.96 | 0.97 | 0.22 |
But it might be surprising to see that political empowerment in Western Europe received a score of only 0.44. This is higher than the global average for political empowerment of 0.21, but still indicative of a large gender gap in this area.
Globally, political empowerment tended to receive the lowest scores in the report, as women are grossly underrepresented in politics. A study by the Council of Foreign Relations revealed that out of 195 different countries’ national cabinets, only 14 countries had at least 50% of their ministerial positions held by women.
Economic participation and opportunity is the second weakest category, with a global average score of 0.58. A good example of how this gap manifests itself is in entrepreneurship and business, where women still struggle to find investors and gain access to venture capital. Further, on average, women continue to make less money than men. According to the UN, women across the globe make approximately 77 cents for every dollar earned by men.
The Economic Benefit of Gender Equality
Research shows that empowering women in the workforce is in everyone’s best interest. Closing the gender gap in the global workforce could lead to a boost of more than $28 trillion to the global economy.
Yet across the globe, COVID-19 has created new challenges that have hindered our progress towards gender equality. This is partly because some of the sectors that have been impacted the most by COVID-19 restrictions, such as hospitality, food services, and personal care, are largely dominated by female workers.
As we continue to recover from the impact of COVID-19, world leaders will face numerous policy challenges, including how to build back better, creating more opportunities for women to thrive in the global economy.

This article was published as a part of Visual Capitalist's Creator Program, which features data-driven visuals from some of our favorite Creators around the world.


Misc
How Hard Is It to Get Into an Ivy League School?
We detail the admission rates and average annual cost for Ivy League schools, as well as the median SAT scores required to be accepted.


How Hard Is It to Get Into an Ivy League School?
This was originally posted on our Voronoi app. Download the app for free on iOS or Android and discover incredible data-driven charts from a variety of trusted sources.
Ivy League institutions are renowned worldwide for their academic excellence and long-standing traditions. But how hard is it to get into one of the top universities in the U.S.?
In this graphic, we detail the admission rates and average annual cost for Ivy League schools, as well as the median SAT scores required to be accepted. The data comes from the National Center for Education Statistics and was compiled by 24/7 Wall St.
Note that “average annual cost” represents the net price a student pays after subtracting the average value of grants and/or scholarships received.
Harvard is the Most Selective
The SAT is a standardized test commonly used for college admissions in the United States. It’s taken by high school juniors and seniors to assess their readiness for college-level academic work.
When comparing SAT scores, Harvard and Dartmouth are among the most challenging universities to gain admission to. The median SAT scores for their students are 760 for reading and writing and 790 for math. Still, Harvard has half the admission rate (3.2%) compared to Dartmouth (6.4%).
| School | Admission rate (%) | SAT Score: Reading & Writing | SAT Score: Math | Avg Annual Cost* |
|---|---|---|---|---|
| Harvard University | 3.2 | 760 | 790 | $13,259 |
| Columbia University | 3.9 | 750 | 780 | $12,836 |
| Yale University | 4.6 | 760 | 780 | $16,341 |
| Brown University | 5.1 | 760 | 780 | $26,308 |
| Princeton University | 5.7 | 760 | 780 | $11,080 |
| Dartmouth College | 6.4 | 760 | 790 | $33,023 |
| University of Pennsylvania | 6.5 | 750 | 790 | $14,851 |
| Cornell University | 7.5 | 750 | 780 | $29,011 |
*Costs after receiving federal financial aid.
Additionally, Dartmouth has the highest average annual cost at $33,000. Princeton has the lowest at $11,100.
While student debt has surged in the United States in recent years, hitting $1.73 trillion in 2023, the worth of obtaining a degree from any of the schools listed surpasses mere academics. This is evidenced by the substantial incomes earned by former students.
Harvard grads, for example, have the highest average starting salary in the country, at $91,700.

-

 Mining2 weeks ago
Charted: The Value Gap Between the Gold Price and Gold Miners
-

 Real Estate1 week ago
Ranked: The Most Valuable Housing Markets in America
-

 Business1 week ago
Charted: Big Four Market Share by S&P 500 Audits
-

 AI1 week ago
The Stock Performance of U.S. Chipmakers So Far in 2024
-

 Misc1 week ago
Almost Every EV Stock is Down After Q1 2024
-

 Money2 weeks ago
Where Does One U.S. Tax Dollar Go?
-

 Green2 weeks ago
Ranked: Top Countries by Total Forest Loss Since 2001
-

 Real Estate2 weeks ago
Visualizing America’s Shortage of Affordable Homes