Countries
Visualizing the Changing World Population, by Country
Article/Editing:
Visualizing the Changing World Population, by Country
On average, there are 250 babies born every minute around the world. This adds up to over 130 million new human beings entering the world every year.
Then it’s no surprise that the world’s population, which now stands at a whopping 8 billion, has more than tripled since the mid-20th century.
This graphic by Truman Du uses December 2022 population data from the UN and summaries from the French Institute for Demographic Studies (INED) to show the unequal rise and fall of the world’s population by 2050.
Let’s take a closer look at some of these population trends.
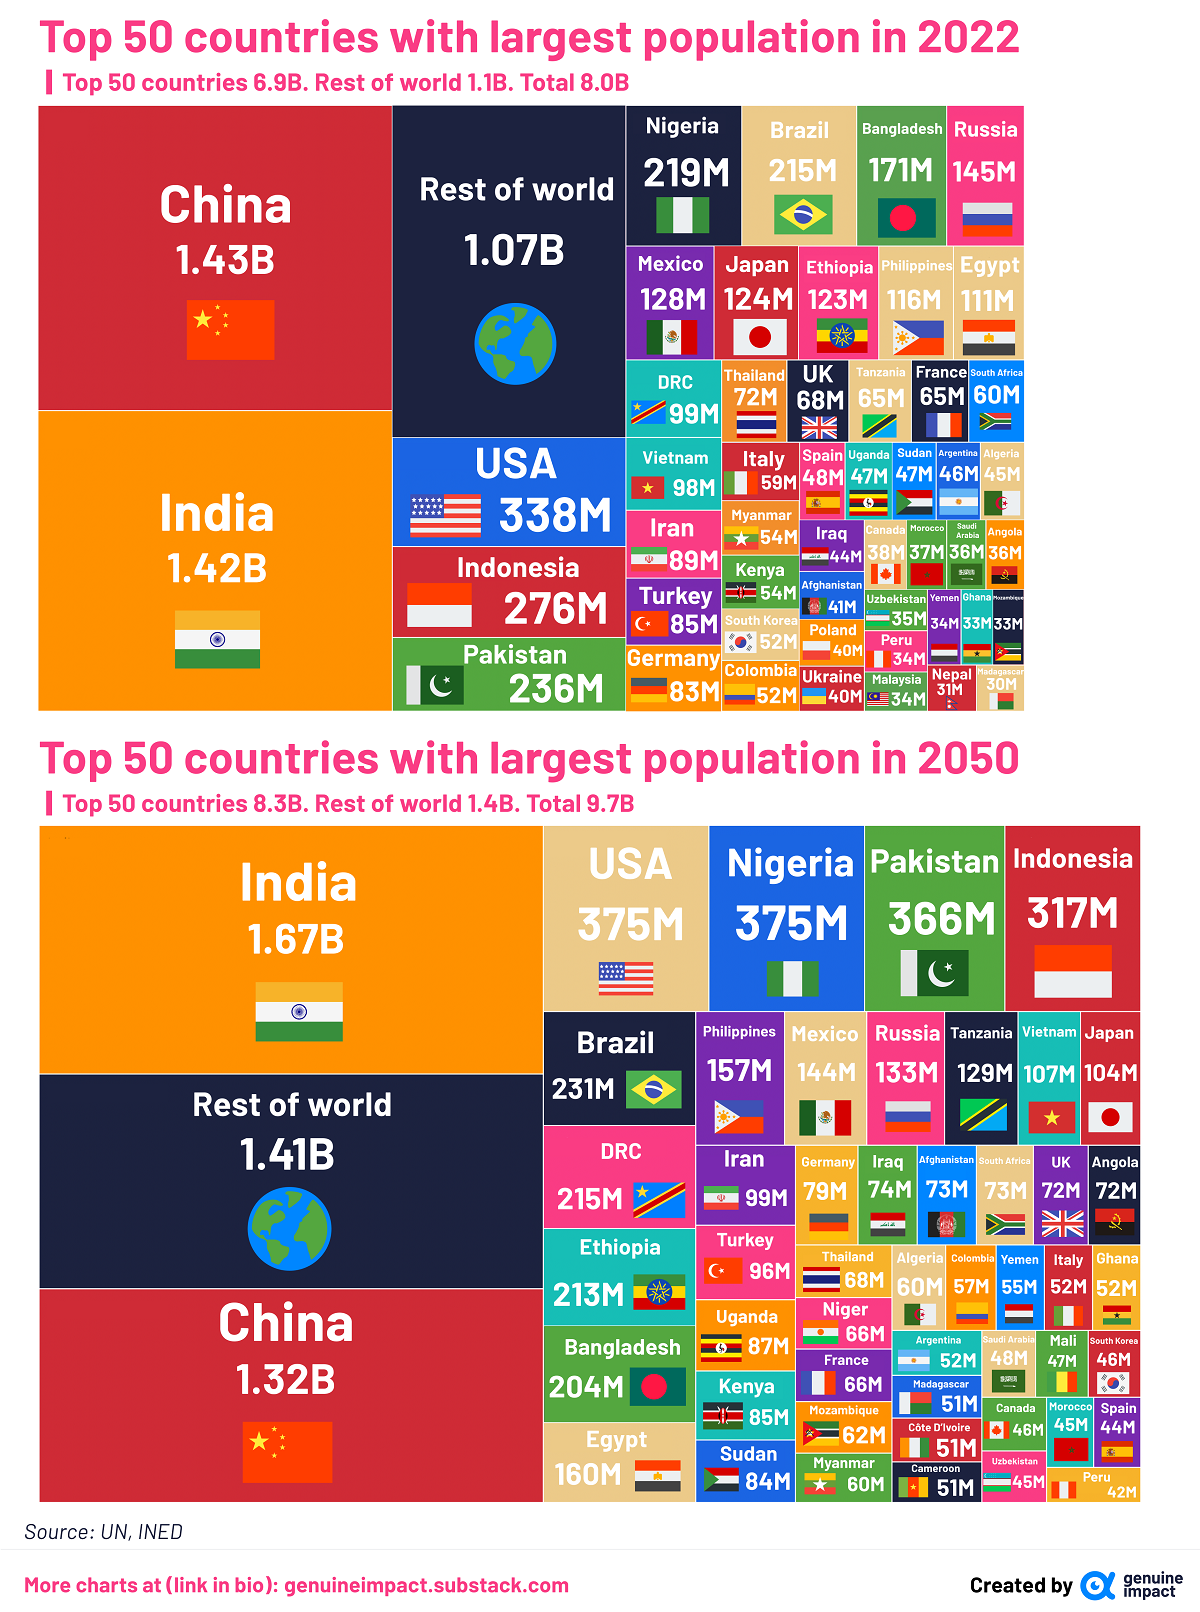
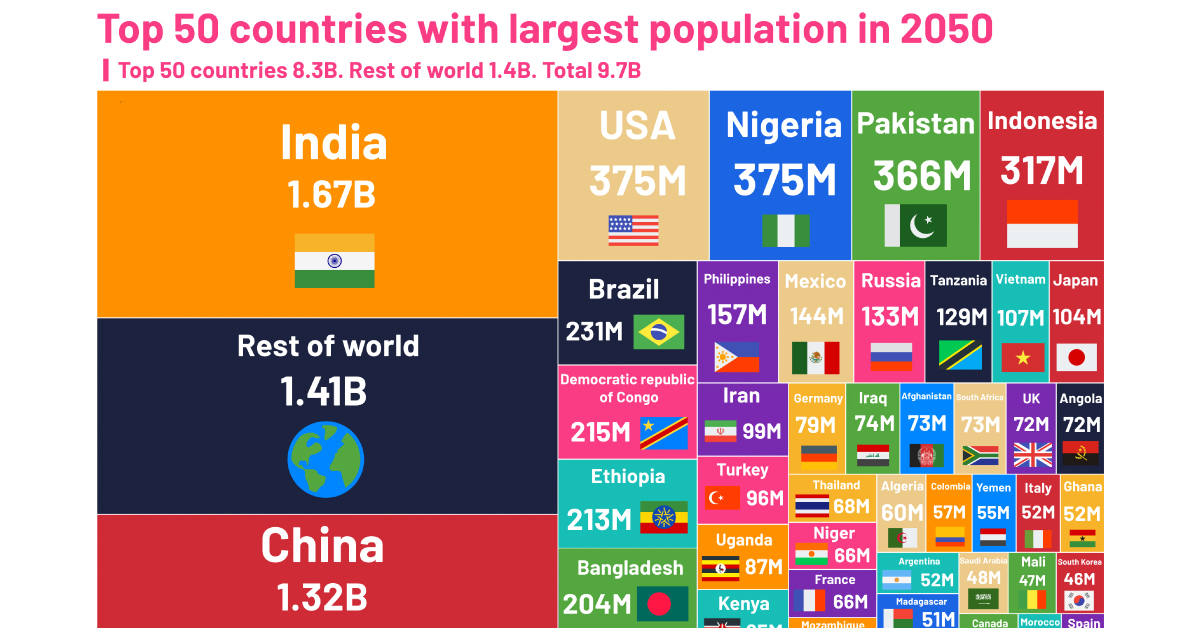
Most Populous Countries: 2022 vs. 2050
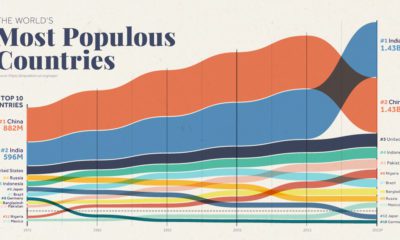
The Asian countries of India and China have topped the rankings of the world’s most populous countries for hundreds of years.
China currently holds the number one spot on this list. But the population of India is expected to surpass that of China’s by later this year, eventually reaching a total of 1.67 billion in 2050.
| Rank | Most Populous Countries (2022) | Population (2022) | Most Populous Countries (2050) | Population (2050) |
|---|---|---|---|---|
| 1 | China | 1.43B | India | 1.67B |
| 2 | India | 1.42B | China | 1.32B |
| 3 | United States of America | 338M | United States of America | 375M |
| 4 | Indonesia | 276M | Nigeria | 375M |
| 5 | Pakistan | 236M | Pakistan | 366M |
| 6 | Nigeria | 219M | Indonesia | 317M |
The United States, Nigeria, Pakistan, and Indonesia are the next most populous countries in 2022, and they are expected to hold onto these spots until 2050. However, they have a long way to go before catching up with the top two, as their combined population doesn’t add up to half that of India and China’s total.
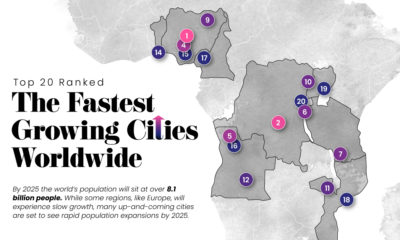
Interestingly, it is estimated that Nigeria’s population will shoot up to 375 million by 2050, almost matching the population of the United States. In 2022, the African country’s population was just around 219 million. This expected spike is largely due to a high birth rate and booming economy, and the resultant rural-to-urban migration.
Countries with Declining Populations
While many countries will be seeing their populations boom over the next three decades, other nations such as China are expected to experience the opposite.
| Country | Population (2022) | Population (2050F) |
|---|---|---|
| China | 1.425 billion | 1.316 billion |
| Japan | 123.9 million | 104.1 million |
| Russian Federation | 144.7 million | 133.4 million |
| Italy | 59.0 million | 52.4 million |
| Republic of Korea | 51.8 million | 45.9 million |
| Germany | 83.4 million | 79.1 million |
| Thailand | 71.7 million | 68.1 million |
| Spain | 47.6 million | 44.3 million |
Several countries in the world are expected to see their populations decline over the next 30 years. And the main reason for this: extremely low birth rates.
South Korea, which has the world’s lowest fertility rate, is expected to see a sharp decline of almost 12% in its population as it falls to 46 million by 2050.
Changing world population trends like this can pose challenges for economies around the world, such as labor shortages, aging populations, and an increasing financial burden on younger generations.

This article was published as a part of Visual Capitalist's Creator Program, which features data-driven visuals from some of our favorite Creators around the world.


Demographics
Population Projections: The World’s 6 Largest Countries in 2075
See how the world’s 6 largest countries will grow (or shrink) by 2075, based on the latest UN population projections.
Population Projections for the World’s 6 Largest Countries
This was originally posted on our Voronoi app. Download the app for free on Apple or Android and discover incredible data-driven charts from a variety of trusted sources.
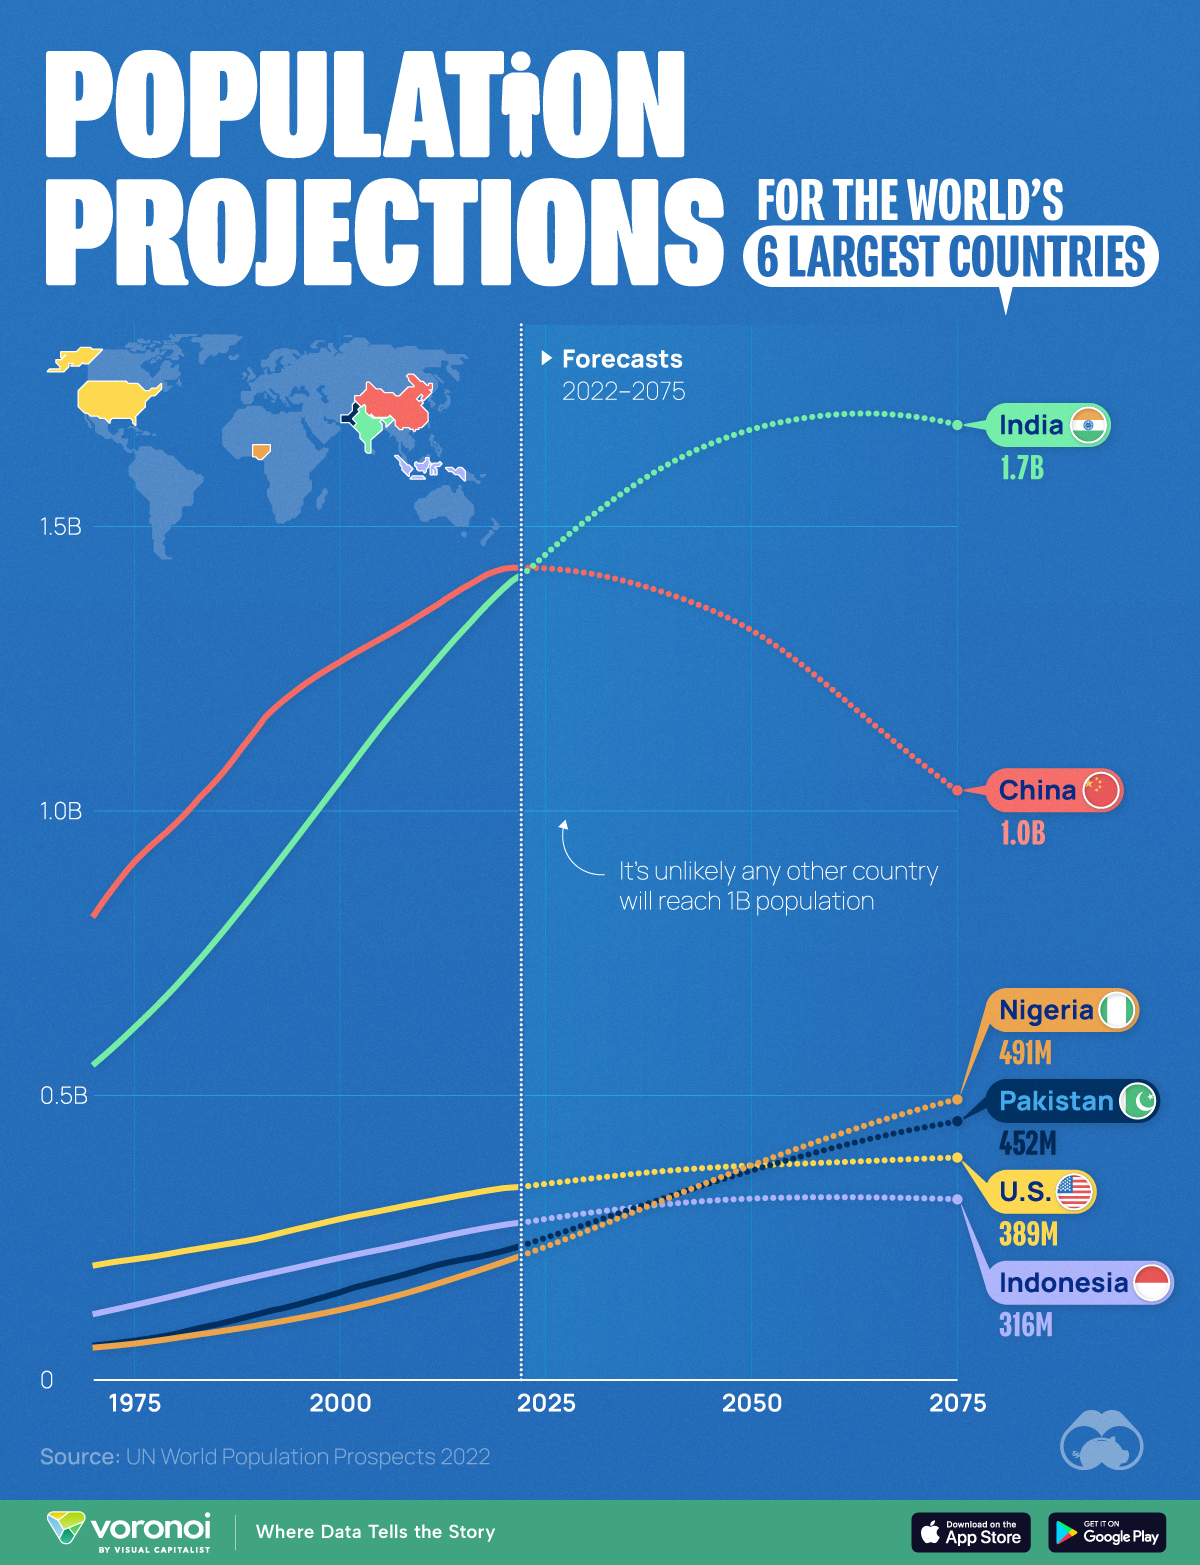
The end of the 21st century will see the first plateauing (and eventually shrinking) of world population since the Industrial Revolution. As birth rates fall across the globe, what does this mean for the world’s most populous countries?
To find out, we visualized forecasts for the world’s six largest countries using data from the latest revised version of the UN World Population Prospects 2022.
Projections are based on a “medium fertility scenario”, which assumes countries will converge at a birth rate of 1.85 children per woman, by 2045-2050.
China’s Projected Population Decline
China’s population boom has officially come to an end, with the country reporting two consecutive years of decreases (down 850,000 in 2022, and 2.1 million in 2023).
| Year | 🇨🇳 China | 🇺🇸 U.S. | 🇮🇩 Indonesia |
|---|---|---|---|
| 1970 | 812M | 199M | 114M |
| 1980 | 975M | 222M | 146M |
| 1990 | 1,144M | 246M | 181M |
| 2000 | 1,260M | 281M | 213M |
| 2010 | 1,344M | 310M | 242M |
| 2020 | 1,424M | 335M | 271M |
| 2030E | 1,417M | 351M | 291M |
| 2040E | 1,380M | 366M | 308M |
| 2050E | 1,317M | 375M | 317M |
| 2060E | 1,211M | 381M | 319M |
| 2070E | 1,091M | 387M | 318M |
| 2075E | 1,035M | 389M | 316M |
Note: Figures are rounded.
The country’s population in 2050 is forecasted to be 1.32 billion, which is roughly the same as it was in 2007. The UN believes this demographic downtrend will accelerate as we enter the second half of the century.
What does this mean for the Chinese economy? Many worry that a smaller workforce, coupled with an aging population, will increase healthcare expenditures and hamper economic growth.
India’s Population Boom Continues
Meanwhile, the UN believes that India’s population will peak somewhere in the mid 2060s, just shy of the 1.7 billion mark.
India’s population will not age as quickly as its neighbor. Those over the age of 65 will represent less than one-fifth of the population until 2060, and their share of India’s total number of people and will not approach 30% until 2100.
| Year | 🇮🇳 India | 🇵🇰 Pakistan | 🇳🇬 Nigeria |
|---|---|---|---|
| 1970 | 551M | 58M | 55M |
| 1980 | 689M | 79M | 72M |
| 1990 | 861M | 114M | 94M |
| 2000 | 1,050M | 152M | 121M |
| 2010 | 1,232M | 192M | 159M |
| 2020 | 1,390M | 225M | 206M |
| 2030E | 1,509M | 272M | 260M |
| 2040E | 1,608M | 320M | 318M |
| 2050E | 1,668M | 366M | 375M |
| 2060E | 1,695M | 406M | 427M |
| 2070E | 1,691M | 439M | 472M |
| 2075E | 1,678M | 452M | 491M |
Note: Figures are rounded.
Finally, whether these predictions come true or not will depend on how quickly birth rates fall as the country develops. For example, India’s fertility rate fell from 6.2 in 1950, to 2.0 in 2021 (births per woman).

-

 Real Estate2 weeks ago
Visualizing America’s Shortage of Affordable Homes
-

 Technology1 week ago
Ranked: Semiconductor Companies by Industry Revenue Share
-

 Money2 weeks ago
Which States Have the Highest Minimum Wage in America?
-

 Real Estate2 weeks ago
Ranked: The Most Valuable Housing Markets in America
-

 Business2 weeks ago
Charted: Big Four Market Share by S&P 500 Audits
-

 AI2 weeks ago
The Stock Performance of U.S. Chipmakers So Far in 2024
-

 Misc2 weeks ago
Almost Every EV Stock is Down After Q1 2024
-

 Money2 weeks ago
Where Does One U.S. Tax Dollar Go?