Technology
Visualizing The 50 Biggest Data Breaches From 2004–2021
Article/Editing:
View high-resolution version of infographic
Visualizing The 50 Biggest Data Breaches From 2004–2021
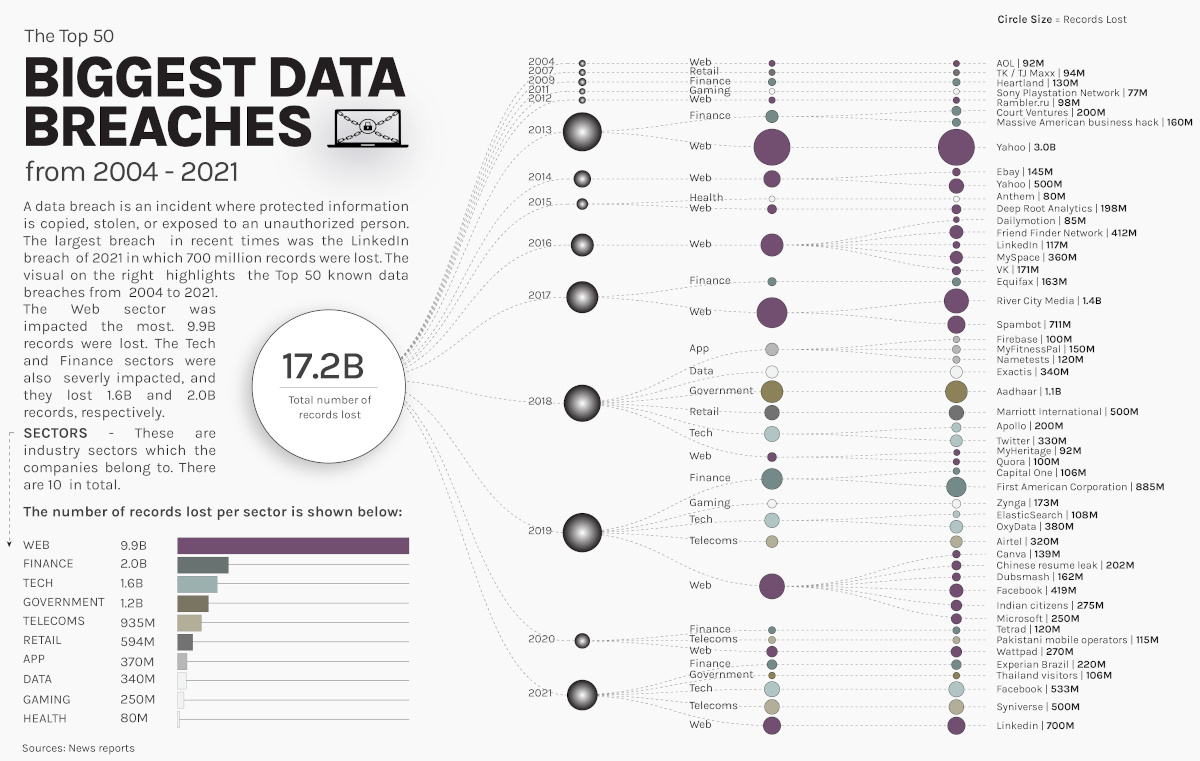
As our world has become increasingly reliant on technology and data stored online, data breaches have become an omnipresent threat to users, businesses, and government agencies. In 2021, a new record was set with more than 5.9 billion user records stolen.
This graphic by Chimdi Nwosu visualizes the 50 largest data breaches since 2004, along with the sectors most impacted. Data was aggregated from company statements and news reports.
Understanding the Basics of Data Breaches
A data breach is an incident in which sensitive or confidential information is copied, transmitted or stolen by an unauthorized entity. This can occur as a result of malware attacks, payment card fraud, insider leaks, or unintended disclosure.
The targeted data is often customer PII (personally identifiable information), employee PII, intellectual property, corporate data or government agency data.
Date breaches can be perpetrated by lone hackers, organized cybercrime groups, or even national governments. Stolen information can then be used in other criminal enterprises such as identity theft, credit card fraud, or held for ransom payment.
Notable Data Breaches Since 2004
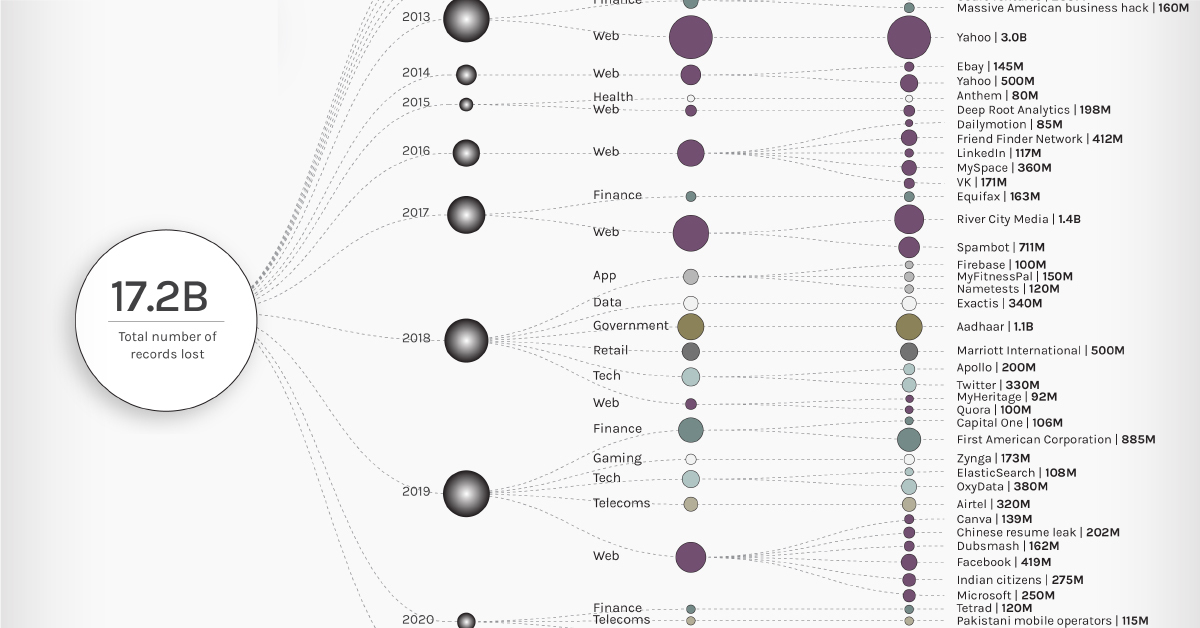
The largest data breach recorded occurred in 2013 when all three billion Yahoo accounts had their information compromised. In that cyberattack, the hackers were able to gather the personal information and passwords of users. While the full extent of the Yahoo data breach is still not fully realized, subsequent cybercrimes across the globe have been linked to the stolen information.
Here are the 50 largest data breaches by amount of user records stolen from 2004–2021.
| Rank | Entity | Sector | Records Compromised | Year |
|---|---|---|---|---|
| 1 | Yahoo | Web | 3.0B | 2013 |
| 2 | River City Media | Web | 1.4B | 2017 |
| 3 | Aadhaar | Government | 1.1B | 2018 |
| 4 | First American Corporation | Finance | 885M | 2019 |
| 5 | Spambot | Web | 711M | 2017 |
| 6 | Web | 700M | 2021 | |
| 7 | Tech | 533M | 2021 | |
| 8 | Yahoo | Web | 500M | 2014 |
| 9 | Marriott International | Retail | 500M | 2018 |
| 10 | Syniverse | Telecoms | 500M | 2021 |
| 11 | Web | 419M | 2019 | |
| 12 | Friend Finder Network | Web | 412M | 2016 |
| 13 | OxyData | Tech | 380M | 2019 |
| 14 | MySpace | Web | 360M | 2016 |
| 15 | Exactis | Data | 340M | 2018 |
| 16 | Tech | 330M | 2018 | |
| 17 | Airtel | Telecoms | 320M | 2019 |
| 18 | Indian citizens | Web | 275M | 2019 |
| 19 | Wattpad | Web | 270M | 2020 |
| 20 | Microsoft | Web | 250M | 2019 |
| 21 | Experian Brazil | Finance | 220M | 2021 |
| 22 | Chinese resume leak | Web | 202M | 2019 |
| 23 | Court Ventures | Finance | 200M | 2013 |
| 24 | Apollo | Tech | 200M | 2018 |
| 25 | Deep Root Analytics | Web | 198M | 2015 |
| 26 | Zynga | Gaming | 173M | 2019 |
| 27 | VK | Web | 171M | 2016 |
| 28 | Equifax | Finance | 163M | 2017 |
| 29 | Dubsmash | Web | 162M | 2019 |
| 30 | Massive American business hack | Finance | 160M | 2013 |
| 31 | MyFitnessPal | App | 150M | 2018 |
| 32 | Ebay | Web | 145M | 2014 |
| 33 | Canva | Web | 139M | 2019 |
| 34 | Heartland | Finance | 130M | 2009 |
| 35 | Nametests | App | 120M | 2018 |
| 36 | Tetrad | Finance | 120M | 2020 |
| 37 | Web | 117M | 2016 | |
| 38 | Pakistani mobile operators | Telecoms | 115M | 2020 |
| 39 | ElasticSearch | Tech | 108M | 2019 |
| 40 | Capital One | Finance | 106M | 2019 |
| 41 | Thailand visitors | Government | 106M | 2021 |
| 42 | Firebase | App | 100M | 2018 |
| 43 | Quora | Web | 100M | 2018 |
| 44 | Rambler.ru | Web | 98M | 2012 |
| 45 | TK / TJ Maxx | Retail | 94M | 2007 |
| 46 | MyHeritage | Web | 92M | 2018 |
| 47 | AOL | Web | 92M | 2004 |
| 48 | Dailymotion | Web | 85M | 2016 |
| 49 | Anthem | Health | 80M | 2015 |
| 50 | Sony Playstation Network | Gaming | 77M | 2011 |
The massive Yahoo hack accounted for roughly 30% of the 9.9 billion user records stolen from the Web sector—by far the most impacted sector. The next most-impacted sectors were Tech and Finance, with 2 billion and 1.6 billion records stolen, respectively.
Although these three sectors had the highest totals of user data lost, that doesn’t necessarily imply they have weaker security measures. Instead, it can probably be attributed to the sheer number of user records they compile.
Not all infamous data breaches are of a large scale. A smaller data breach in 2014 made headlines when Apple’s iCloud was hacked and the personal pictures of roughly 200 celebrities were disseminated across the internet. Although this highly targeted hack only affected a few hundred people, it highlighted how invasive and damaging data breaches can be to users.
The Cost of Data Breaches to Businesses
Every year data breaches cost businesses billions of dollars to prevent and contain, while also eroding consumer trust and potentially having an adverse effect on customer retention.
A 2021 IBM security report estimated that the average cost per data breach for companies in 2020 was $4.2 million, which represents a 10% increase from 2019. That increase is mainly attributed to the added security risk associated with having more people working remotely due to the COVID-19 pandemic.
Measures to Improve Data Security
Completely preventing data breaches is essentially impossible, as cybercrime enterprises are often persistent, dynamic, and sophisticated. Nevertheless, businesses can seek out innovative methods to prevent exposure of data and mitigate potential damages.
For example, after the iCloud attack in 2014, Apple began avidly encouraging users to adopt two-factor authentication in an effort to strengthen data security.
Regardless of the measures businesses take, the unfortunate reality is that data breaches are a cost of doing business in the modern world and will continue to be a concern to both companies and users.

This article was published as a part of Visual Capitalist's Creator Program, which features data-driven visuals from some of our favorite Creators around the world.


Technology
Ranked: Semiconductor Companies by Industry Revenue Share
Nvidia is coming for Intel’s crown. Samsung is losing ground. AI is transforming the space. We break down revenue for semiconductor companies.


Semiconductor Companies by Industry Revenue Share
This was originally posted on our Voronoi app. Download the app for free on Apple or Android and discover incredible data-driven charts from a variety of trusted sources.
Did you know that some computer chips are now retailing for the price of a new BMW?
As computers invade nearly every sphere of life, so too have the chips that power them, raising the revenues of the businesses dedicated to designing them.
But how did various chipmakers measure against each other last year?
We rank the biggest semiconductor companies by their percentage share of the industry’s revenues in 2023, using data from Omdia research.
Which Chip Company Made the Most Money in 2023?
Market leader and industry-defining veteran Intel still holds the crown for the most revenue in the sector, crossing $50 billion in 2023, or 10% of the broader industry’s topline.
All is not well at Intel, however, with the company’s stock price down over 20% year-to-date after it revealed billion-dollar losses in its foundry business.
| Rank | Company | 2023 Revenue | % of Industry Revenue |
|---|---|---|---|
| 1 | Intel | $51B | 9.4% |
| 2 | NVIDIA | $49B | 9.0% |
| 3 | Samsung Electronics | $44B | 8.1% |
| 4 | Qualcomm | $31B | 5.7% |
| 5 | Broadcom | $28B | 5.2% |
| 6 | SK Hynix | $24B | 4.4% |
| 7 | AMD | $22B | 4.1% |
| 8 | Apple | $19B | 3.4% |
| 9 | Infineon Tech | $17B | 3.2% |
| 10 | STMicroelectronics | $17B | 3.2% |
| 11 | Texas Instruments | $17B | 3.1% |
| 12 | Micron Technology | $16B | 2.9% |
| 13 | MediaTek | $14B | 2.6% |
| 14 | NXP | $13B | 2.4% |
| 15 | Analog Devices | $12B | 2.2% |
| 16 | Renesas Electronics Corporation | $11B | 1.9% |
| 17 | Sony Semiconductor Solutions Corporation | $10B | 1.9% |
| 18 | Microchip Technology | $8B | 1.5% |
| 19 | Onsemi | $8B | 1.4% |
| 20 | KIOXIA Corporation | $7B | 1.3% |
| N/A | Others | $126B | 23.2% |
| N/A | Total | $545B | 100% |
Note: Figures are rounded. Totals and percentages may not sum to 100.
Meanwhile, Nvidia is very close to overtaking Intel, after declaring $49 billion of topline revenue for 2023. This is more than double its 2022 revenue ($21 billion), increasing its share of industry revenues to 9%.
Nvidia’s meteoric rise has gotten a huge thumbs-up from investors. It became a trillion dollar stock last year, and broke the single-day gain record for market capitalization this year.
Other chipmakers haven’t been as successful. Out of the top 20 semiconductor companies by revenue, 12 did not match their 2022 revenues, including big names like Intel, Samsung, and AMD.
The Many Different Types of Chipmakers
All of these companies may belong to the same industry, but they don’t focus on the same niche.
According to Investopedia, there are four major types of chips, depending on their functionality: microprocessors, memory chips, standard chips, and complex systems on a chip.
Nvidia’s core business was once GPUs for computers (graphics processing units), but in recent years this has drastically shifted towards microprocessors for analytics and AI.
These specialized chips seem to be where the majority of growth is occurring within the sector. For example, companies that are largely in the memory segment—Samsung, SK Hynix, and Micron Technology—saw peak revenues in the mid-2010s.

-

 Mining2 weeks ago
Charted: The Value Gap Between the Gold Price and Gold Miners
-

 Real Estate1 week ago
Ranked: The Most Valuable Housing Markets in America
-

 Business1 week ago
Charted: Big Four Market Share by S&P 500 Audits
-

 AI1 week ago
The Stock Performance of U.S. Chipmakers So Far in 2024
-

 Misc1 week ago
Almost Every EV Stock is Down After Q1 2024
-

 Money2 weeks ago
Where Does One U.S. Tax Dollar Go?
-

 Green2 weeks ago
Ranked: Top Countries by Total Forest Loss Since 2001
-

 Real Estate2 weeks ago
Visualizing America’s Shortage of Affordable Homes