Demographics
Visualizing the World’s Most Popular Religions
Article/Editing:
Visualizing the World’s Most Popular Religions
According to some estimates, there are over 4,000 religions, faiths groups, and denominations that exist around the world today. Researchers and academics generally categorize the world’s religions into five major groups: Christianity, Islam, Buddhism, Hinduism, and Judaism.
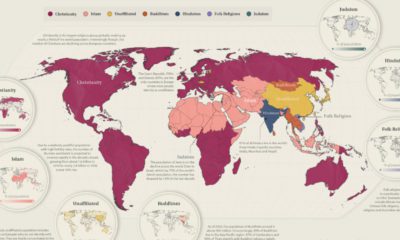
This graphic by Chit Chart visualizes the most popular religions around the world, using the latest available data from Index Mundi’s world demographics.
In addition to the five major religious groups, the graphic includes two more categories: one for a collective of Folk religions and another for people who are unaffiliated with a religion.
The Religions with the Most Followers
Although the number of people who follow a religion has decreased in recent decades, 82.8% of the global population still identifies with one of the world’s major religions.
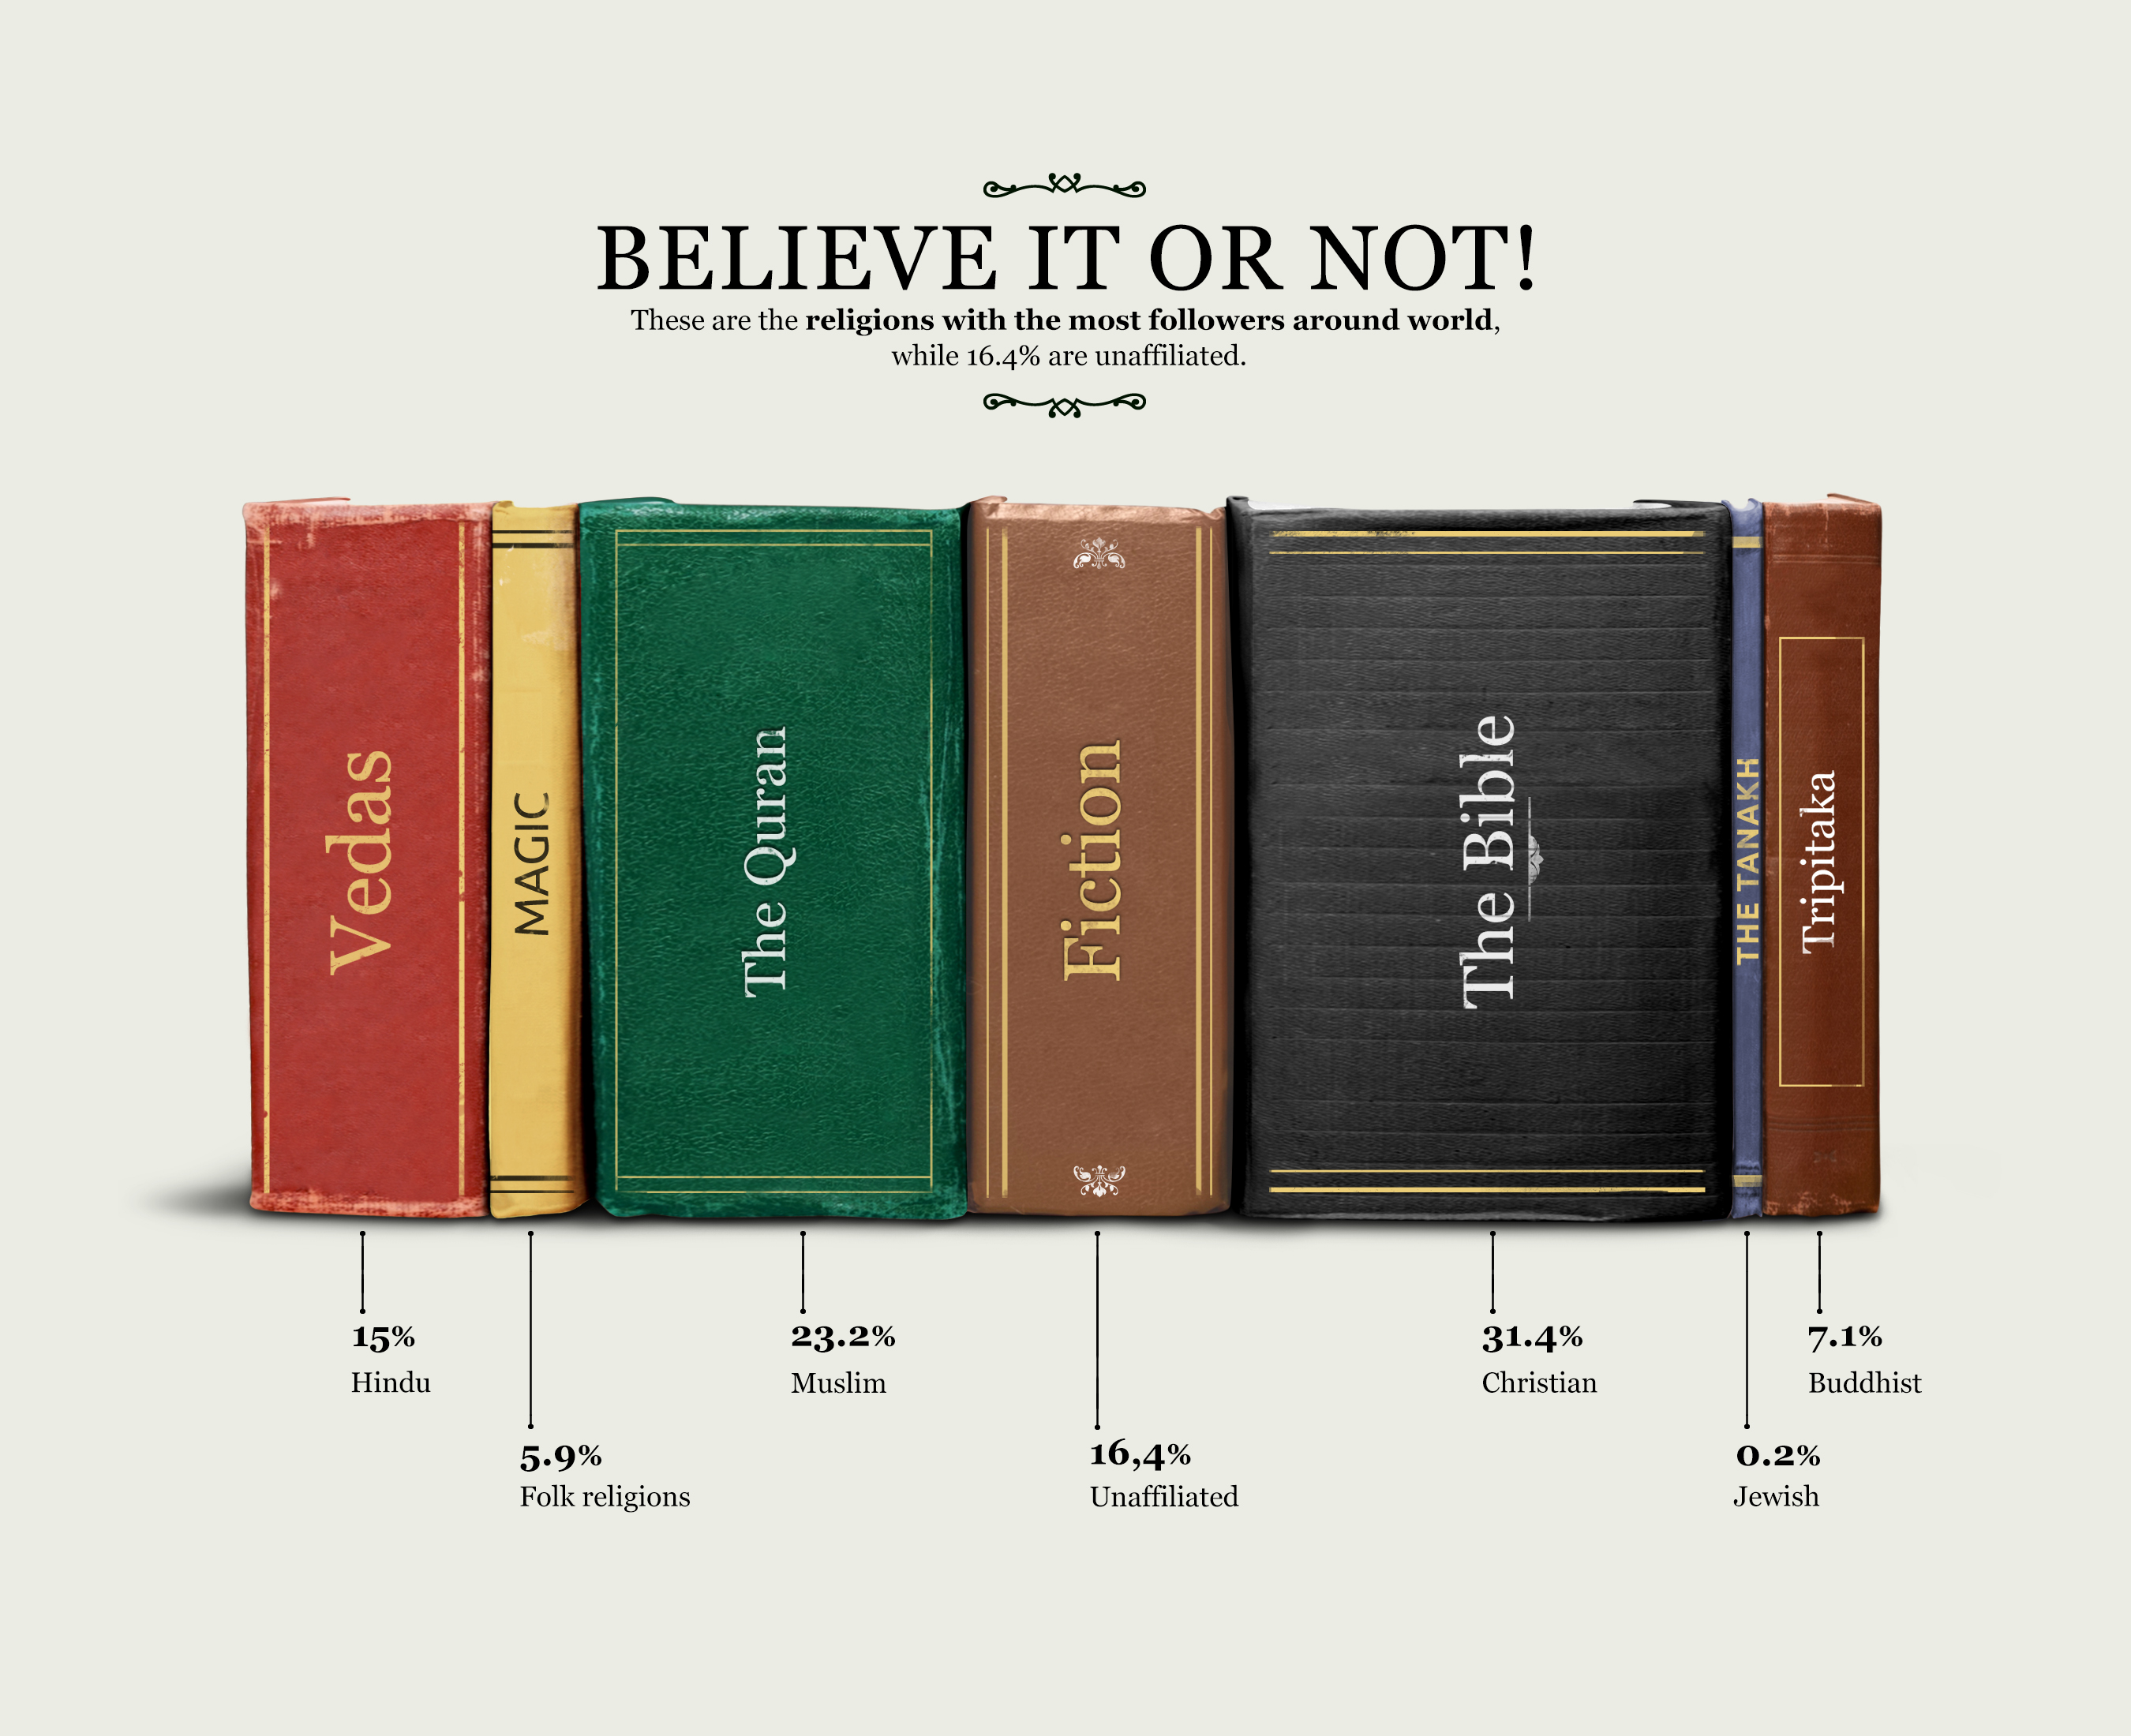
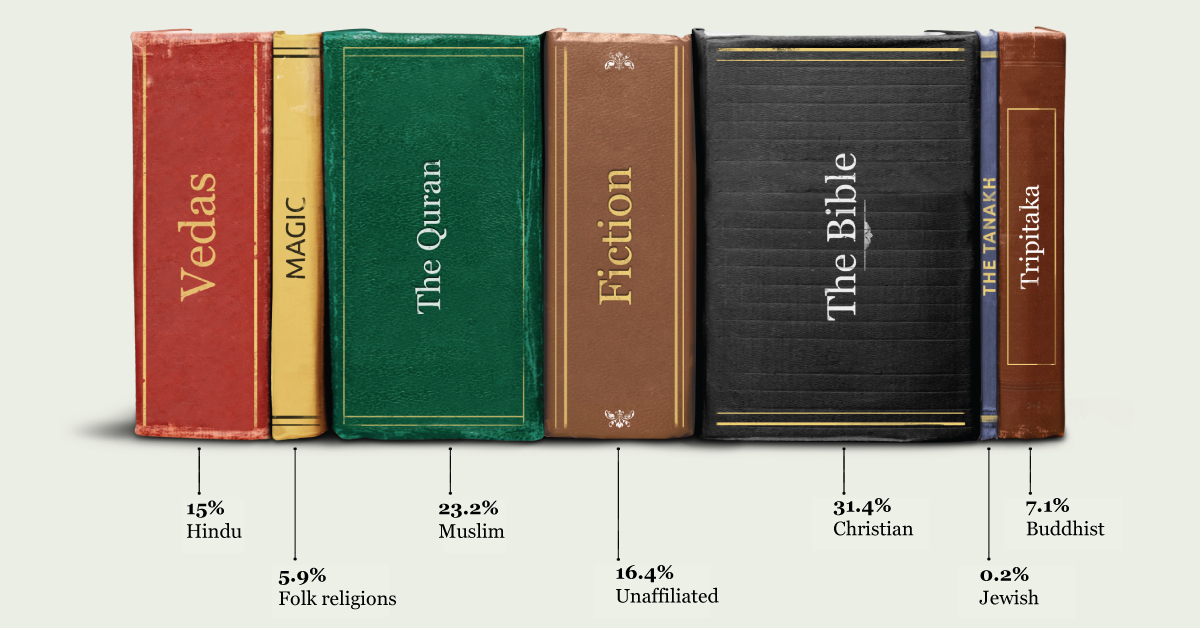
Here’s a breakdown of the most popular religions, ranked by their following as a percentage of the world’s population:
| Rank | Religion | % of World’s Population |
|---|---|---|
| 1 | Christian | 31.4% |
| 2 | Muslim | 23.2% |
| 3 | Unaffiliated | 16.4% |
| 4 | Hindu | 15.0% |
| 5 | Buddhist | 7.1% |
| 6 | Folk Religions | 5.9% |
| 7 | Jewish | 0.2% |
| 8 | Other | 0.8% |
Christianity has the largest following with approximately 31% of the global population. Muslims make up the second-largest religious group, accounting for 23.2% of the world’s population.
Roughly 16.4% of the global population is unaffiliated with a religion. This figure exceeds the percentage of people who identify with Hinduism (15%), Buddhism (7.1%), Folk Religions (5.9%), or Judaism (0.2%).
The World’s Religions from Oldest to Newest
Hinduism is considered the oldest religion in the world, originating in the Indus River Valley (modern-day Pakistan) circa 7000 BCE.
While Judaism came after Hinduism, it is thought to be the oldest of the three monotheistic Abrahamic faiths, making it older than Christianity and Islam.
It began circa 2000 BCE in the Southern Levant (modern-day Israel, Palestine, and Jordan). By contrast, Christianity was founded in the 1st century and began as a movement within Judaism.
Scholars typically date the creation of Islam to the 7th century, making it the youngest of the world’s major religions on this list. Islam was established in Mecca (modern-day Saudi-Arabia).
One religion that’s not included on this list is Sikhism. Founded in the late 15th century, it’s relatively new, especially compared to other religions like Hinduism or Judaism. Yet, despite being new, Sikhism has a large following—according to some estimates, there are over 25 million Sikhs worldwide.
What are Folk Religions?
A folk religion is defined as an ethnic or cultural practice that exists outside the theological doctrine of organized religions.
Lacking sacred texts, Folk religions are more concerned with spirituality than rituals or rites. Examples of Folk religions include Native American traditions, Chinese folk religions, and traditional African religions.
Since Folk religions are less institutionalized, they are especially challenging to measure and often excluded from surveys. With that said, an estimated 5.9% of the global population (approximately 430 million people) practice a Folk religion.
The Fastest-Growing Religions
While Islam is the newest of the big five religions, it’s currently the world’s fastest-growing one too. For context, here’s the estimated percent change among the seven religion categories, between 2015 and 2060:
| Rank | Religious Group | Est. % change in population size (2015-2060) |
|---|---|---|
| 1 | Muslims | 70% |
| 2 | Christians | 34% |
| 3 | Hindus | 27% |
| 4 | Jews | 15% |
| 5 | Folk religions | 5% |
| 6 | Unaffiliated | 3% |
| 7 | Buddhists | -7% |
Islam’s rapid growth means it may surpass Christianity as the world’s largest religion within the next half-century. What’s causing this growth?
According to Pew Research Center, the main reason is simply demographics—on average, Muslim women have 2.9 children, which the average of all non-Muslims is 2.2.
Muslims are also concentrated in Africa and the Middle East, the two regions predicted to have the highest population increases in the next few decades.

This article was published as a part of Visual Capitalist's Creator Program, which features data-driven visuals from some of our favorite Creators around the world.


Demographics
The Countries That Have Become Sadder Since 2010
Tracking Gallup survey data for more than a decade reveals some countries are witnessing big happiness declines, reflecting their shifting socio-economic conditions.


The Countries That Have Become Sadder Since 2010
This was originally posted on our Voronoi app. Download the app for free on iOS or Android and discover incredible data-driven charts from a variety of trusted sources.
Can happiness be quantified?
Some approaches that try to answer this question make a distinction between two differing components of happiness: a daily experience part, and a more general life evaluation (which includes how people think about their life as a whole).
The World Happiness Report—first launched in 2012—has been making a serious go at quantifying happiness, by examining Gallup poll data that asks respondents in nearly every country to evaluate their life on a 0–10 scale. From this they extrapolate a single “happiness score” out of 10 to compare how happy (or unhappy) countries are.
More than a decade later, the 2024 World Happiness Report continues the mission. Its latest findings also include how some countries have become sadder in the intervening years.
Which Countries Have Become Unhappier Since 2010?
Afghanistan is the unhappiest country in the world right now, and is also 60% unhappier than over a decade ago, indicating how much life has worsened since 2010.
In 2021, the Taliban officially returned to power in Afghanistan, after nearly two decades of American occupation in the country. The Islamic fundamentalist group has made life harder, especially for women, who are restricted from pursuing higher education, travel, and work.
On a broader scale, the Afghan economy has suffered post-Taliban takeover, with various consequent effects: mass unemployment, a drop in income, malnutrition, and a crumbling healthcare system.
| Rank | Country | Happiness Score Loss (2010–24) | 2024 Happiness Score (out of 10) |
|---|---|---|---|
| 1 | 🇦🇫 Afghanistan | -2.6 | 1.7 |
| 2 | 🇱🇧 Lebanon | -2.3 | 2.7 |
| 3 | 🇯🇴 Jordan | -1.5 | 4.2 |
| 4 | 🇻🇪 Venezuela | -1.3 | 5.6 |
| 5 | 🇲🇼 Malawi | -1.2 | 3.4 |
| 6 | 🇿🇲 Zambia | -1.2 | 3.5 |
| 7 | 🇧🇼 Botswana | -1.2 | 3.4 |
| 8 | 🇾🇪 Yemen | -1.0 | 3.6 |
| 9 | 🇪🇬 Egypt | -1.0 | 4.0 |
| 10 | 🇮🇳 India | -0.9 | 4.1 |
| 11 | 🇧🇩 Bangladesh | -0.9 | 3.9 |
| 12 | 🇨🇩 DRC | -0.7 | 3.3 |
| 13 | 🇹🇳 Tunisia | -0.7 | 4.4 |
| 14 | 🇨🇦 Canada | -0.6 | 6.9 |
| 15 | 🇺🇸 U.S. | -0.6 | 6.7 |
| 16 | 🇨🇴 Colombia | -0.5 | 5.7 |
| 17 | 🇵🇦 Panama | -0.5 | 6.4 |
| 18 | 🇵🇰 Pakistan | -0.5 | 4.7 |
| 19 | 🇿🇼 Zimbabwe | -0.5 | 3.3 |
| 20 | 🇮🇪 Ireland | -0.5 | 6.8 |
| N/A | 🌍 World | +0.1 | 5.5 |
Nine countries in total saw their happiness score drop by a full point or more, on the 0–10 scale.
Noticeably, many of them have seen years of social and economic upheaval. Lebanon, for example, has been grappling with decades of corruption, and a severe liquidity crisis since 2019 that has resulted in a banking system collapse, sending poverty levels skyrocketing.
In Jordan, unprecedented population growth—from refugees leaving Iraq and Syria—has aggravated unemployment rates. A somewhat abrupt change in the line of succession has also raised concerns about political stability in the country.

-

 Markets1 week ago
U.S. Debt Interest Payments Reach $1 Trillion
-

 Business2 weeks ago
Charted: Big Four Market Share by S&P 500 Audits
-

 Real Estate2 weeks ago
Ranked: The Most Valuable Housing Markets in America
-

 Money2 weeks ago
Which States Have the Highest Minimum Wage in America?
-

 AI2 weeks ago
Ranked: Semiconductor Companies by Industry Revenue Share
-

 Markets2 weeks ago
Ranked: The World’s Top Flight Routes, by Revenue
-

 Demographics2 weeks ago
Population Projections: The World’s 6 Largest Countries in 2075
-

 Markets2 weeks ago
The Top 10 States by Real GDP Growth in 2023