wildlife
Visualizing Orangutans: The Most Endangered Great Ape
Article/Editing:
Click to view this graphic in a higher-resolution.
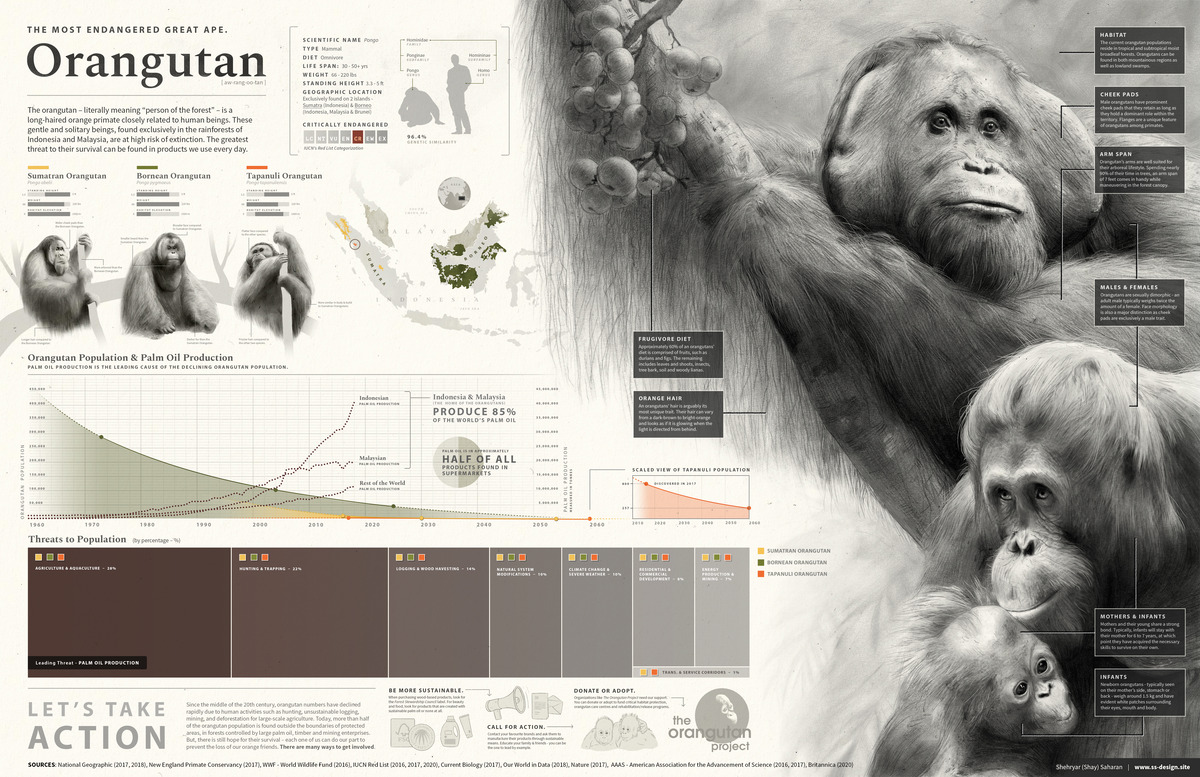
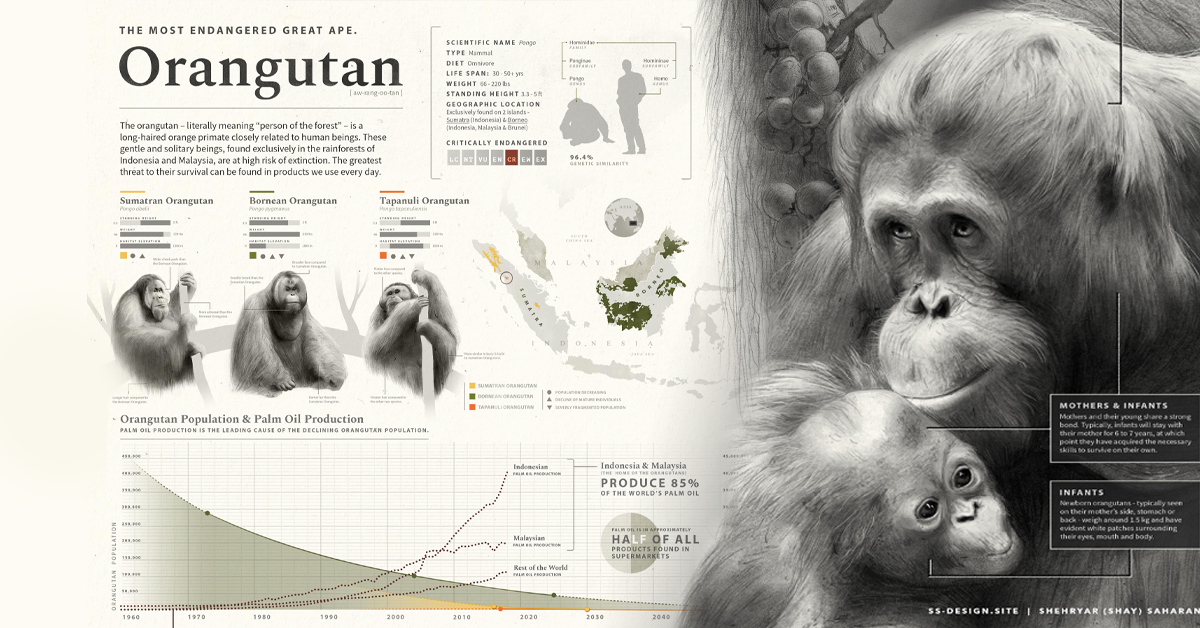
Orangutan: The Most Endangered Great Ape
Just 50 years ago, millions of our orange-haired relatives—the orangutans—populated Earth.
But over the past five decades, these numbers have declined by 50%, and orangutans are estimated to completely disappear in the next 50 years. Currently, the world’s most endangered great ape is on a path to extinction.
This illustrated graphic by Shehryar Saharan uses a wide range of information to highlight the threats that led to the downfall of the world’s orangutans, and what can be done to prevent their extinction. Sources include National Geographic, the New England Primate Conservancy, WWF, the IUCN Red List, Current Biology, Our World in Data, Nature, AAAS, and Britannica.
Where Are the Orangutans?
These long-haired, orange, and gentle primates are closely related to humans. They are extremely intelligent, and also crucial to the ecosystem as they help spread the seeds of trees in the forests they inhabit.
Found exclusively in the rainforests of Indonesia and Malaysia, these tree-dwellers are Asia’s only great apes. Their three species are all found on the islands of Sumatra and Borneo.
| Species | Scientific name | Location | Distinct Physical Features |
|---|---|---|---|
| Sumatran Orangutan | Pongo abelii | Sumatra (Indonesia) | Wide cheek pads, longer hair. |
| Bornean Orangutan | Pongo pygmaeus | Island of Borneo (Indonesia and Malaysia) | Small beard, broad face, dark fur. |
| Tapanuli Orangutan | Pongo tapanuliensis | Sumatra (Indonesia) | Flat face, Frizzy hair. |
Bornean Orangutans
The dark reddish-haired Bornean Orangutans are more likely than the others to come down from their trees and travel the ground in search of fruit. According to the IUCN, their population declined by over 50% in the past 40 years to a range of 55,000‒104,700, making it a critically endangered species.
Sumatran Orangutans
More social than their Bornean cousins, Sumatran Orangutans are often seen feasting on fig trees in large groups and don’t need to travel the ground. Historically distributed over the entire massive island of Sumatra and further south into Java, the species’ range is now restricted to the north of the big island.
Tapanuli Orangutan
Discovered in North Sumatra in 2017, the Tapanuli Orangutan is the newest-discovered great ape and the rarest one. With an estimated population of just 800 surviving individuals, these critically-endangered apes are teetering on the brink of extinction.
Threats
Like wildlife across the world, the orangutan population is threatened by factors like climate change, forest fires, and urbanization and development.
| Threats to Orangutans | Estimated Population Impacted |
|---|---|
| Agriculture and Aquaculture | 28% |
| Hunting and Trapping | 22% |
| Logging and Wood Harvesting | 14% |
| Natural System Modifications | 10% |
| Climate Change and Severe Weather | 10% |
| Residential and Commercial Development | 8% |
| Energy Production and Mining | 7% |
| Transport and Service Corridors | 1% |
However, the biggest drivers are the orangutan’s loss of habitat due to palm oil production, deforestation, as well as hunting and trapping.
Over the past 20 years, orangutans have lost over 80% of their habitat to deforestation for palm plantations, agriculture, mining, and infrastructure. One palm oil plantation can require thousands of hectares of tropical forests to be bulldozed.
Forced into a smaller areas with less food and shelter, the rest are in a constant game of hide and seek with hunters and poachers looking to capture them for food, artefacts, and the illegal pet trade of baby orangutans.
Our Role in Their Conservation
From lipsticks and body lotion to biofuels and wood, many items we use drive deforestation for their creation.
In the case of orangutans, avoiding items that use the very palm oil produced in plantations that destroy their habitats plays a big role.
On a larger scale, there are organizations like The Orangutan Project that are campaigning to end the deforestation of orangutan habitats and conserve the depleting population.

This article was published as a part of Visual Capitalist's Creator Program, which features data-driven visuals from some of our favorite Creators around the world.


Misc
Visualizing the Biomass of All the World’s Mammals
When the world’s biomass—the stuff we’re made of—is tallied up, humans and cattle outweigh wild mammals by a massive margin.
Visualizing the Biomass of All the World’s Mammals
Even as we understand more about the world we live in, certain aspects of it remain undefined or hard to comprehend.
One such example is in the scale and distribution of Earth’s life. What’s the ratio of wild to domesticated animals? How much do all of the world’s humans weigh?
Until recently, such questions were nearly unanswerable. A new report titled The Global Biomass of Wild Mammals helps shed more light on the composition and scale of life on our planet. The research provides an estimate of the biomass of all mammals, globally—including humans.
So, What is Biomass Anyway?
Biomass is simply the weight of living things.
In this study, researchers
created rough estimates for four major categories of mammals: humans, domesticated animals, and those that were found in wild terrestrial and marine environments. A further breakdown of mammal groups are found within each category.
To achieve this, they took the estimated number of species from census data and multiplied it with each species’ average body mass.
One component worth pointing out is that animals contribute very different amounts to the world’s biomass total. For example, whales significantly outweigh rodents in terms of biomass, even though there are fewer species and populations of whales. The fact that whales are so much larger than rodents means that even smaller populations can contribute a meaningful portion to overall biomass.
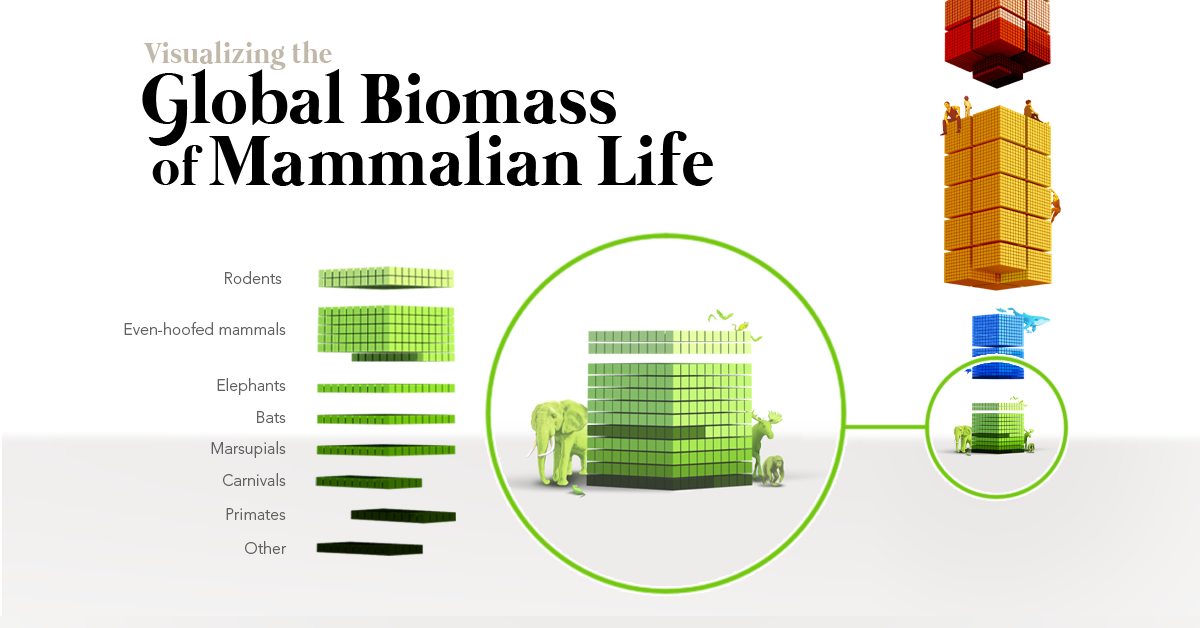
Mammalian Biomass, Organized Neatly
Each larger cube above represents 20 million metric tons of carbon, and the entirety of the visualization represents all living mammalian life on Earth.
The paper separates mammals into four distinct categories:
| Category | Total Mass (Mt) | Top Sub-Category |
|---|---|---|
| Domesticated Mammals | 651 | Cattle (416 Mt) |
| Humans | 394 | n/a |
| Wild Marine Mammals | 40 | Baleen Whales (23 Mt) |
| Wild Terrestrial Mammals | 24 | Even-Hoofed Mammals (11 Mt) |
| Total | 1,109 |
One of the most obvious takeaways from this data is that humans make up one-third of total mammalian biomass.
Perhaps even more strikingly, the animals we’ve domesticated for food, companionship, and labor make up close to 60% of the total weight of Earth’s mammals. Domesticated dogs and cats alone equal the total weight of all other wild land mammals combined.
The world’s sheep, on their own, weigh as much as all the whales and seals in the ocean. Domesticated buffalo such as the water buffalo, a species commonly found in Asia, combine to have the third largest biomass of all mammals.
Finally, there’s one category of mammal that comes way out on top.
Cattle Planet
The global livestock population has risen along with the human population, and cattle are now the top mammal in the world by weight.
In fact, just the United States’ share of cattle matches the biomass of all wild mammals on Earth.
As the standard of living continues to rise for people around the world, beef consumption has been increasing in many developing countries. Of course, raising cattle is a resource and land intensive operation, and there have been very real impacts on a global scale. For one, cows are a major source of methane emissions. As well, in Brazil, which accounts for around 25% of the world’s cattle population, pasture has directly replaced large swaths of rainforest habitat.
Waning Wildlife
At the very bottom of the visualization, dwarfed by humans and domesticated mammals, lies the vast array of wild mammals that live on planet Earth.
It’s sobering to see that the biomass of North America’s human population alone compares closely with that of all terrestrial wild mammals in the world. This includes plentiful creatures like rats and mice, as well as large mammals like elephants and bears.
Below are the top 10 wild mammalian contributors to biomass in the natural world.
| Rank | Contributor | Total Mass (Mt) | Individuals (millions) |
|---|---|---|---|
| #1 | Fin Whales | 8 | 0.1 |
| #2 | Sperm Whales | 7 | 0.4 |
| #3 | Humpback Whales | 4 | 0.1 |
| #4T | Antarctic Minke Whales | 3 | 0.5 |
| #4T | Blue Whales | 3 | 0.05 |
| #6 | White-Tailed Deer | 2.7 | 45 |
| #7 | Crabeater Seals | 2.0 | 10 |
| #8 | Wild Boar | 1.9 | 30 |
| #9T | African Elephants | 1.3 | 0.5 |
| #9T | Bryde's Whales | 1.3 | 0.1 |
In the ocean, whales and seals are the heavyweight champions. On land, deer, and boar come out on top as they are both heavy and plentiful.
Humans have a complicated relationship with large mammals. We feel a very clear connection to these creatures, and they are often the key figures in conservation efforts. That said, even small populations of humans have wiped out large mammal species in the past.
The news that cattle outweigh wild land animals by a factor of 20:1 is a reminder that human influence is perhaps even more powerful than we think.
The more we’re exposed to nature’s full splendor […] the more we might be tempted to imagine that nature is an endless and inexhaustible resource. In reality, the weight of all remaining wild land mammals is less than 10% of humanity’s combined weight. – Ron Milo, Professor of Systems Biology
Source: The global biomass of wild mammals
Data notes: To come up with the numbers above, scientists estimated the total biomass of wild mammals on Earth by manually collecting population estimates for 392 land mammal species, which make up about 6% of all wild land mammal species, and using machine learning to infer the global populations of the remaining 94%. Their estimate includes 4,805 wild land mammal species out of approximately 6,400 known and extant wild land mammal species, excluding low-abundance species for which data are scarce.

-

 Markets1 week ago
U.S. Debt Interest Payments Reach $1 Trillion
-

 Markets2 weeks ago
Ranked: The Most Valuable Housing Markets in America
-

 Money2 weeks ago
Which States Have the Highest Minimum Wage in America?
-

 AI2 weeks ago
Ranked: Semiconductor Companies by Industry Revenue Share
-

 Markets2 weeks ago
Ranked: The World’s Top Flight Routes, by Revenue
-

 Countries2 weeks ago
Population Projections: The World’s 6 Largest Countries in 2075
-

 Markets2 weeks ago
The Top 10 States by Real GDP Growth in 2023
-

 Money2 weeks ago
The Smallest Gender Wage Gaps in OECD Countries