Green
Which Countries Pollute the Most Ocean Plastic Waste?
Article/Editing:
Visualized: Ocean Plastic Waste Pollution By Country
Millions of metric tons of plastic are produced worldwide every year. While half of this plastic waste is recycled, incinerated, or discarded into landfills, a significant portion of what remains eventually ends up in our oceans.
In fact, many pieces of ocean plastic waste have come together to create a vortex of plastic waste thrice the size of France in the Pacific Ocean between California and Hawaii.
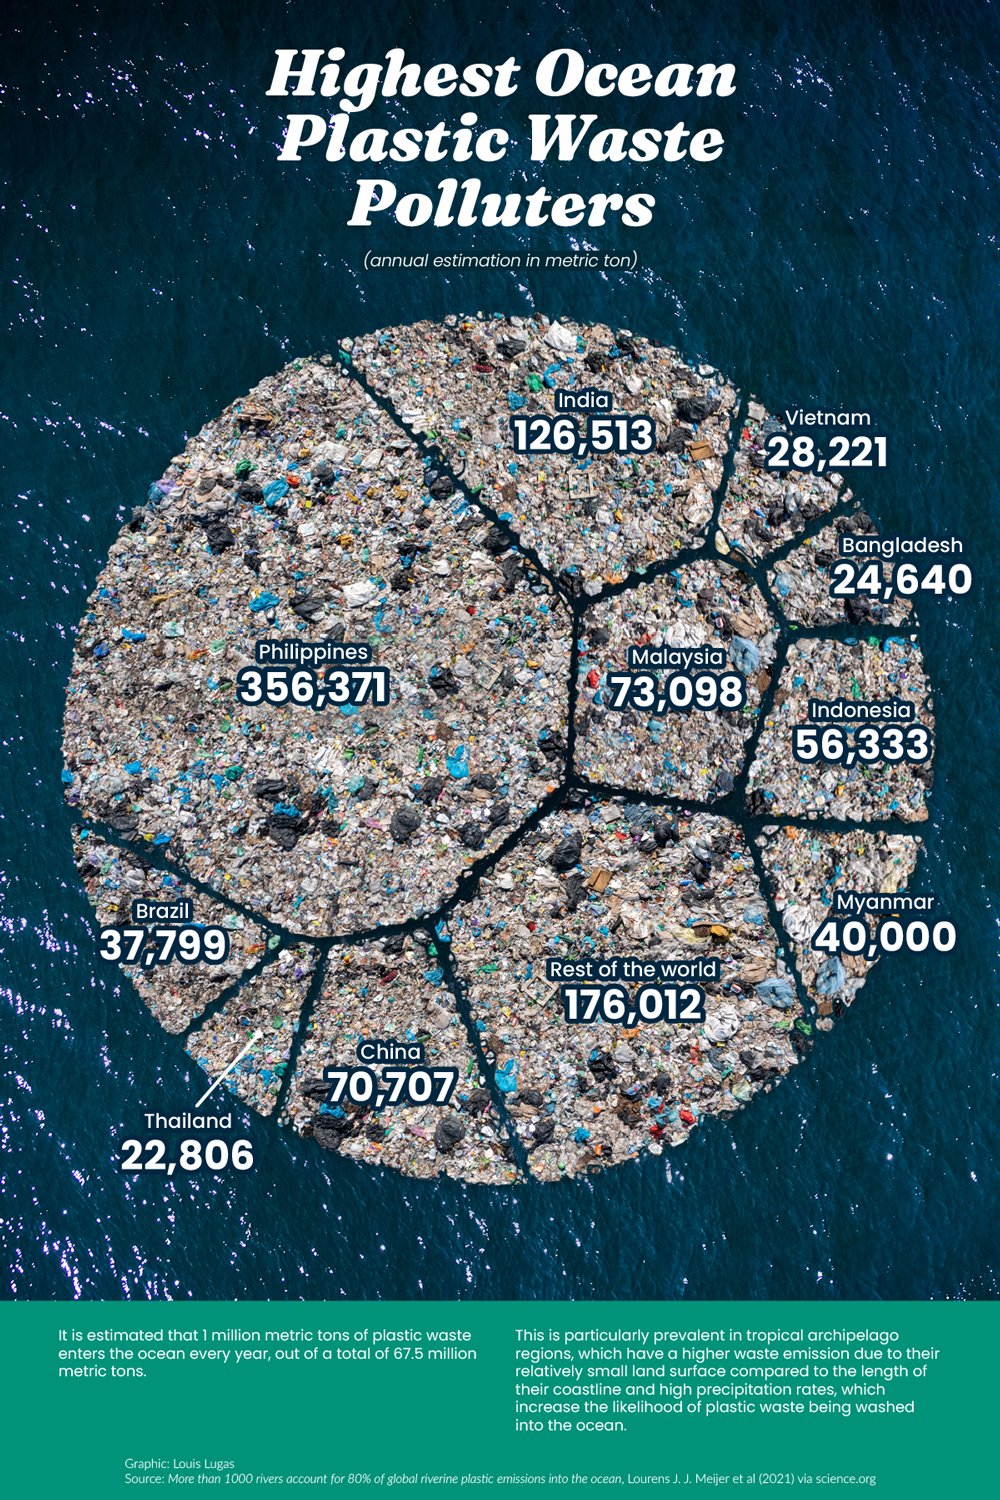
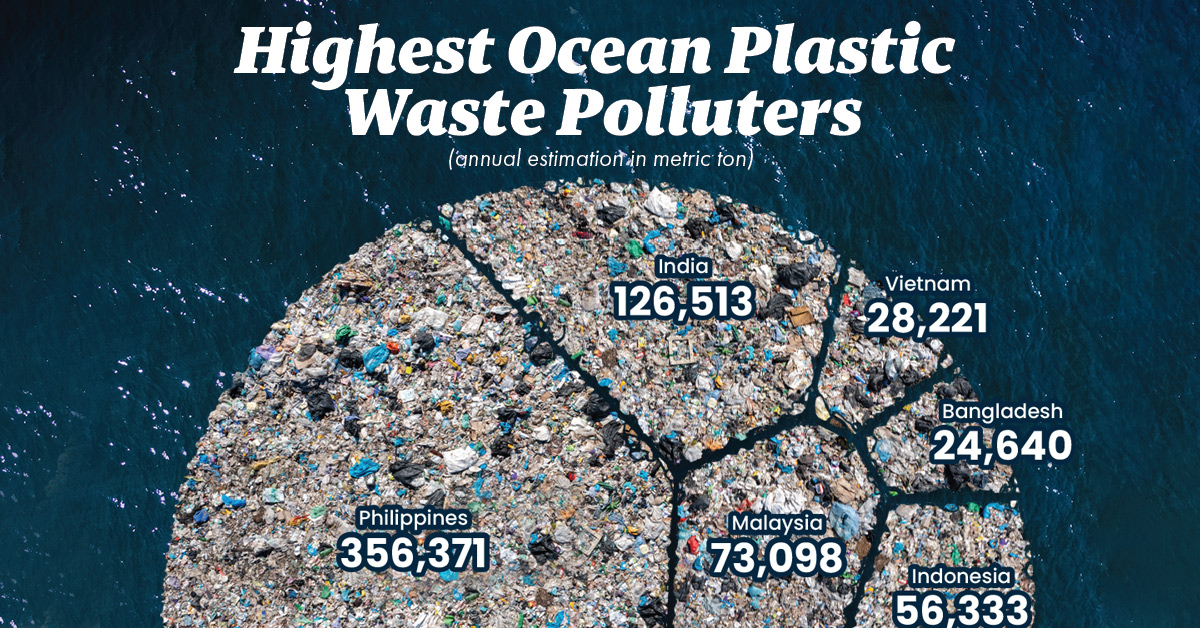
Where does all of this plastic come from? In this graphic, Louis Lugas Wicaksono used data from a research paper by Lourens J.J. Meijer and team to highlight the top 10 countries emitting plastic pollutants in the waters surrounding them.
Plastic’s Ocean Voyage
First, let’s talk about how this plastic waste reaches the oceans in the first place.
Most of the plastic waste found in the deep blue waters comes from the litter in parks, beaches, or along the storm drains lining our streets. These bits of plastic waste are carried into our drains, streams, and rivers by wind and rainwater runoff.
The rivers then turn into plastic superhighways, transporting the plastic to the oceans.
A large additional chunk of ocean plastic comes from damaged fishing nets or ghost nets that are directly discarded into the high seas.
Countries Feeding the Plastic Problem
Some might think that the countries producing or consuming the most plastic are the ones that pollute the oceans the most. But that’s not true.
According to the study, countries with a smaller geographical area, longer coastlines, high rainfall, and poor waste management systems are more likely to wash plastics into the sea.
For example, China generates 10 times the plastic waste that Malaysia does. However, 9% of Malaysia’s total plastic waste is estimated to reach the ocean, in comparison to China’s 0.6%.
| Rank | Country | Annual Ocean Plastic Waste (Metric tons) |
|---|---|---|
| #1 | 🇵🇭 Philippines | 356,371 |
| #2 | 🇮🇳 India | 126,513 |
| #3 | 🇲🇾 Malaysia | 73,098 |
| #4 | 🇨🇳 China | 70,707 |
| #5 | 🇮🇩 Indonesia | 56,333 |
| #6 | 🇲🇲 Myanmar | 40,000 |
| #7 | 🇧🇷 Brazil | 37,799 |
| #8 | 🇻🇳 Vietnam | 28,221 |
| #9 | 🇧🇩 Bangladesh | 24,640 |
| #10 | 🇹🇭 Thailand | 22,806 |
| 🌐 Rest of the World | 176,012 | |
| Total | 1,012,500 |
The Philippines—an archipelago of over 7,000 islands, with a 36,289 kilometer coastline and 4,820 plastic emitting rivers—is estimated to emit 35% of the ocean’s plastic.
In addition to the Philippines, over 75% of the accumulated plastic in the ocean is reported to come from the mismanaged waste in Asian countries including India, Malaysia, China, Indonesia, Myanmar, Vietnam, Bangladesh, and Thailand.
The only non-Asian country to make it to this top 10 list, with 1,240 rivers including the Amazon, is Brazil.
The Path to a Plastic-free Ocean
The first, and most obvious, way to reduce plastic accumulation is to reduce the use of plastic. Lesser production equals lesser waste.
The second step is managing the plastic waste generated, and this is where the challenge lies.
Many high-income countries generate high amounts of plastic waste, but are either better at processing it or exporting it to other countries. Meanwhile, many of the middle-income and low-income countries that both demand plastics and receive bulk exports have yet to develop the infrastructure needed to process it.

This article was published as a part of Visual Capitalist's Creator Program, which features data-driven visuals from some of our favorite Creators around the world.


Green
Ranking the Top 15 Countries by Carbon Tax Revenue
This graphic highlights France and Canada as the global leaders when it comes to generating carbon tax revenue.


Top 15 Countries by Carbon Tax Revenue
This was originally posted on our Voronoi app. Download the app for free on iOS or Android and discover incredible data-driven charts from a variety of trusted sources.
Carbon taxes are designed to discourage CO2 emissions by increasing the cost of carbon-intensive activities and incentivizing the adoption of cleaner energy alternatives.
In this graphic we list the top 15 countries by carbon tax revenue as of 2022. The data is from the World Bank’s State and Trends of Carbon Pricing Report, published in April 2023.
France and Canada Lead in Global Carbon Tax Revenue
In 2022, the top 15 countries generated approximately $30 billion in revenue from carbon taxes.
France and Canada lead in this regard, accounting for over half of the total amount. Both countries have implemented comprehensive carbon pricing systems that cover a wide range of sectors, including transportation and industry, and they have set relatively high carbon tax rates.
| Country | Government revenue in 2022 ($ billions) |
|---|---|
| 🇫🇷 France | $8.9 |
| 🇨🇦 Canada | $7.8 |
| 🇸🇪 Sweden | $2.3 |
| 🇳🇴 Norway | $2.1 |
| 🇯🇵 Japan | $1.8 |
| 🇫🇮 Finland | $1.7 |
| 🇨🇭 Switzerland | $1.6 |
| 🇬🇧 United Kingdom | $0.9 |
| 🇮🇪 Ireland | $0.7 |
| 🇩🇰 Denmark | $0.5 |
| 🇵🇹 Portugal | $0.5 |
| 🇦🇷 Argentina | $0.3 |
| 🇲🇽 Mexico | $0.2 |
| 🇸🇬 Singapore | $0.1 |
| 🇿🇦 South Africa | $0.1 |
In Canada, the total carbon tax revenue includes both national and provincial taxes.
While carbon pricing has been recognized internationally as one of the more efficient mechanisms for reducing CO2 emissions, research is divided over what the global average carbon price should be to achieve the goals of the Paris Climate Agreement, which aims to limit global warming to 1.5–2°C by 2100 relative to pre-industrial levels.
A recent study has shown that carbon pricing must be supported by other policy measures and innovations. According to a report from Queen’s University, there is no feasible carbon pricing scenario that is high enough to limit emissions sufficiently to achieve anything below 2.4°C warming on its own.

-

 Mining2 weeks ago
Charted: The Value Gap Between the Gold Price and Gold Miners
-

 Real Estate1 week ago
Ranked: The Most Valuable Housing Markets in America
-

 Business1 week ago
Charted: Big Four Market Share by S&P 500 Audits
-

 AI1 week ago
The Stock Performance of U.S. Chipmakers So Far in 2024
-

 Misc1 week ago
Almost Every EV Stock is Down After Q1 2024
-

 Money2 weeks ago
Where Does One U.S. Tax Dollar Go?
-

 Green2 weeks ago
Ranked: Top Countries by Total Forest Loss Since 2001
-

 Real Estate2 weeks ago
Visualizing America’s Shortage of Affordable Homes