Green
Which Countries Pollute the Most Ocean Plastic Waste?
Visualized: Ocean Plastic Waste Pollution By Country
Millions of metric tons of plastic are produced worldwide every year. While half of this plastic waste is recycled, incinerated, or discarded into landfills, a significant portion of what remains eventually ends up in our oceans.
In fact, many pieces of ocean plastic waste have come together to create a vortex of plastic waste thrice the size of France in the Pacific Ocean between California and Hawaii.
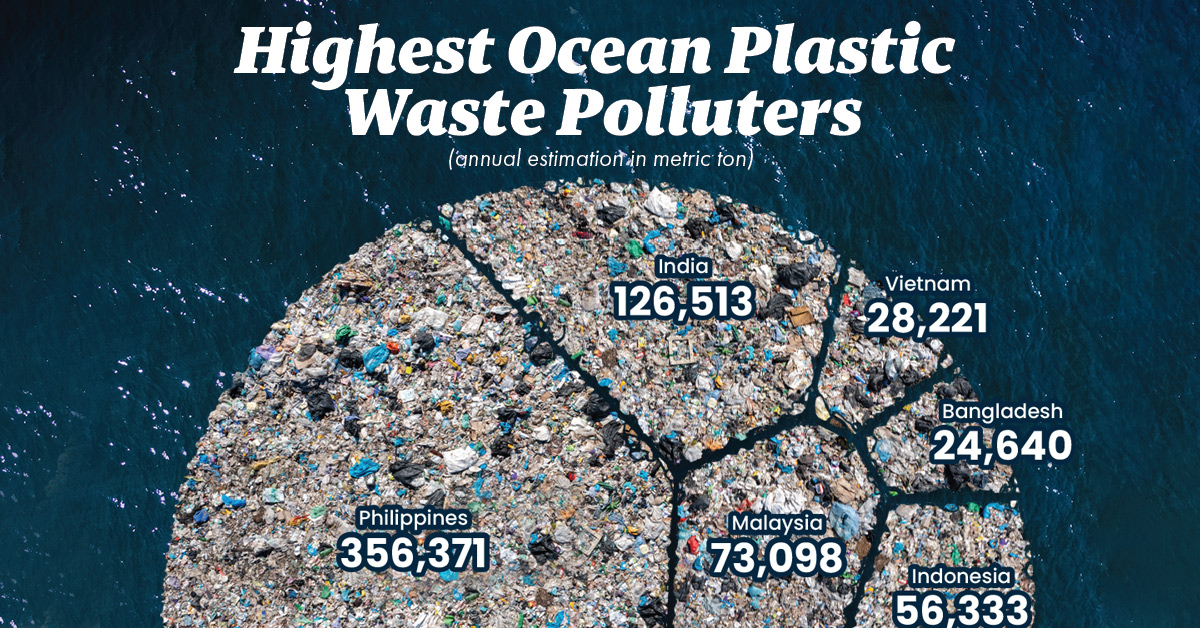
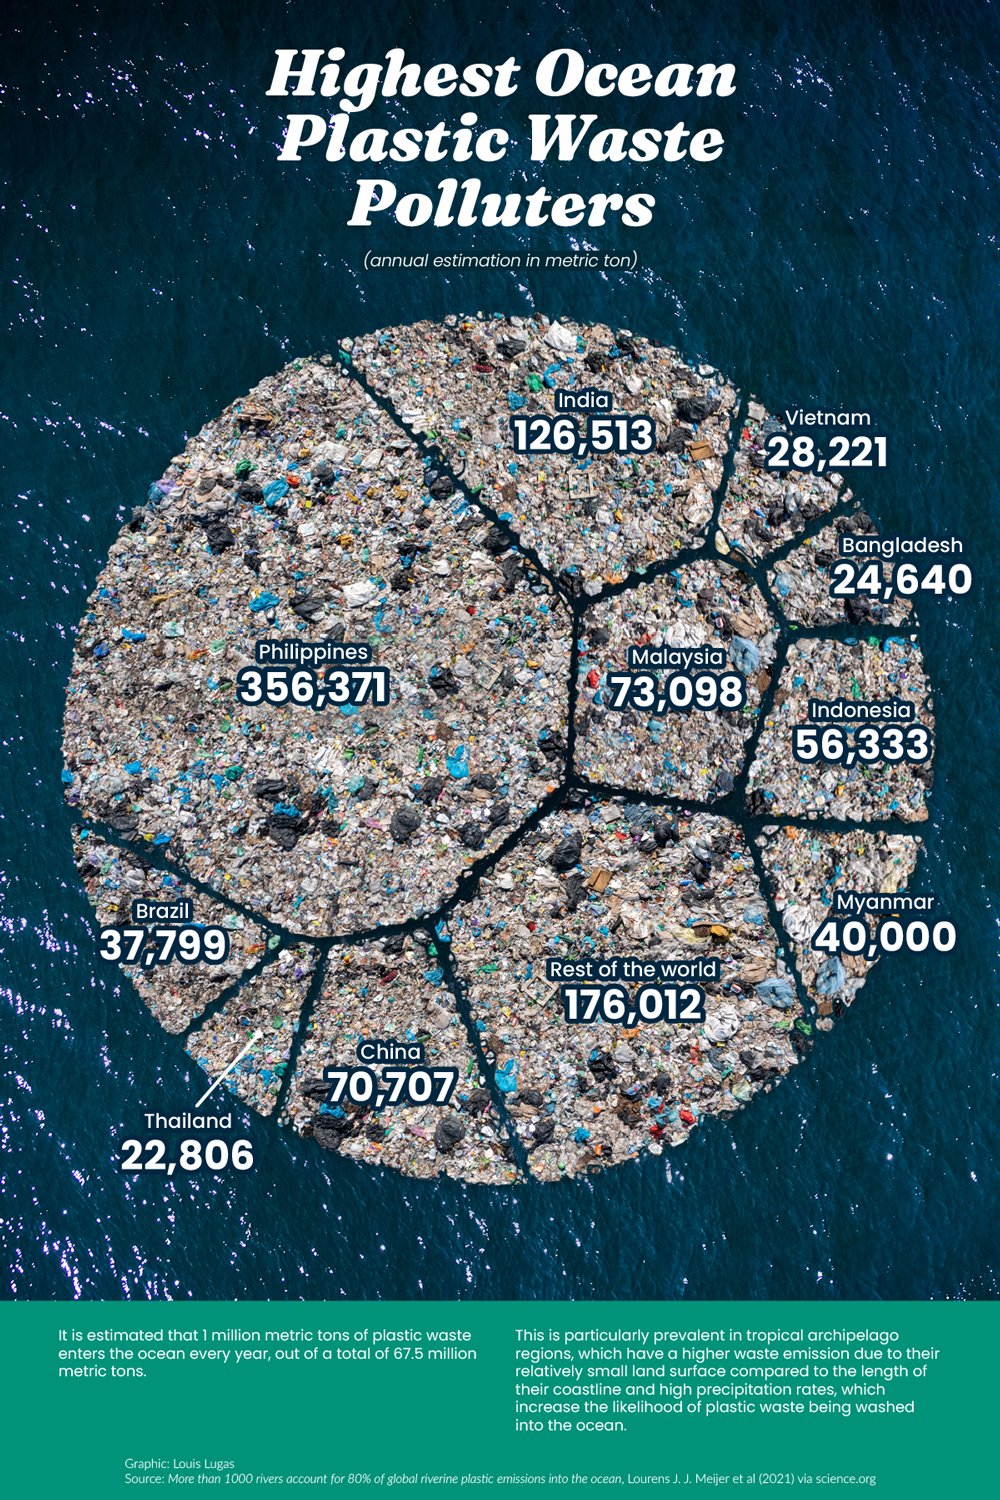
Where does all of this plastic come from? In this graphic, Louis Lugas Wicaksono used data from a research paper by Lourens J.J. Meijer and team to highlight the top 10 countries emitting plastic pollutants in the waters surrounding them.
Plastic’s Ocean Voyage
First, let’s talk about how this plastic waste reaches the oceans in the first place.
Most of the plastic waste found in the deep blue waters comes from the litter in parks, beaches, or along the storm drains lining our streets. These bits of plastic waste are carried into our drains, streams, and rivers by wind and rainwater runoff.
The rivers then turn into plastic superhighways, transporting the plastic to the oceans.
A large additional chunk of ocean plastic comes from damaged fishing nets or ghost nets that are directly discarded into the high seas.
Countries Feeding the Plastic Problem
Some might think that the countries producing or consuming the most plastic are the ones that pollute the oceans the most. But that’s not true.
According to the study, countries with a smaller geographical area, longer coastlines, high rainfall, and poor waste management systems are more likely to wash plastics into the sea.
For example, China generates 10 times the plastic waste that Malaysia does. However, 9% of Malaysia’s total plastic waste is estimated to reach the ocean, in comparison to China’s 0.6%.
Rank | Country | Annual Ocean Plastic Waste (Metric tons) |
---|---|---|
#1 | 🇵🇭 Philippines | 356,371 |
#2 | 🇮🇳 India | 126,513 |
#3 | 🇲🇾 Malaysia | 73,098 |
#4 | 🇨🇳 China | 70,707 |
#5 | 🇮🇩 Indonesia | 56,333 |
#6 | 🇲🇲 Myanmar | 40,000 |
#7 | 🇧🇷 Brazil | 37,799 |
#8 | 🇻🇳 Vietnam | 28,221 |
#9 | 🇧🇩 Bangladesh | 24,640 |
#10 | 🇹🇭 Thailand | 22,806 |
🌐 Rest of the World | 176,012 | |
Total | 1,012,500 |
The Philippines—an archipelago of over 7,000 islands, with a 36,289 kilometer coastline and 4,820 plastic emitting rivers—is estimated to emit 35% of the ocean’s plastic.
In addition to the Philippines, over 75% of the accumulated plastic in the ocean is reported to come from the mismanaged waste in Asian countries including India, Malaysia, China, Indonesia, Myanmar, Vietnam, Bangladesh, and Thailand.
The only non-Asian country to make it to this top 10 list, with 1,240 rivers including the Amazon, is Brazil.
The Path to a Plastic-free Ocean
The first, and most obvious, way to reduce plastic accumulation is to reduce the use of plastic. Lesser production equals lesser waste.
The second step is managing the plastic waste generated, and this is where the challenge lies.
Many high-income countries generate high amounts of plastic waste, but are either better at processing it or exporting it to other countries. Meanwhile, many of the middle-income and low-income countries that both demand plastics and receive bulk exports have yet to develop the infrastructure needed to process it.

This article was published as a part of Visual Capitalist's Creator Program, which features data-driven visuals from some of our favorite Creators around the world.
Environment
Tracking Antarctica Sea Ice Loss in 2023
Antarctica’s ice extent has reached record lows. This visual details and maps Antarctica sea ice loss over the last two years.

Tracking Antarctica Sea Ice Loss in 2023
Scientists have been tracking the extent and concentrations of Antarctica’s sea ice for decades, and the last two years have raised global alarm bells.
As temperatures are breaking records around the world, the southernmost continent’s ice sheet is visibly smaller than it has been in decades past.
The above graphic uses tracking data from the National Oceanic and Atmospheric Administration (NOAA) and the National Snow and Ice Data Center (NSIDC) to visualize sea ice extent in Antarctica as of August 2023
How Much Ice Has Antarctica Lost?
According to satellite data tracked by the NSIDC, sea ice extent in Antarctica has shrunk to record lows.
When compared to previously charted data dating back to 1979, daily record lows in sea ice extent have been recorded for every day in 2023 so far.
Here is how daily Antarctic sea ice extent in 2023 compares to 2022 (which had many of the previous record lows), and the median from 1981 to 2010.
Date | 2023 (km²) | 2022 (km²) | Median (1981‒2010, km²) |
---|---|---|---|
Aug 24 | 15.87M | 17.29M | 17.94M |
Aug 23 | 15.79M | 17.24M | 17.91M |
Aug 22 | 15.74M | 17.21M | 17.89M |
Aug 21 | 15.69M | 17.19M | 17.87M |
Aug 20 | 15.64M | 17.14M | 17.84M |
Aug 19 | 15.55M | 17.11M | 17.82M |
Aug 18 | 15.45M | 17.06M | 17.79M |
Aug 17 | 15.34M | 16.99M | 17.73M |
Aug 16 | 15.22M | 16.93M | 17.68M |
Aug 15 | 15.12M | 16.88M | 17.63M |
Aug 14 | 15.07M | 16.84M | 17.60M |
Aug 13 | 15.04M | 16.81M | 17.56M |
Aug 12 | 15.02M | 16.78M | 17.54M |
Aug 11 | 15.00M | 16.76M | 17.50M |
Aug 10 | 14.98M | 16.75M | 17.45M |
Aug 09 | 14.96M | 16.73M | 17.39M |
Aug 08 | 14.95M | 16.70M | 17.34M |
Aug 07 | 14.92M | 16.64M | 17.27M |
Aug 06 | 14.88M | 16.57M | 17.21M |
Aug 05 | 14.86M | 16.46M | 17.15M |
Aug 04 | 14.82M | 16.35M | 17.10M |
Aug 03 | 14.78M | 16.22M | 17.05M |
Aug 02 | 14.75M | 16.11M | 17.01M |
Aug 01 | 14.69M | 15.99M | 16.96M |
Jul 31 | 14.62M | 15.87M | 16.92M |
Jul 30 | 14.55M | 15.76M | 16.86M |
Jul 29 | 14.47M | 15.68M | 16.79M |
Jul 28 | 14.38M | 15.62M | 16.71M |
Jul 27 | 14.29M | 15.59M | 16.63M |
Jul 26 | 14.21M | 15.57M | 16.56M |
Jul 25 | 14.16M | 15.56M | 16.49M |
Jul 24 | 14.10M | 15.53M | 16.41M |
Jul 23 | 14.03M | 15.50M | 16.33M |
Jul 22 | 13.97M | 15.43M | 16.24M |
Jul 21 | 13.91M | 15.35M | 16.16M |
Jul 20 | 13.82M | 15.25M | 16.08M |
Jul 19 | 13.70M | 15.14M | 16.00M |
Jul 18 | 13.58M | 15.03M | 15.94M |
Jul 17 | 13.45M | 14.93M | 15.88M |
Jul 16 | 13.31M | 14.84M | 15.80M |
Jul 15 | 13.17M | 14.78M | 15.71M |
Jul 14 | 13.07M | 14.72M | 15.62M |
Jul 13 | 12.98M | 14.64M | 15.54M |
Jul 12 | 12.88M | 14.57M | 15.46M |
Jul 11 | 12.77M | 14.47M | 15.39M |
Jul 10 | 12.65M | 14.37M | 15.32M |
Jul 09 | 12.54M | 14.28M | 15.25M |
Jul 08 | 12.43M | 14.19M | 15.19M |
Jul 07 | 12.36M | 14.12M | 15.12M |
Jul 06 | 12.32M | 14.06M | 15.05M |
Jul 05 | 12.31M | 13.98M | 14.98M |
Jul 04 | 12.28M | 13.89M | 14.91M |
Jul 03 | 12.22M | 13.79M | 14.82M |
Jul 02 | 12.14M | 13.68M | 14.73M |
Jul 01 | 12.06M | 13.58M | 14.64M |
Jun 30 | 11.96M | 13.46M | 14.54M |
Jun 29 | 11.87M | 13.33M | 14.45M |
Jun 28 | 11.81M | 13.19M | 14.36M |
Jun 27 | 11.75M | 13.06M | 14.26M |
Jun 26 | 11.68M | 12.92M | 14.17M |
Jun 25 | 11.61M | 12.81M | 14.07M |
Jun 24 | 11.53M | 12.73M | 13.98M |
Jun 23 | 11.46M | 12.67M | 13.88M |
Jun 22 | 11.39M | 12.61M | 13.79M |
Jun 21 | 11.31M | 12.56M | 13.69M |
Jun 20 | 11.21M | 12.50M | 13.59M |
Jun 19 | 11.10M | 12.41M | 13.48M |
Jun 18 | 11.02M | 12.32M | 13.37M |
Jun 17 | 10.92M | 12.22M | 13.26M |
Jun 16 | 10.84M | 12.11M | 13.17M |
Jun 15 | 10.78M | 12.02M | 13.08M |
Jun 14 | 10.73M | 11.92M | 12.98M |
Jun 13 | 10.66M | 11.81M | 12.89M |
Jun 12 | 10.61M | 11.72M | 12.81M |
Jun 11 | 10.54M | 11.62M | 12.72M |
Jun 10 | 10.46M | 11.53M | 12.61M |
Jun 09 | 10.39M | 11.45M | 12.48M |
Jun 08 | 10.33M | 11.36M | 12.36M |
Jun 07 | 10.26M | 11.26M | 12.25M |
Jun 06 | 10.18M | 11.15M | 12.13M |
Jun 05 | 10.09M | 11.00M | 12.02M |
Jun 04 | 9.99M | 10.87M | 11.93M |
Jun 03 | 9.87M | 10.74M | 11.84M |
Jun 02 | 9.75M | 10.64M | 11.74M |
Jun 01 | 9.64M | 10.58M | 11.65M |
May 31 | 9.53M | 10.54M | 11.56M |
May 30 | 9.43M | 10.49M | 11.47M |
May 29 | 9.36M | 10.43M | 11.37M |
May 28 | 9.30M | 10.35M | 11.27M |
May 27 | 9.23M | 10.27M | 11.17M |
May 26 | 9.16M | 10.20M | 11.08M |
May 25 | 9.09M | 10.14M | 10.99M |
May 24 | 8.98M | 10.07M | 10.89M |
May 23 | 8.86M | 10.01M | 10.79M |
May 22 | 8.73M | 9.94M | 10.68M |
May 21 | 8.61M | 9.85M | 10.57M |
May 20 | 8.52M | 9.76M | 10.45M |
May 19 | 8.43M | 9.66M | 10.33M |
May 18 | 8.36M | 9.56M | 10.24M |
May 17 | 8.30M | 9.46M | 10.14M |
May 16 | 8.25M | 9.34M | 10.03M |
May 15 | 8.16M | 9.20M | 9.92M |
May 14 | 8.06M | 9.09M | 9.82M |
May 13 | 7.96M | 8.99M | 9.69M |
May 12 | 7.85M | 8.88M | 9.58M |
May 11 | 7.72M | 8.77M | 9.46M |
May 10 | 7.61M | 8.67M | 9.35M |
May 09 | 7.50M | 8.55M | 9.23M |
May 08 | 7.39M | 8.40M | 9.12M |
May 07 | 7.28M | 8.26M | 9.00M |
May 06 | 7.17M | 8.13M | 8.88M |
May 05 | 7.06M | 8.02M | 8.77M |
May 04 | 6.96M | 7.91M | 8.65M |
May 03 | 6.86M | 7.80M | 8.52M |
May 02 | 6.77M | 7.69M | 8.41M |
May 01 | 6.66M | 7.59M | 8.29M |
Apr 30 | 6.56M | 7.48M | 8.17M |
Apr 29 | 6.48M | 7.35M | 8.06M |
Apr 28 | 6.38M | 7.24M | 7.95M |
Apr 27 | 6.28M | 7.12M | 7.83M |
Apr 26 | 6.19M | 7.00M | 7.71M |
Apr 25 | 6.09M | 6.86M | 7.59M |
Apr 24 | 5.98M | 6.74M | 7.48M |
Apr 23 | 5.89M | 6.62M | 7.37M |
Apr 22 | 5.80M | 6.50M | 7.27M |
Apr 21 | 5.71M | 6.39M | 7.18M |
Apr 20 | 5.64M | 6.27M | 7.09M |
Apr 19 | 5.59M | 6.15M | 6.99M |
Apr 18 | 5.52M | 6.00M | 6.88M |
Apr 17 | 5.45M | 5.86M | 6.78M |
Apr 16 | 5.38M | 5.73M | 6.66M |
Apr 15 | 5.30M | 5.59M | 6.55M |
Apr 14 | 5.19M | 5.46M | 6.43M |
Apr 13 | 5.10M | 5.33M | 6.31M |
Apr 12 | 5.02M | 5.20M | 6.18M |
Apr 11 | 4.94M | 5.09M | 6.06M |
Apr 10 | 4.86M | 4.97M | 5.93M |
Apr 09 | 4.79M | 4.86M | 5.81M |
Apr 08 | 4.71M | 4.77M | 5.71M |
Apr 07 | 4.63M | 4.68M | 5.62M |
Apr 06 | 4.54M | 4.61M | 5.53M |
Apr 05 | 4.46M | 4.52M | 5.44M |
Apr 04 | 4.37M | 4.42M | 5.35M |
Apr 03 | 4.26M | 4.31M | 5.27M |
Apr 02 | 4.16M | 4.20M | 5.18M |
Apr 01 | 4.04M | 4.06M | 5.11M |
Mar 31 | 3.93M | 3.93M | 5.04M |
Mar 30 | 3.86M | 3.81M | 4.97M |
Mar 29 | 3.77M | 3.68M | 4.89M |
Mar 28 | 3.68M | 3.54M | 4.81M |
Mar 27 | 3.57M | 3.40M | 4.72M |
Mar 26 | 3.44M | 3.28M | 4.63M |
Mar 25 | 3.28M | 3.20M | 4.54M |
Mar 24 | 3.14M | 3.12M | 4.46M |
Mar 23 | 3.02M | 3.06M | 4.37M |
Mar 22 | 2.92M | 3.01M | 4.28M |
Mar 21 | 2.84M | 2.95M | 4.20M |
Mar 20 | 2.78M | 2.88M | 4.12M |
Mar 19 | 2.72M | 2.81M | 4.03M |
Mar 18 | 2.66M | 2.74M | 3.95M |
Mar 17 | 2.61M | 2.68M | 3.88M |
Mar 16 | 2.55M | 2.62M | 3.80M |
Mar 15 | 2.49M | 2.57M | 3.73M |
Mar 14 | 2.44M | 2.52M | 3.65M |
Mar 13 | 2.40M | 2.48M | 3.59M |
Mar 12 | 2.34M | 2.43M | 3.51M |
Mar 11 | 2.27M | 2.39M | 3.44M |
Mar 10 | 2.21M | 2.34M | 3.37M |
Mar 09 | 2.13M | 2.29M | 3.31M |
Mar 08 | 2.04M | 2.24M | 3.25M |
Mar 07 | 1.97M | 2.19M | 3.20M |
Mar 06 | 1.93M | 2.15M | 3.16M |
Mar 05 | 1.91M | 2.11M | 3.12M |
Mar 04 | 1.89M | 2.07M | 3.07M |
Mar 03 | 1.88M | 2.03M | 3.02M |
Mar 02 | 1.87M | 2.01M | 2.98M |
Mar 01 | 1.85M | 1.99M | 2.94M |
Feb 28 | 1.83M | 1.98M | 2.89M |
Feb 27 | 1.83M | 1.98M | 2.86M |
Feb 26 | 1.82M | 1.98M | 2.83M |
Feb 25 | 1.82M | 1.98M | 2.81M |
Feb 24 | 1.81M | 1.98M | 2.81M |
Feb 23 | 1.80M | 1.99M | 2.81M |
Feb 22 | 1.79M | 1.99M | 2.81M |
Feb 21 | 1.79M | 2.02M | 2.81M |
Feb 20 | 1.81M | 2.03M | 2.82M |
Feb 19 | 1.82M | 2.05M | 2.82M |
Feb 18 | 1.85M | 2.08M | 2.84M |
Feb 17 | 1.86M | 2.11M | 2.86M |
Feb 16 | 1.88M | 2.14M | 2.89M |
Feb 15 | 1.88M | 2.18M | 2.93M |
Feb 14 | 1.89M | 2.22M | 2.97M |
Feb 13 | 1.91M | 2.24M | 3.02M |
Feb 12 | 1.93M | 2.26M | 3.06M |
Feb 11 | 1.96M | 2.31M | 3.10M |
Feb 10 | 1.98M | 2.35M | 3.15M |
Feb 09 | 2.01M | 2.41M | 3.20M |
Feb 08 | 2.03M | 2.47M | 3.25M |
Feb 07 | 2.06M | 2.54M | 3.30M |
Feb 06 | 2.09M | 2.60M | 3.36M |
Feb 05 | 2.12M | 2.66M | 3.41M |
Feb 04 | 2.16M | 2.71M | 3.47M |
Feb 03 | 2.19M | 2.77M | 3.52M |
Feb 02 | 2.23M | 2.82M | 3.57M |
Feb 01 | 2.26M | 2.86M | 3.63M |
Jan 31 | 2.30M | 2.89M | 3.68M |
Jan 30 | 2.35M | 2.94M | 3.73M |
Jan 29 | 2.42M | 2.99M | 3.78M |
Jan 28 | 2.48M | 3.04M | 3.84M |
Jan 27 | 2.56M | 3.11M | 3.89M |
Jan 26 | 2.65M | 3.19M | 3.96M |
Jan 25 | 2.71M | 3.26M | 4.04M |
Jan 24 | 2.78M | 3.34M | 4.12M |
Jan 23 | 2.85M | 3.41M | 4.18M |
Jan 22 | 2.90M | 3.48M | 4.26M |
Jan 21 | 2.96M | 3.57M | 4.34M |
Jan 20 | 3.02M | 3.66M | 4.42M |
Jan 19 | 3.09M | 3.75M | 4.51M |
Jan 18 | 3.17M | 3.87M | 4.62M |
Jan 17 | 3.24M | 3.96M | 4.73M |
Jan 16 | 3.32M | 4.05M | 4.87M |
Jan 15 | 3.39M | 4.13M | 5.01M |
Jan 14 | 3.45M | 4.20M | 5.14M |
Jan 13 | 3.51M | 4.27M | 5.27M |
Jan 12 | 3.59M | 4.38M | 5.41M |
Jan 11 | 3.67M | 4.49M | 5.54M |
Jan 10 | 3.76M | 4.59M | 5.69M |
Jan 09 | 3.86M | 4.70M | 5.85M |
Jan 08 | 3.97M | 4.83M | 6.02M |
Jan 07 | 4.09M | 4.95M | 6.18M |
Jan 06 | 4.22M | 5.09M | 6.34M |
Jan 05 | 4.35M | 5.27M | 6.51M |
Jan 04 | 4.49M | 5.45M | 6.67M |
Jan 03 | 4.64M | 5.62M | 6.84M |
Jan 02 | 4.79M | 5.82M | 7.01M |
Jan 01 | 5.00M | 6.02M | 7.19M |
Antarctica’s sea ice extent on August 24, 2023 was 1.42 million square kilometers smaller than the year before. When compared to the median extent for that date from 1980 to 2010, it was 2.07 million square kilometers smaller.
Keep in mind that July and August are the coldest months in Antarctica. Its position on the South Pole gives it a very long winter ranging from the end of February to the end of September, with ice building up before melting temperatures arrive in October.
Antarctica Sea Ice and the Rest of the World
Even though the continent is thousands of kilometers from most of Earth’s land and populace, its ice has an important impact on the rest of the planet.
Antarctica’s large ice sheet is able to reflect a lot of sunlight in sunnier months, reducing the amount absorbed by the ocean. The wider its extent builds up over the winter, the more sunlight and heat it is able to reflect.
It’s also important to consider that this ice comes from a regular pattern of freezing and melting ocean water. The more ice is lost to the oceans compared to what accumulates in a given year, the higher sea levels rise around the world.
-
Markets2 weeks ago
The 25 Worst Stocks by Shareholder Wealth Losses (1926-2022)
-
Precious Metals1 day ago
200 Years of Global Gold Production, by Country
-
China4 weeks ago
Charted: Youth Unemployment in the OECD and China
-
Technology2 weeks ago
Visualizing Google’s Search Engine Market Share
-
United States13 hours ago
Mapped: How Much Does it Take to be the Top 1% in Each U.S. State?
-
Real Estate4 weeks ago
The Monthly Cost of Buying vs. Renting a House in America
-
Money2 weeks ago
Visualized: How Long Does it Take to Double Your Money?
-
Misc3 weeks ago
Ranked: The World’s Largest Stadiums