Maps
The Yuxi Circle: The World’s Most Densely Populated Area
Article/Editing:
The Yuxi Circle: The World’s Most Densely Populated Area
If you wanted to capture over 55% of the global population inside a circle with a 4,000km radius, which city would you place at its epicenter?
In 2013, a post appeared on Reddit marking a circular area of the globe with “more people living inside this circle than outside of it.” The circle had a radius of 4,000 km (just under 2,500 miles) and was named the Valeriepieris circle after author Ken Myers’ username.
Acknowledging that the Valeriepieris circle is not actually a circle (it was drawn on a two-dimensional map rather than a globe) and is based on data that has become outdated, mapmaker Alasdair Rae went digging and discovered what he calls The Yuxi Circle, the world’s most densely populated area.
Introducing the Yuxi Circle
Rae traced circles around 1,500 cities worldwide to find out how many people lived within a 4,000 km radius, just like the original Valeriepieris circle. He based his calculations on WorldPop data from 2020, based on a global population of 7.8 billion people.
Of the 1,500 circles that Rae made calculations for, 148 contained populations of 4 billion or more. He found many examples in Asia including in China, Myanmar (Mandalay), Laos (Vientiane), Bangladesh (Chattogram), India (Agartala), Bhutan (Thimpu), and Vietnam (Hanoi) to name a few.
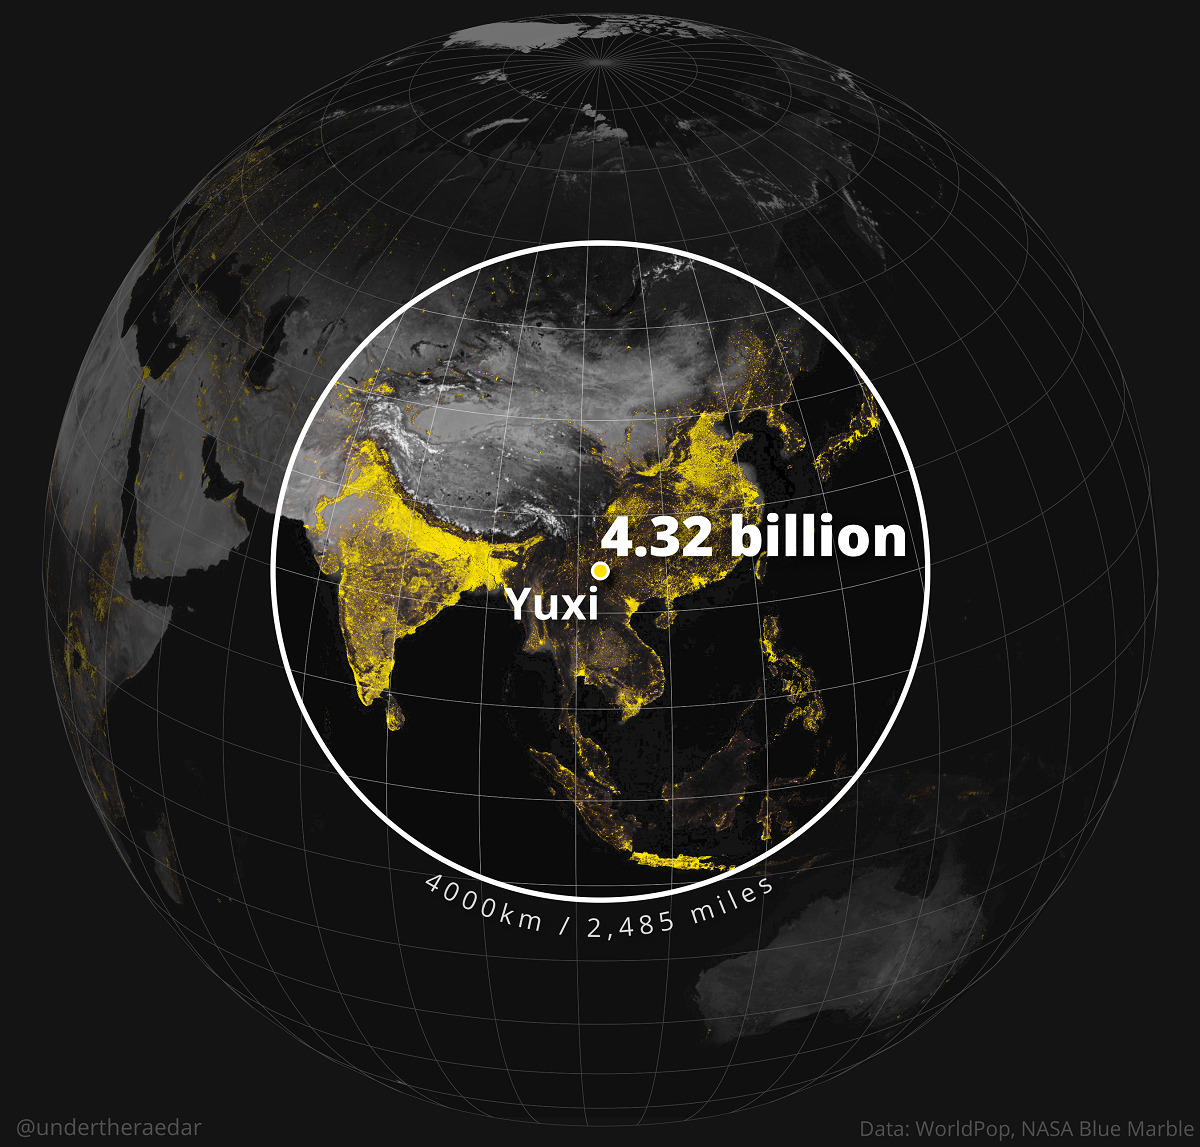
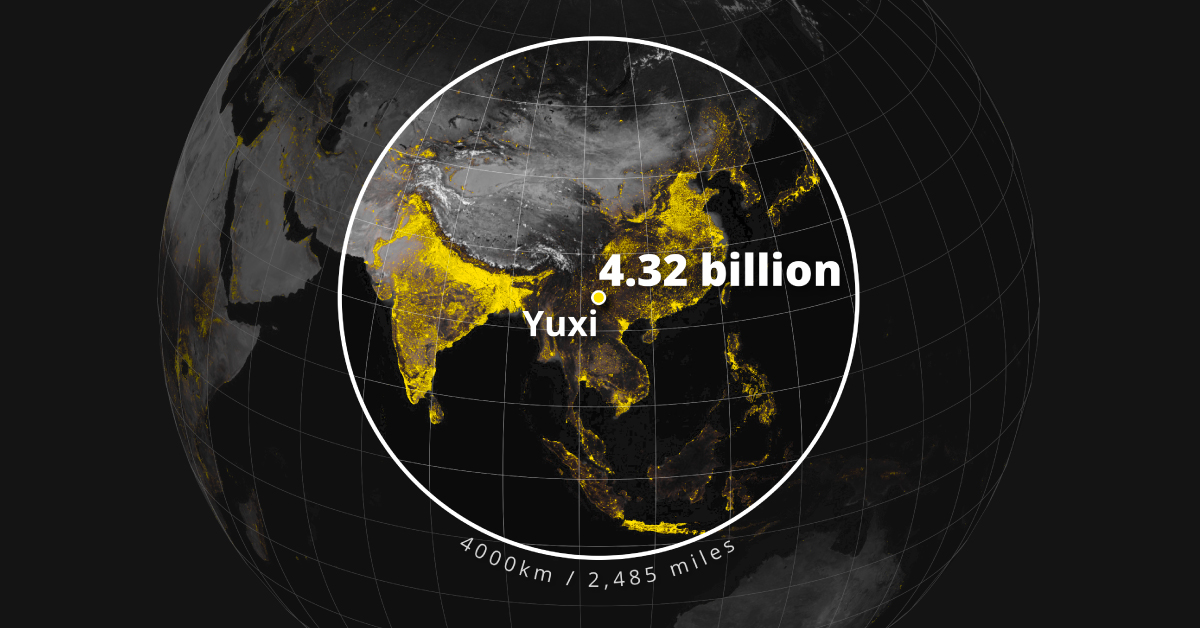
But of them all, Yuxi, a city in the Yunnan province of China, has the largest population living within a 4,000 km radius: 4.32 billion.
Put another way? The circle encompasses over 55% of the world’s population, despite including desolate areas like the Taklamakan Desert, the Tibetan Plateau, Mongolia, and Southern Siberia.
Densely Populated Areas Around the Globe
Rae’s search for densely populated clusters also turned up notable circles beyond Asia. They surrounded cities like Cairo, Paris, and Mexico City.
Note: Keep in mind that the white lines on the flat maps are equidistant circles but will only look like circles when plotted on a globe.
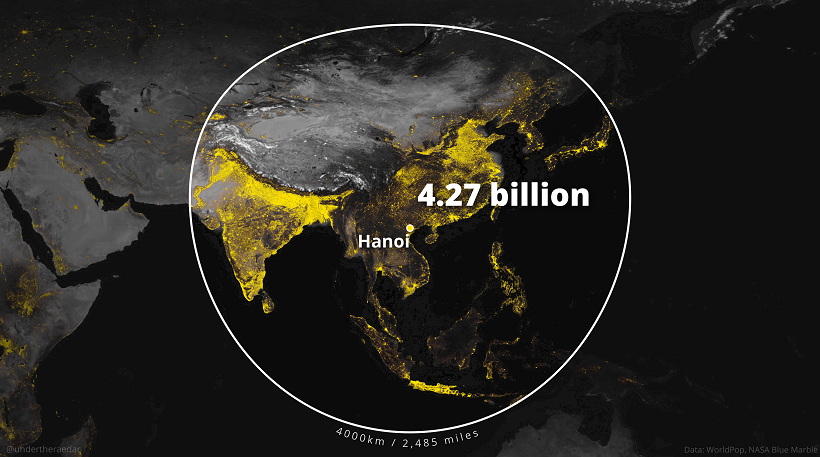
Circling Hanoi yields a population of 4.27 billion (54% of the global population). It was the runner up city circle in Rae’s original search.
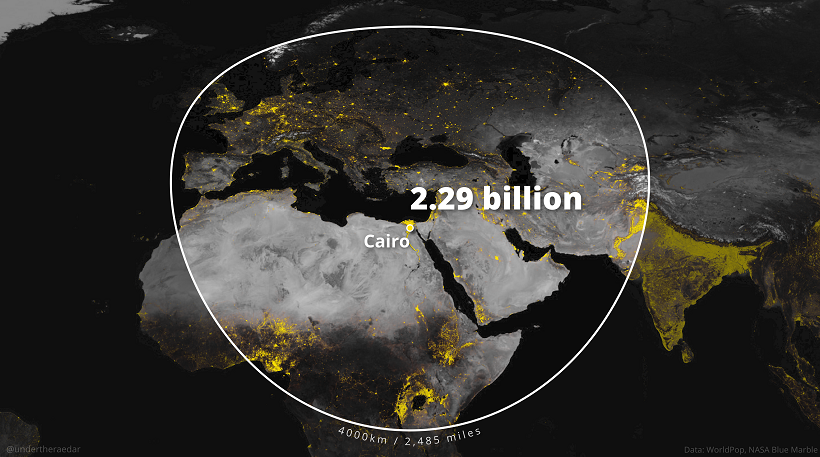
Circling Cairo yields a population of 2.29 billion. This circle reaches most of Europe while still containing populated areas of India, Pakistan, and Africa.
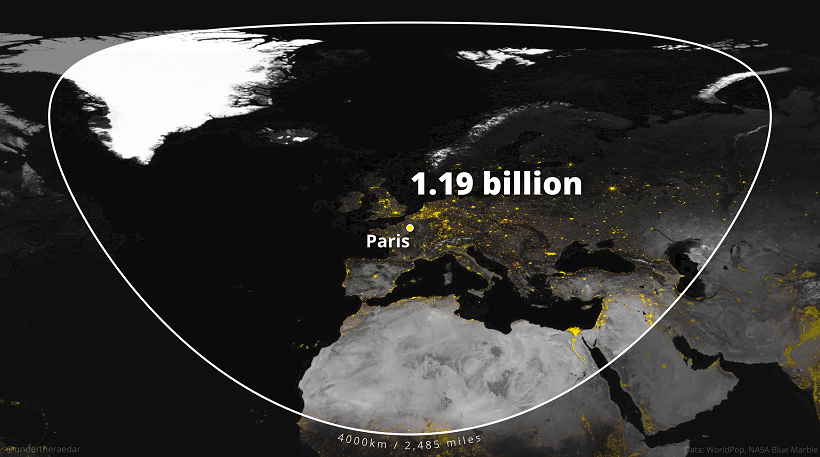
Comparatively, circling Paris yields a population of 1.19 billion. This Euro-centric circle contains large tracts of water and scarcely populated islands such as Iceland and Greenland.
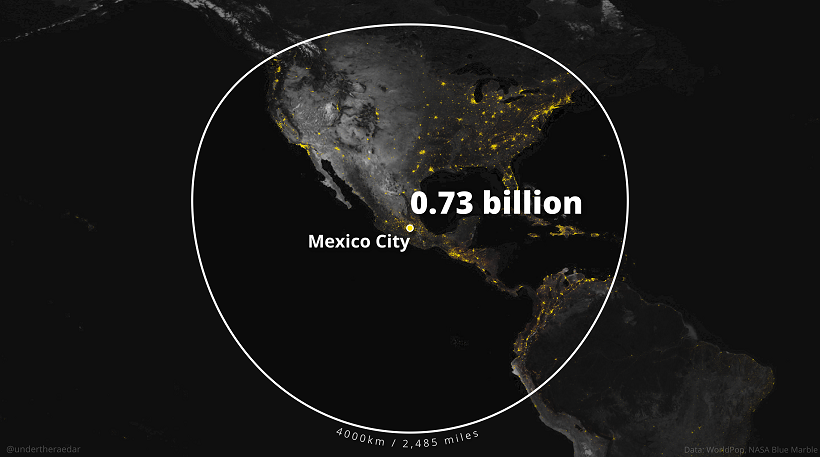
Across the Atlantic, circling Mexico City yields a population of 0.73 billion. It’s significantly smaller than the other circles, as the total population in the Americas is concentrated in just three countries, the U.S., Mexico, and Brazil (not included in this circle).
It’s worth noting that the Valeriepieris circle also inspired other people to look at population density in different ways. In 2015, Danny Quah of the London School of Economics looked more closely at the Valeriepieris circle and was inspired to find the smallest circle with more people living inside of it than outside. He determined that a circle with a radius of 3,300 km centered near Mong Khet, Myanmar was “the world’s tightest cluster of people.”
While the Yuxi Circle contains the largest population using Rae’s approach as of early 2022, global populations are constantly changing. Who knows where the next Yuxi Circle will be?

This article was published as a part of Visual Capitalist's Creator Program, which features data-driven visuals from some of our favorite Creators around the world.


Maps
The Largest Earthquakes in the New York Area (1970-2024)
The earthquake that shook buildings across New York in April 2024 was the third-largest quake in the Northeast U.S. over the past 50 years.


The Largest Earthquakes in the New York Area
This was originally posted on our Voronoi app. Download the app for free on Apple or Android and discover incredible data-driven charts from a variety of trusted sources.
The 4.8 magnitude earthquake that shook buildings across New York on Friday, April 5th, 2024 was the third-largest quake in the U.S. Northeast area over the past 50 years.
In this map, we illustrate earthquakes with a magnitude of 4.0 or greater recorded in the Northeastern U.S. since 1970, according to the United States Geological Survey (USGS).
Shallow Quakes and Older Buildings
The earthquake that struck the U.S. Northeast in April 2024 was felt by millions of people from Washington, D.C., to north of Boston. It even caused a full ground stop at Newark Airport.
The quake, occurring just 5 km beneath the Earth’s surface, was considered shallow, which is what contributed to more intense shaking at the surface.
According to the USGS, rocks in the eastern U.S. are significantly older, denser, and harder than those on the western side, compressed by time. This makes them more efficient conduits for seismic energy. Additionally, buildings in the Northeast tend to be older and may not adhere to the latest earthquake codes.
Despite disrupting work and school life, the earthquake was considered minor, according to the Michigan Technological University magnitude scale:
| Magnitude | Earthquake Effects | Estimated Number Each Year |
|---|---|---|
| 2.5 or less | Usually not felt, but can be recorded by seismograph. | Millions |
| 2.5 to 5.4 | Often felt, but only causes minor damage. | 500,000 |
| 5.5 to 6.0 | Slight damage to buildings and other structures. | 350 |
| 6.1 to 6.9 | May cause a lot of damage in very populated areas. | 100 |
| 7.0 to 7.9 | Major earthquake. Serious damage. | 10-15 |
| 8.0 or greater | Great earthquake. Can totally destroy communities near the epicenter. | One every year or two |
The largest earthquake felt in the area over the past 50 years was a 5.3 magnitude quake that occurred in Au Sable Forks, New York, in 2002. It damaged houses and cracked roads in a remote corner of the Adirondack Mountains, but caused no injuries.
| Date | Magnitude | Location | State |
|---|---|---|---|
| April 20, 2002 | 5.3 | Au Sable Forks | New York |
| October 7, 1983 | 5.1 | Newcomb | New York |
| April 5, 2024 | 4.8 | Whitehouse Station | New Jersey |
| October 16, 2012 | 4.7 | Hollis Center | Maine |
| January 16, 1994 | 4.6 | Sinking Spring | Pennsylvania |
| January 19, 1982 | 4.5 | Sanbornton | New Hampshire |
| September 25, 1998 | 4.5 | Adamsville | Pennsylvania |
| June 9, 1975 | 4.2 | Altona | New York |
| May 29, 1983 | 4.2 | Peru | Maine |
| April 23, 1984 | 4.2 | Conestoga | Pennsylvania |
| January 16, 1994 | 4.2 | Sinking Spring | Pennsylvania |
| November 3, 1975 | 4 | Long Lake | New York |
| June 17, 1991 | 4 | Worcester | New York |
The largest earthquake in U.S. history, however, was the 1964 Good Friday quake in Alaska, measuring 9.2 magnitude and killing 131 people.

-

 Markets1 week ago
U.S. Debt Interest Payments Reach $1 Trillion
-

 Markets2 weeks ago
Ranked: The Most Valuable Housing Markets in America
-

 Money2 weeks ago
Which States Have the Highest Minimum Wage in America?
-

 AI2 weeks ago
Ranked: Semiconductor Companies by Industry Revenue Share
-

 Markets2 weeks ago
Ranked: The World’s Top Flight Routes, by Revenue
-

 Countries2 weeks ago
Population Projections: The World’s 6 Largest Countries in 2075
-

 Markets2 weeks ago
The Top 10 States by Real GDP Growth in 2023
-

 Money2 weeks ago
The Smallest Gender Wage Gaps in OECD Countries