Markets
Mapped: The World’s Largest Economies, Sized by GDP (1970-2020)
Article/Editing:
How to Use: The below slideshow will animate automatically. To pause, move your cursor on the image. Arrows on left/right navigate.

View the full-size version of all three graphics
Visualizing The World’s Largest Economies (1970-2020)
Global GDP has grown massively over the last 50 years, but not all countries experienced this economic growth equally.
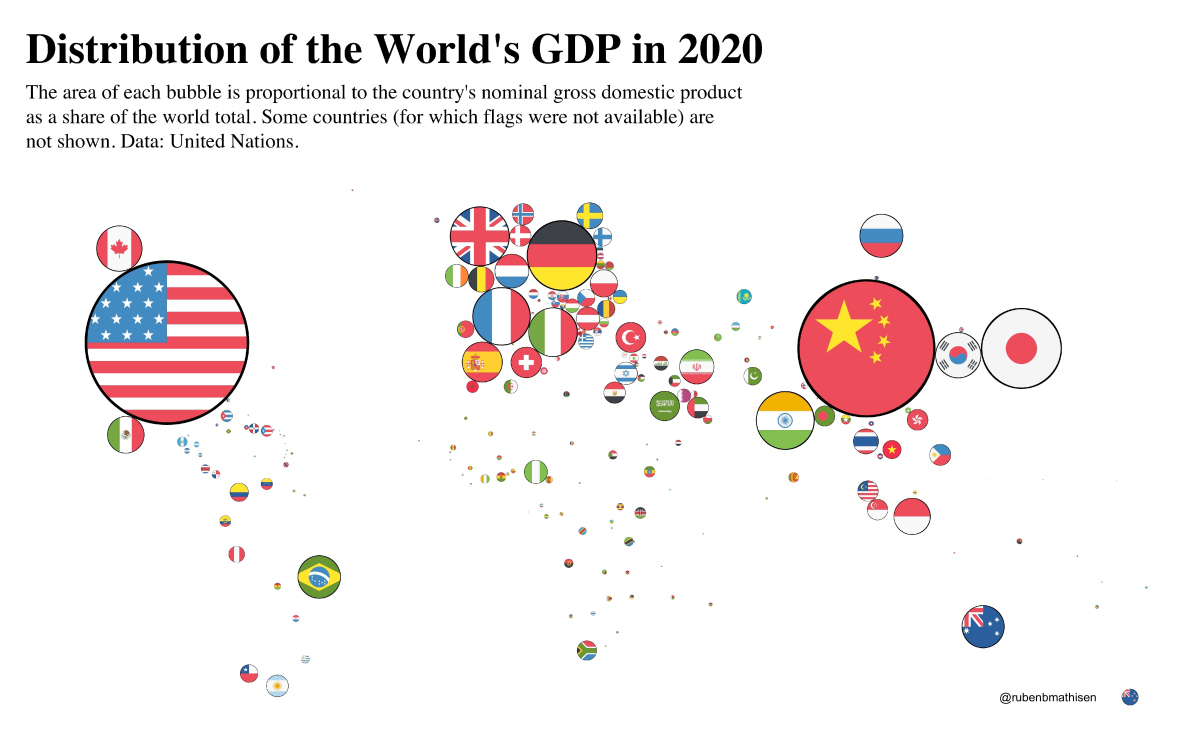
In 1970, the world’s nominal GDP was just $3.4 trillion. Fast forward a few decades and it had reached $85.3 trillion by 2020. And thanks to shifting dynamics, such as industrialization and the rise and fall of political regimes, the world’s largest economies driving this global growth have changed over time.
This slideshow using graphics from Ruben Berge Mathisen show the distribution of global GDP among countries in 1970, 1995, and 2020.
Methodology
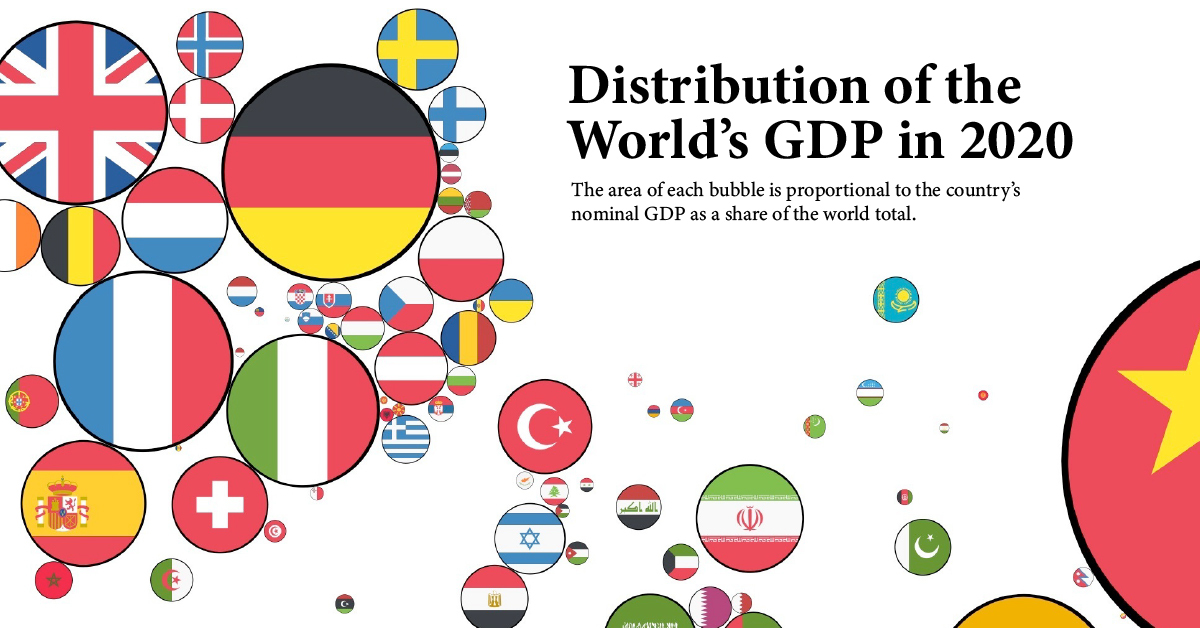
Using data from the United Nations, Mathisen collected nominal GDP in U.S. dollars for each country. He then determined each country’s GDP as a share of global GDP and sized each graphic’s bubbles accordingly.
The bubbles were placed according to country latitude and longitude coordinates, but Mathisen programmed the bubbles so that they wouldn’t overlap with each other. For this reason, some countries are slightly displaced from their exact locations on a map.
1970: USSR as a Major Player
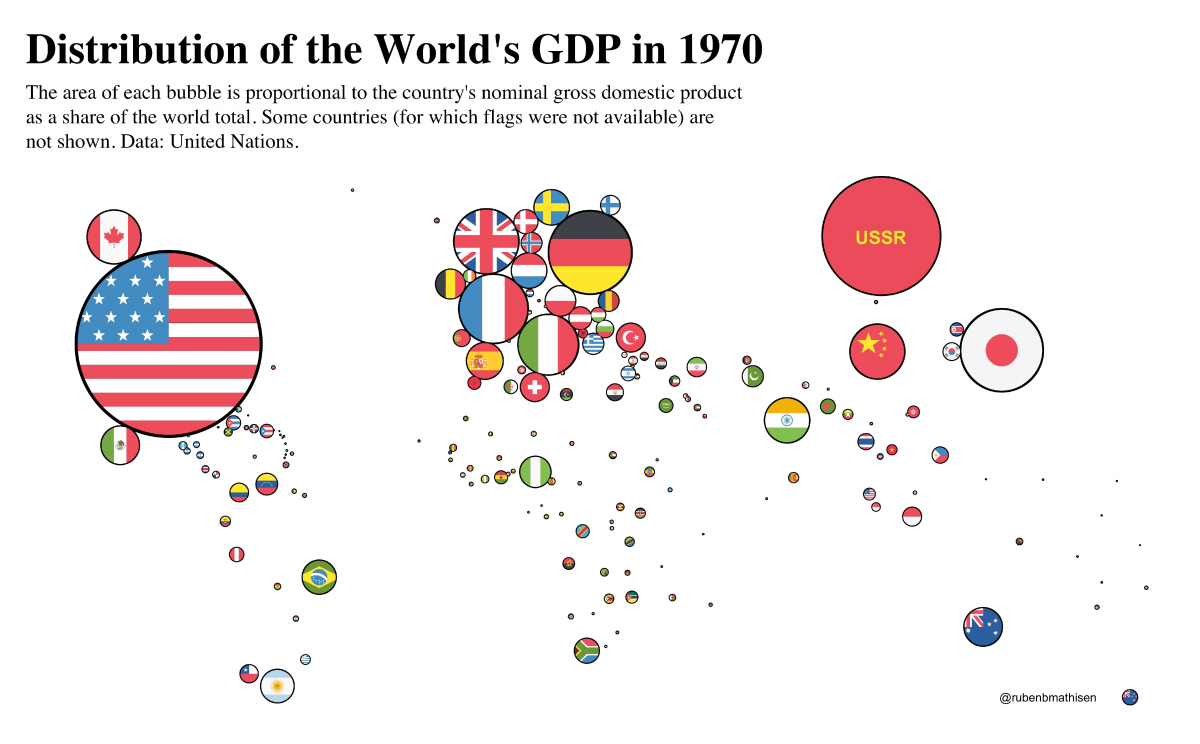
In 1970, the U.S. accounted for the largest share of global GDP, making up nearly one-third of the world economy. The table below shows the top 10 economies in 1970.
| Rank | Country | GDP (1970) | Share of Global GDP |
|---|---|---|---|
| #1 | 🇺🇸 United States | $1.1T | 31.4 % |
| #2 | ☭ USSR | $433B | 12.7 % |
| #3 | 🇩🇪 Germany | $216B | 6.3 % |
| #4 | 🇯🇵 Japan | $213B | 6.2 % |
| #5 | 🇫🇷 France | $148B | 4.3 % |
| #6 | 🇬🇧 UK | $131B | 3.8 % |
| #7 | 🇮🇹 Italy | $113B | 3.3 % |
| #8 | 🇨🇳 China | $93B | 2.7 % |
| #9 | 🇨🇦 Canada | $89B | 2.6 % |
| #10 | 🇮🇳 India | $62B | 1.8 % |
Then a global superpower, the former Union of Soviet Socialist Republics (USSR) came in second place on the list of the world’s largest economies.
In the years leading up to 1970, the USSR had seen impressive GDP growth largely due to adopting Western technologies that increased productivity. However, the USSR’s economy began to stagnate in the ‘70s, and eventually collapsed in 1991.
On the other side, Germany (including both West and East Germany) was the third-largest economy in 1970 after rising from economic ruin following World War II. West Germany’s “Economic Miracle” is largely credited to the introduction of a new currency to replace the Riechsmark, large tax cuts brought in to spur investment, and the removal of price controls.
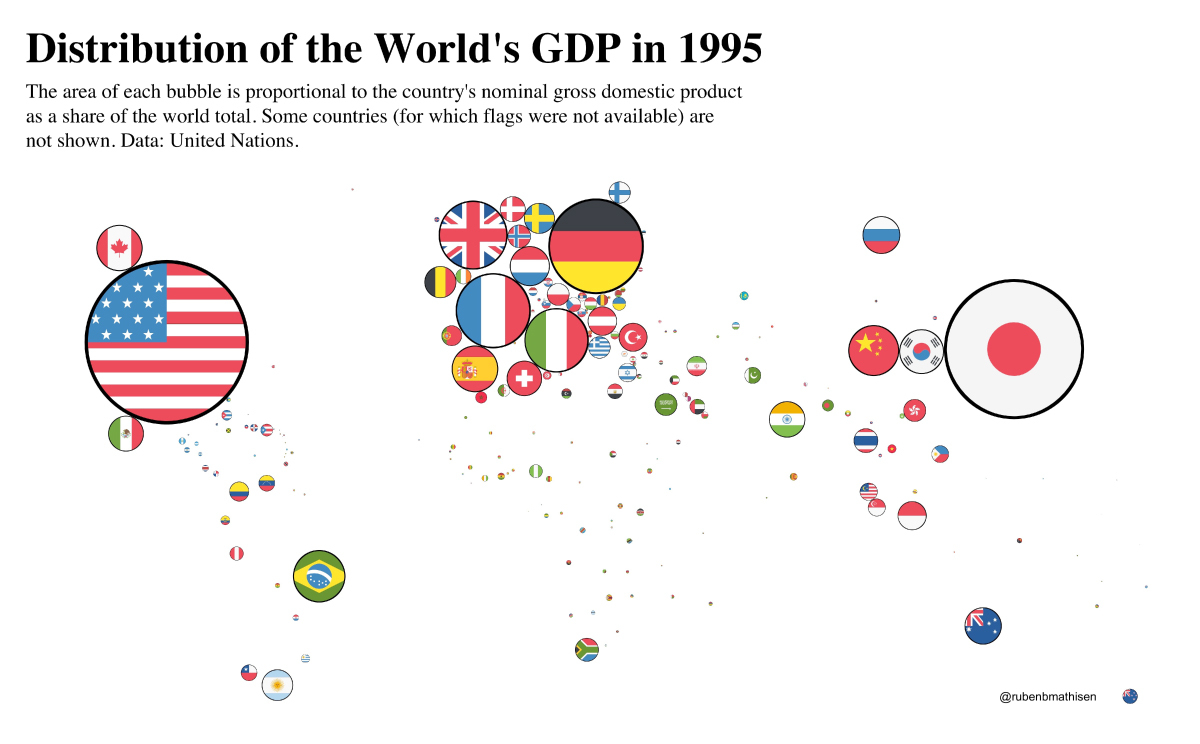
1995: Japan Begins to Slow Down
By 1995, the U.S. still held the top spot on the world’s largest economies list, but the country’s share of global GDP had shrunk.
| Rank | Country/Area | GDP (1995) | Share of Global GDP |
|---|---|---|---|
| #1 | 🇺🇸 United States | $7.6T | 24.4 % |
| #2 | 🇯🇵 Japan | $5.5T | 17.7 % |
| #3 | 🇩🇪 Germany | $2.6T | 8.3 % |
| #4 | 🇫🇷 France | $1.6T | 5.1 % |
| #5 | 🇬🇧 UK | $1.3T | 4.3 % |
| #6 | 🇮🇹 Italy | $1.2T | 3.8 % |
| #7 | 🇧🇷 Brazil | $778B | 2.5 % |
| #8 | 🇨🇳 China | $734B | 2.4 % |
| #9 | 🇪🇸 Spain | $615B | 2.0 % |
| #10 | 🇨🇦 Canada | $606B | 1.9 % |
Meanwhile, Japan had leapfrogged into second place and nearly tripled its share of the global economy compared to 1970. A number of factors played into Japan’s economic success:
- Large business groups known as keiretsu used their connections to undercut rivals
- Fierce competition between companies encouraged innovation
- Tax breaks and cheap credit stimulated investment
- The well-educated workforce was willing to work extremely long hours
But around 1990, the country’s economy had actually begun to slow down. Japan’s decreasing labor force participation rate and diminishing returns from higher education both could have played a role.
2020: The World’s Largest Economies Shift Again
In 2020, the United States continued to hold onto the number one spot among the world’s largest economies. However, Japan’s slowdown created a rare opportunity for a new powerhouse to emerge: China.
| Rank | Country/Area | GDP (2020) | Share of Global GDP |
|---|---|---|---|
| #1 | 🇺🇸 United States | $20.9T | 24.5 % |
| #2 | 🇨🇳 China | $14.7T | 17.3 % |
| #3 | 🇯🇵 Japan | $5.1T | 5.9 % |
| #4 | 🇩🇪 Germany | $3.8T | 4.5 % |
| #5 | 🇬🇧 UK | $2.8T | 3.2 % |
| #6 | 🇮🇳 India | $2.7T | 3.1 % |
| #7 | 🇫🇷 France | $2.6T | 3.1 % |
| #8 | 🇮🇹 Italy | $1.9T | 2.2 % |
| #9 | 🇨🇦 Canada | $1.6T | 1.9 % |
| #10 | 🇰🇷 South Korea | $1.6T | 1.9 % |
China’s economy saw incredible growth following economic reforms in 1978. The reforms encouraged the formation of private businesses, liberalized foreign trade and investment, relaxed state control over some prices, and invested in industrial production and the education of its workforce. With profit incentives introduced to private businesses, productivity increased.
China was also positioned as a cheap manufacturing hub for multinational corporations. Since rising into contention, the country has become the world’s largest exporter.
India held the title of the sixth largest economy in 2020. Similar to China, the country’s growth came from relaxed economic restrictions, and it has seen particularly strong growth within the service sector, including telecommunications, IT, and software.
With dynamics shifting, which countries will be on the leaderboard in another 25 years?

This article was published as a part of Visual Capitalist's Creator Program, which features data-driven visuals from some of our favorite Creators around the world.


Markets
U.S. Debt Interest Payments Reach $1 Trillion
U.S. debt interest payments have surged past the $1 trillion dollar mark, amid high interest rates and an ever-expanding debt burden.


U.S. Debt Interest Payments Reach $1 Trillion
This was originally posted on our Voronoi app. Download the app for free on iOS or Android and discover incredible data-driven charts from a variety of trusted sources.
The cost of paying for America’s national debt crossed the $1 trillion dollar mark in 2023, driven by high interest rates and a record $34 trillion mountain of debt.
Over the last decade, U.S. debt interest payments have more than doubled amid vast government spending during the pandemic crisis. As debt payments continue to soar, the Congressional Budget Office (CBO) reported that debt servicing costs surpassed defense spending for the first time ever this year.
This graphic shows the sharp rise in U.S. debt payments, based on data from the Federal Reserve.
A $1 Trillion Interest Bill, and Growing
Below, we show how U.S. debt interest payments have risen at a faster pace than at another time in modern history:
| Date | Interest Payments | U.S. National Debt |
|---|---|---|
| 2023 | $1.0T | $34.0T |
| 2022 | $830B | $31.4T |
| 2021 | $612B | $29.6T |
| 2020 | $518B | $27.7T |
| 2019 | $564B | $23.2T |
| 2018 | $571B | $22.0T |
| 2017 | $493B | $20.5T |
| 2016 | $460B | $20.0T |
| 2015 | $435B | $18.9T |
| 2014 | $442B | $18.1T |
| 2013 | $425B | $17.2T |
| 2012 | $417B | $16.4T |
| 2011 | $433B | $15.2T |
| 2010 | $400B | $14.0T |
| 2009 | $354B | $12.3T |
| 2008 | $380B | $10.7T |
| 2007 | $414B | $9.2T |
| 2006 | $387B | $8.7T |
| 2005 | $355B | $8.2T |
| 2004 | $318B | $7.6T |
| 2003 | $294B | $7.0T |
| 2002 | $298B | $6.4T |
| 2001 | $318B | $5.9T |
| 2000 | $353B | $5.7T |
| 1999 | $353B | $5.8T |
| 1998 | $360B | $5.6T |
| 1997 | $368B | $5.5T |
| 1996 | $362B | $5.3T |
| 1995 | $357B | $5.0T |
| 1994 | $334B | $4.8T |
| 1993 | $311B | $4.5T |
| 1992 | $306B | $4.2T |
| 1991 | $308B | $3.8T |
| 1990 | $298B | $3.4T |
| 1989 | $275B | $3.0T |
| 1988 | $254B | $2.7T |
| 1987 | $240B | $2.4T |
| 1986 | $225B | $2.2T |
| 1985 | $219B | $1.9T |
| 1984 | $205B | $1.7T |
| 1983 | $176B | $1.4T |
| 1982 | $157B | $1.2T |
| 1981 | $142B | $1.0T |
| 1980 | $113B | $930.2B |
| 1979 | $96B | $845.1B |
| 1978 | $84B | $789.2B |
| 1977 | $69B | $718.9B |
| 1976 | $61B | $653.5B |
| 1975 | $55B | $576.6B |
| 1974 | $50B | $492.7B |
| 1973 | $45B | $469.1B |
| 1972 | $39B | $448.5B |
| 1971 | $36B | $424.1B |
| 1970 | $35B | $389.2B |
| 1969 | $30B | $368.2B |
| 1968 | $25B | $358.0B |
| 1967 | $23B | $344.7B |
| 1966 | $21B | $329.3B |
Interest payments represent seasonally adjusted annual rate at the end of Q4.
At current rates, the U.S. national debt is growing by a remarkable $1 trillion about every 100 days, equal to roughly $3.6 trillion per year.
As the national debt has ballooned, debt payments even exceeded Medicaid outlays in 2023—one of the government’s largest expenditures. On average, the U.S. spent more than $2 billion per day on interest costs last year. Going further, the U.S. government is projected to spend a historic $12.4 trillion on interest payments over the next decade, averaging about $37,100 per American.
Exacerbating matters is that the U.S. is running a steep deficit, which stood at $1.1 trillion for the first six months of fiscal 2024. This has accelerated due to the 43% increase in debt servicing costs along with a $31 billion dollar increase in defense spending from a year earlier. Additionally, a $30 billion increase in funding for the Federal Deposit Insurance Corporation in light of the regional banking crisis last year was a major contributor to the deficit increase.
Overall, the CBO forecasts that roughly 75% of the federal deficit’s increase will be due to interest costs by 2034.

-

 Real Estate2 weeks ago
Visualizing America’s Shortage of Affordable Homes
-

 Technology1 week ago
Ranked: Semiconductor Companies by Industry Revenue Share
-

 Money1 week ago
Which States Have the Highest Minimum Wage in America?
-

 Real Estate1 week ago
Ranked: The Most Valuable Housing Markets in America
-

 Business2 weeks ago
Charted: Big Four Market Share by S&P 500 Audits
-

 AI2 weeks ago
The Stock Performance of U.S. Chipmakers So Far in 2024
-

 Misc2 weeks ago
Almost Every EV Stock is Down After Q1 2024
-

 Money2 weeks ago
Where Does One U.S. Tax Dollar Go?