Maps
The Type of Business Every Country Wants to Start
Article/Editing:
View a higher resolution version of this map.
The Type of Business Every Country Wants to Start
View a higher resolution version of this map.
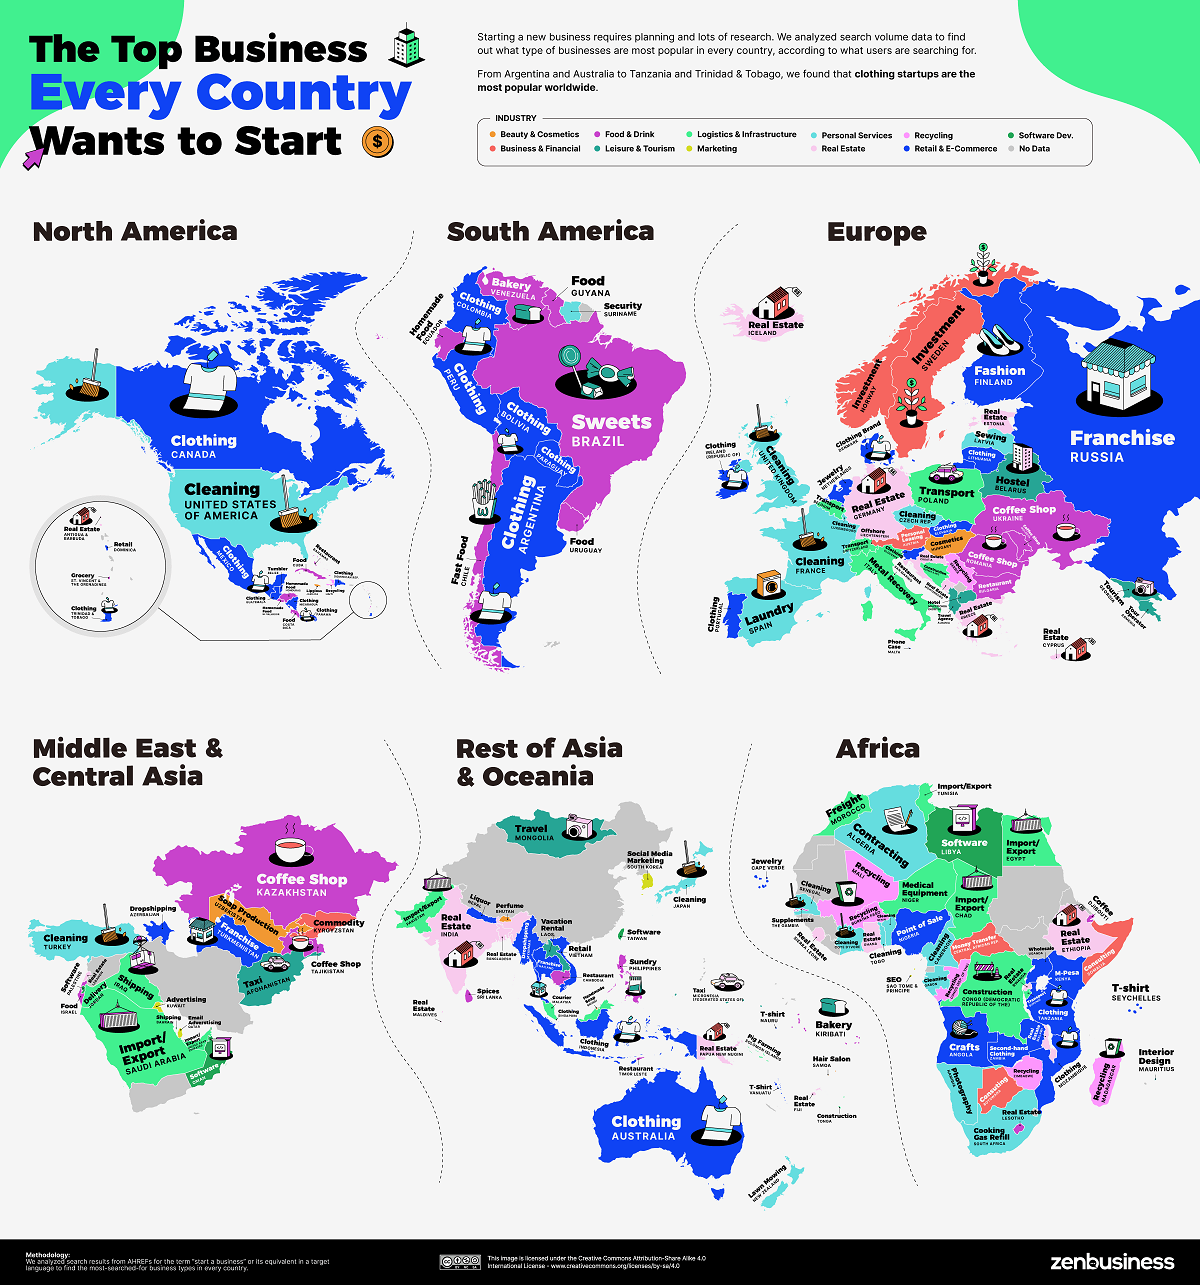
Every year, millions of new businesses are started across the world—in 2021, nearly 5.4 million new business applications were filed in the U.S. alone.
And since startups and new businesses play a significant role in shaping a country’s economic growth, encouraging entrepreneurship is vital. But what types of businesses around the world are people most interested in starting?
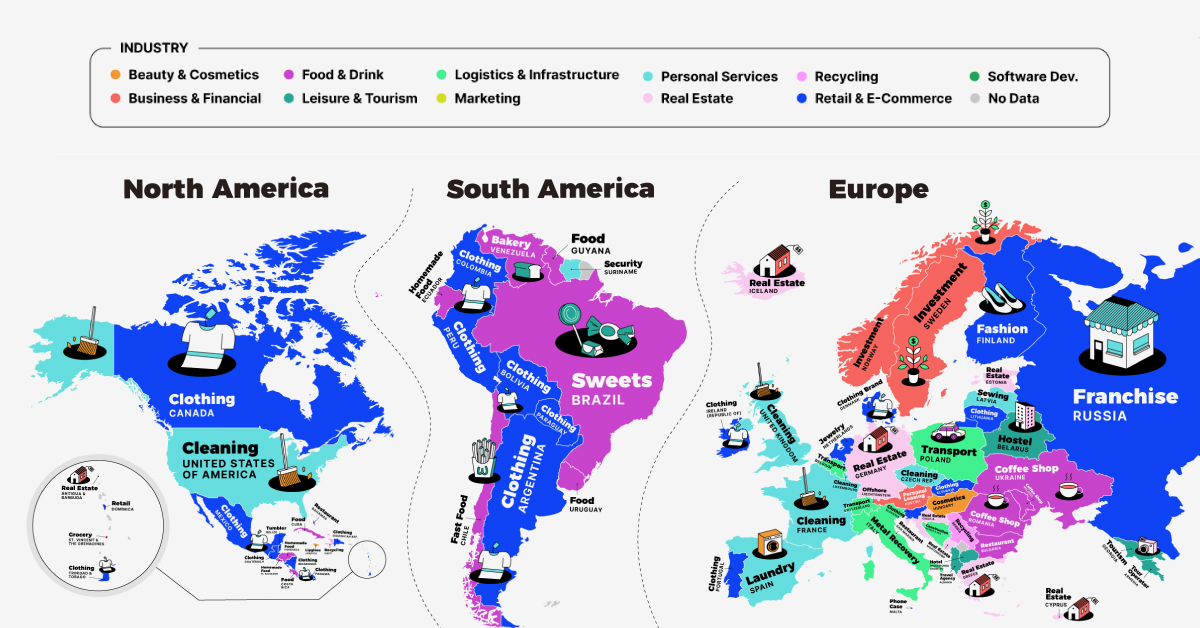
These maps by ZenBusiness show the most popular types of businesses that entrepreneurs in nearly every country want to start, based on analyzing relevant internet search results.
Most Searched Businesses Around the World
To source the data, ZenBusiness analyzed searches from Ahrefs, specifically looking for the term “start a business” and its equivalents in local languages as of February 2022.
They then found the relevant topic or keyword with the highest search volume, and organized the results into 11 different industries:
- Beauty & Cosmetics
- Food & Drink
- Logistics & Infrastructure
- Personal Services
- Recycling
- Software Development
- Business & Financial
- Leisure & Tourism
- Marketing
- Real Estate
- Retail & E-Commerce
The data showed that the industries entrepreneurs are most attracted to vary greatly from country to country, depending on a variety of factors such as infrastructure, business climate, and culture.
Here’s a breakdown of the most searched businesses around the world, broken down by region.
Africa
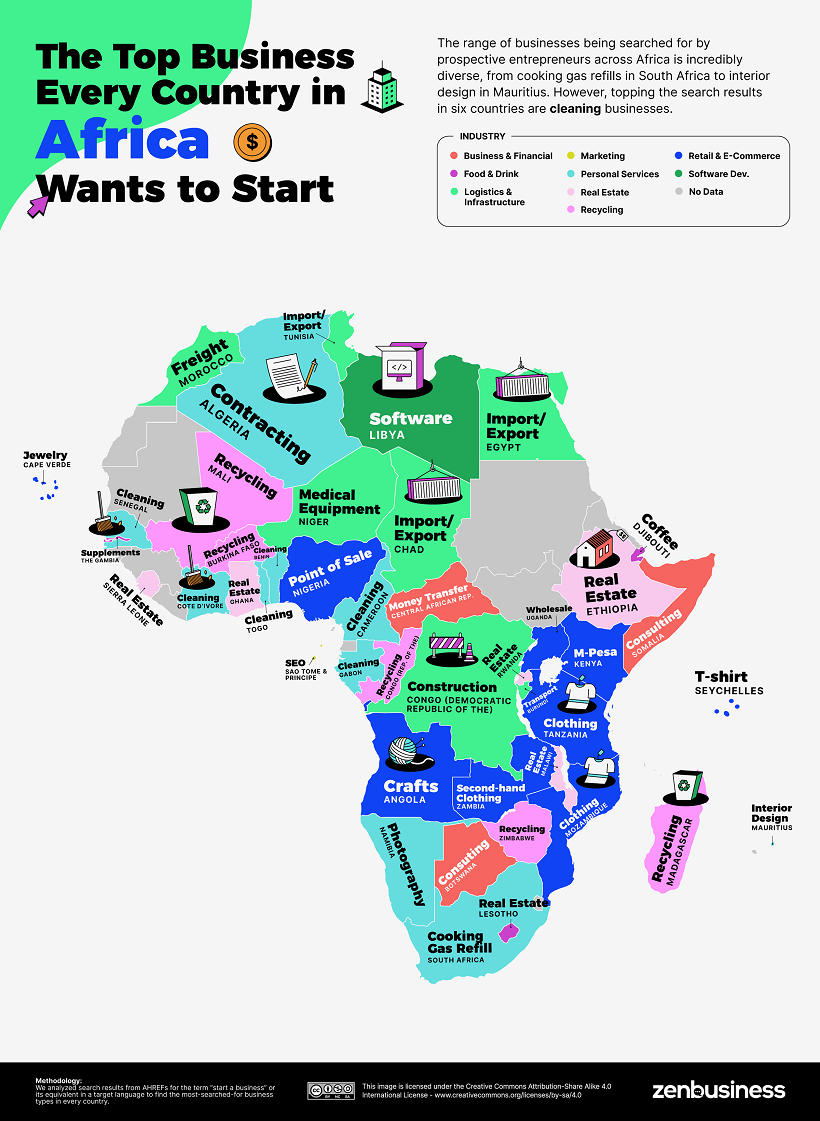
From cooking gas refills in South Africa to supplements in the Gambia, entrepreneurs across Africa seem to be interested in starting a wide range of businesses (at least according to their searches).
But while the results varied across the region, the most-searched industry was personal services such as cleaning, interior design, and contracting. Cleaning was especially popular, ranking first in six different African countries.
One African country worth highlighting is Morocco, where freight is the most-searched startup term across the country. This makes sense considering Morocco is home to several major ports, including the Port of Tanger Med, which is Africa’s largest port by cargo capacity.
Europe
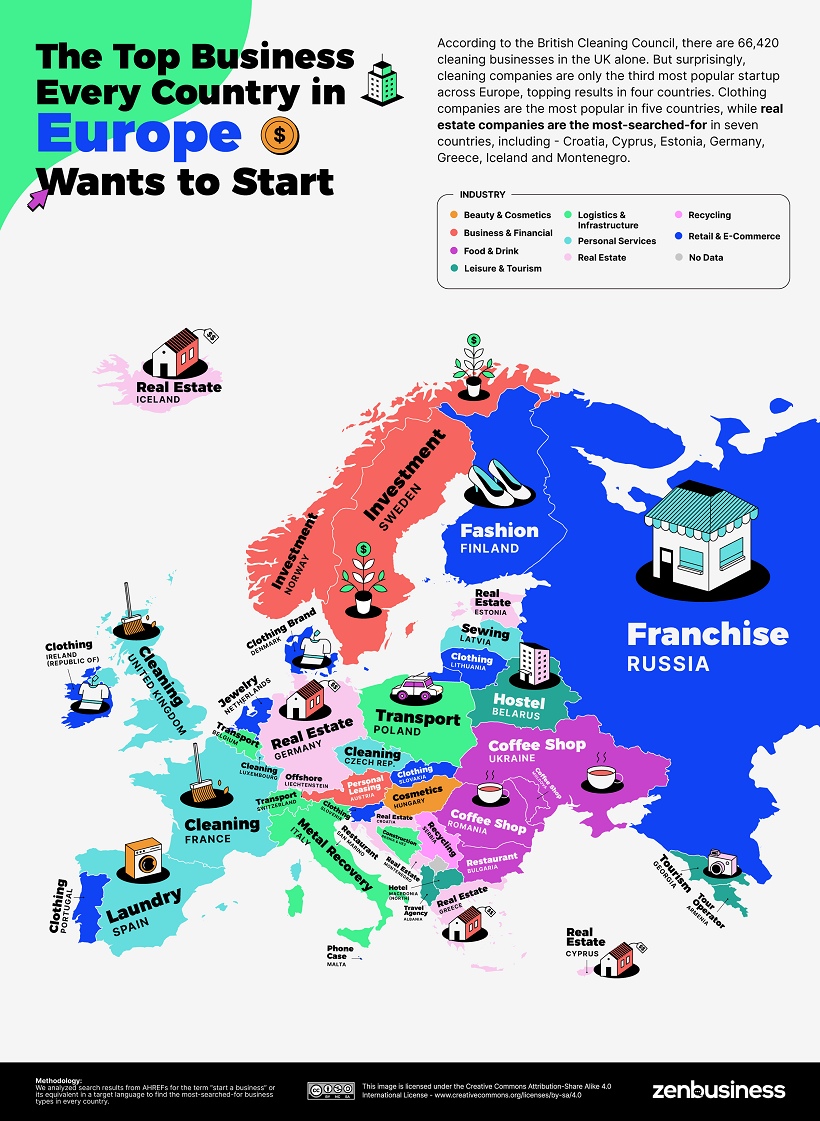
In Europe, real estate is the most-searched industry, ranking number one in seven different countries across the continent. Over the last decade, the European Union’s real estate market has boomed—between 2010 and 2021, home prices in the EU increased by 42%.
Retail is also a popular industry across Europe, with clothing-related searching taking the top spot in five different European countries.
Middle East & Central Asia
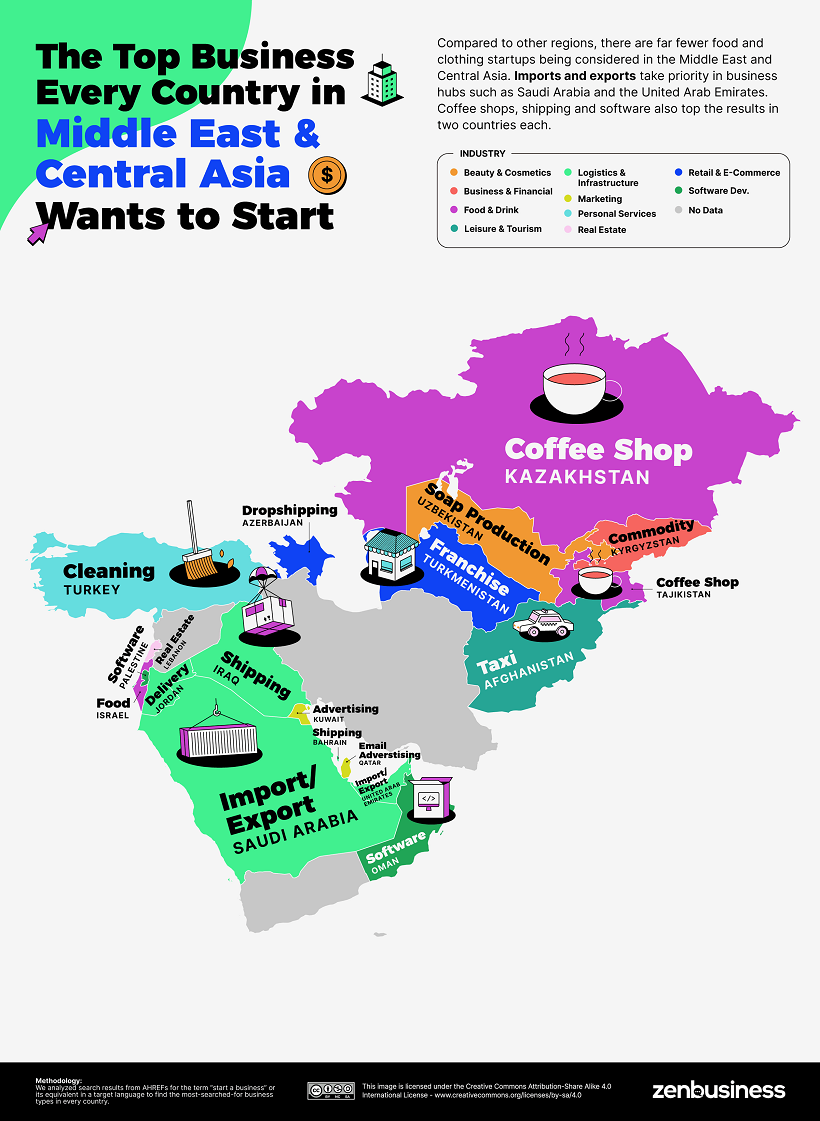
From soap production in Uzbekistan to dropshipping in Azerbaijan, the Middle East & Central Asia have the most diverse searches compared to any other region.
One particularly interesting top search was in the United Arab Emirates, where imports and exports ranked first. The UAE’s economy is heavily reliant on trade, especially oil, which makes up 30% of the region’s GDP and 41% of public revenues.
Rest of Asia & Oceania
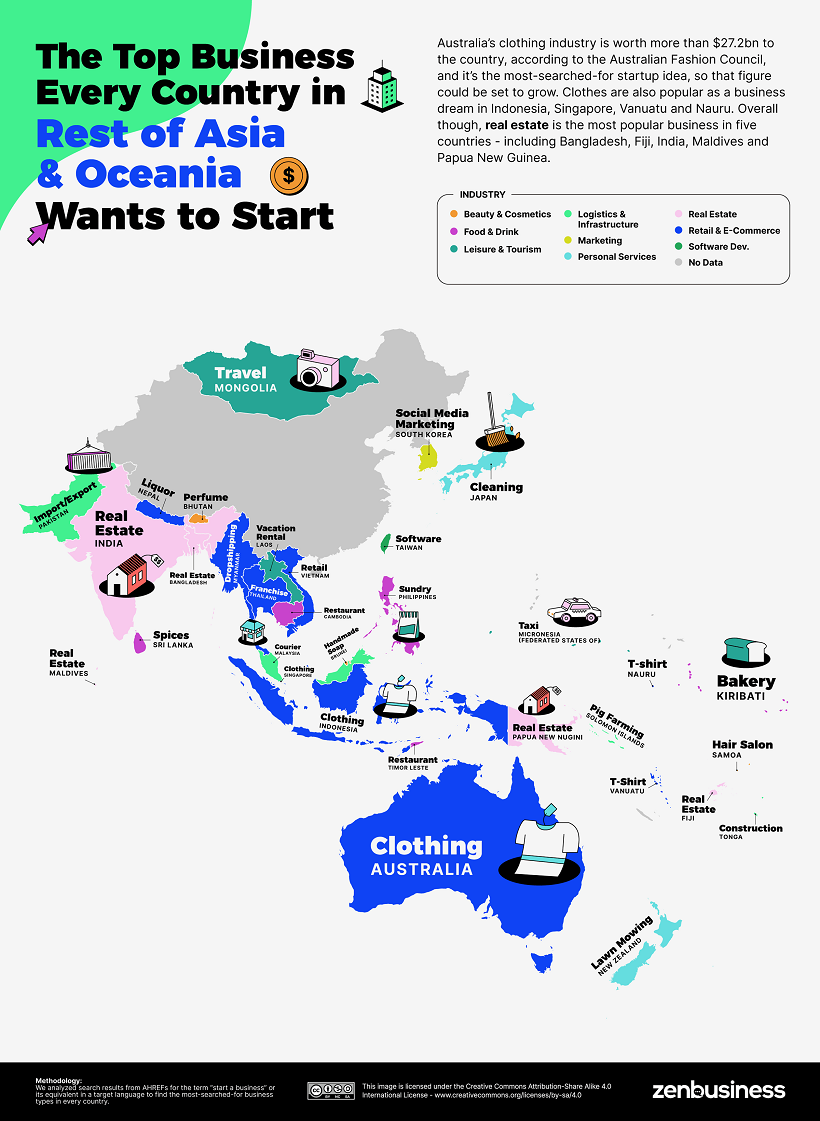
Asia and Oceania had an interesting mix of unique business searches. For instance, pig farming ranked number one in the Solomon Islands, and lawn moving took the top spot in New Zealand.
But generally speaking, retail was one of the most-searched-for business types across this region, with clothing taking the top spot in countries like Australia, Indonesia, and Singapore.
North America
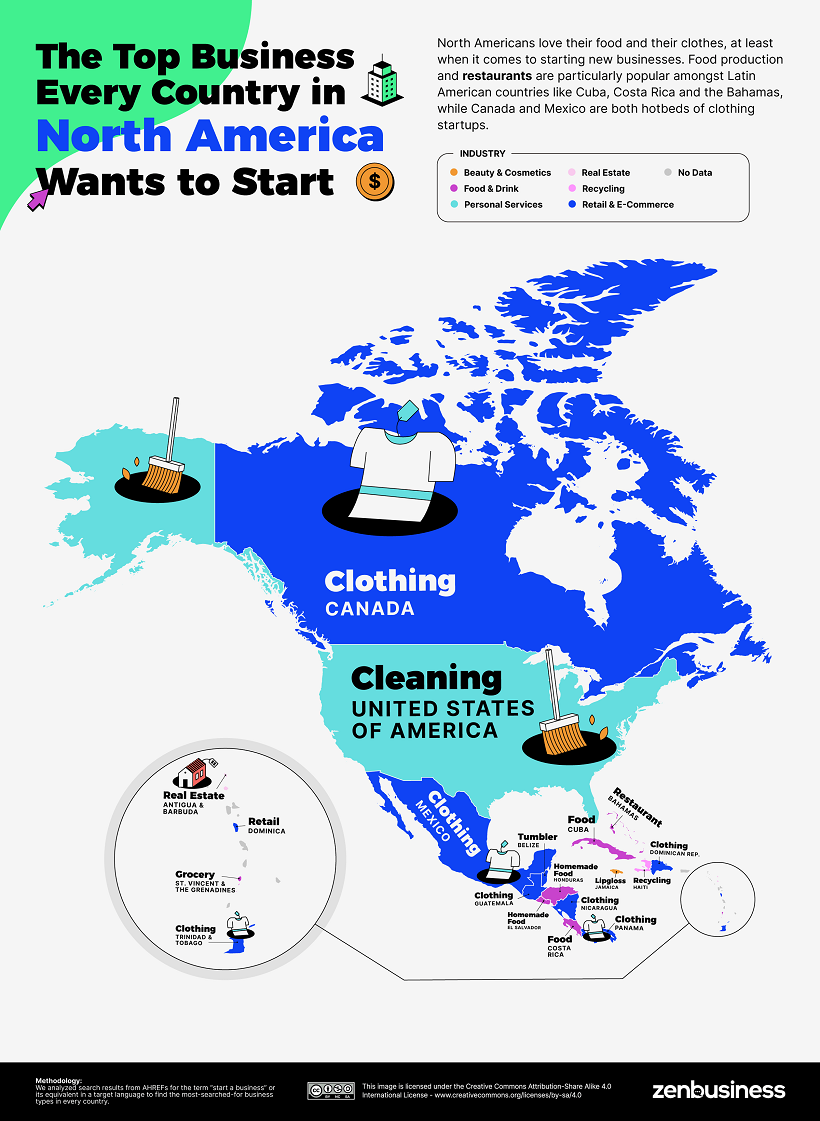
Across North America, retail takes the top spot for most searched business type. In fact, the top searches in nearly half of the region’s countries are related to the retail or e-commerce industry.
The U.S. currently has the largest retail market in the world, although China is close on its heels. In 2021, America’s retail market was valued at over $6.5 trillion U.S. dollars.
South America
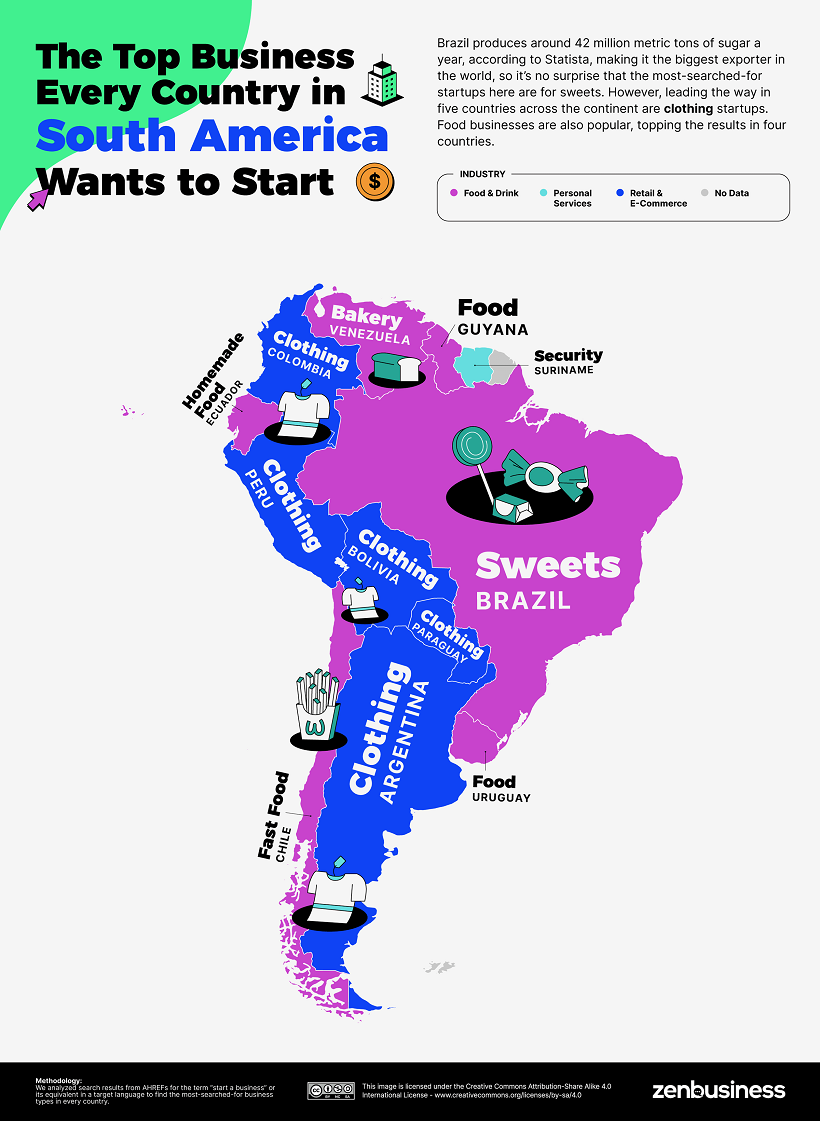
Food was the top searched industry across South America, ranking number one in half the countries across the region. In Brazil, sweets took the top spot, which might not be surprising considering the country is the top sugar cane producer worldwide.
Clothing was also a popular business idea, taking the top spot in five South American countries.
Which countries surprised you the most with their new business interest?

This article was published as a part of Visual Capitalist's Creator Program, which features data-driven visuals from some of our favorite Creators around the world.


Maps
The Largest Earthquakes in the New York Area (1970-2024)
The earthquake that shook buildings across New York in April 2024 was the third-largest quake in the Northeast U.S. over the past 50 years.


The Largest Earthquakes in the New York Area
This was originally posted on our Voronoi app. Download the app for free on Apple or Android and discover incredible data-driven charts from a variety of trusted sources.
The 4.8 magnitude earthquake that shook buildings across New York on Friday, April 5th, 2024 was the third-largest quake in the U.S. Northeast area over the past 50 years.
In this map, we illustrate earthquakes with a magnitude of 4.0 or greater recorded in the Northeastern U.S. since 1970, according to the United States Geological Survey (USGS).
Shallow Quakes and Older Buildings
The earthquake that struck the U.S. Northeast in April 2024 was felt by millions of people from Washington, D.C., to north of Boston. It even caused a full ground stop at Newark Airport.
The quake, occurring just 5 km beneath the Earth’s surface, was considered shallow, which is what contributed to more intense shaking at the surface.
According to the USGS, rocks in the eastern U.S. are significantly older, denser, and harder than those on the western side, compressed by time. This makes them more efficient conduits for seismic energy. Additionally, buildings in the Northeast tend to be older and may not adhere to the latest earthquake codes.
Despite disrupting work and school life, the earthquake was considered minor, according to the Michigan Technological University magnitude scale:
| Magnitude | Earthquake Effects | Estimated Number Each Year |
|---|---|---|
| 2.5 or less | Usually not felt, but can be recorded by seismograph. | Millions |
| 2.5 to 5.4 | Often felt, but only causes minor damage. | 500,000 |
| 5.5 to 6.0 | Slight damage to buildings and other structures. | 350 |
| 6.1 to 6.9 | May cause a lot of damage in very populated areas. | 100 |
| 7.0 to 7.9 | Major earthquake. Serious damage. | 10-15 |
| 8.0 or greater | Great earthquake. Can totally destroy communities near the epicenter. | One every year or two |
The largest earthquake felt in the area over the past 50 years was a 5.3 magnitude quake that occurred in Au Sable Forks, New York, in 2002. It damaged houses and cracked roads in a remote corner of the Adirondack Mountains, but caused no injuries.
| Date | Magnitude | Location | State |
|---|---|---|---|
| April 20, 2002 | 5.3 | Au Sable Forks | New York |
| October 7, 1983 | 5.1 | Newcomb | New York |
| April 5, 2024 | 4.8 | Whitehouse Station | New Jersey |
| October 16, 2012 | 4.7 | Hollis Center | Maine |
| January 16, 1994 | 4.6 | Sinking Spring | Pennsylvania |
| January 19, 1982 | 4.5 | Sanbornton | New Hampshire |
| September 25, 1998 | 4.5 | Adamsville | Pennsylvania |
| June 9, 1975 | 4.2 | Altona | New York |
| May 29, 1983 | 4.2 | Peru | Maine |
| April 23, 1984 | 4.2 | Conestoga | Pennsylvania |
| January 16, 1994 | 4.2 | Sinking Spring | Pennsylvania |
| November 3, 1975 | 4 | Long Lake | New York |
| June 17, 1991 | 4 | Worcester | New York |
The largest earthquake in U.S. history, however, was the 1964 Good Friday quake in Alaska, measuring 9.2 magnitude and killing 131 people.

-

 Markets2 weeks ago
Visualizing America’s Shortage of Affordable Homes
-

 Technology1 week ago
Ranked: Semiconductor Companies by Industry Revenue Share
-

 Money1 week ago
Which States Have the Highest Minimum Wage in America?
-

 Real Estate1 week ago
Ranked: The Most Valuable Housing Markets in America
-

 Markets2 weeks ago
Charted: Big Four Market Share by S&P 500 Audits
-

 AI2 weeks ago
The Stock Performance of U.S. Chipmakers So Far in 2024
-

 Automotive2 weeks ago
Almost Every EV Stock is Down After Q1 2024
-

 Money2 weeks ago
Where Does One U.S. Tax Dollar Go?