Misc
Visualized: The Top Feeder Schools into Silicon Valley
Article/Editing:
var divElement = document.getElementById(‘viz1665755752039’); var vizElement = divElement.getElementsByTagName(‘object’)[0]; vizElement.style.width=’1200px’;vizElement.style.height=’1627px’; var scriptElement = document.createElement(‘script’); scriptElement.src = ‘https://public.tableau.com/javascripts/api/viz_v1.js’; vizElement.parentNode.insertBefore(scriptElement, vizElement);
Open the large interactive version here
Open the large interactive version here
Visualized: The Top Feeder Schools into Silicon Valley
Silicon Valley is one of the largest and most prominent tech hubs in the world. It accounts for about one-third of America’s national investment capital and it houses the headquarters of over 30 companies in the Fortune 1000.
Given its world-class reputation, it’s the dream of many tech workers to land a job in a Silicon Valley company. But what’s the best route for getting there?
While there is certainly no clear-cut path, one way to try and answer this question is by looking at the universities and colleges that Silicon Valley employees graduate from.
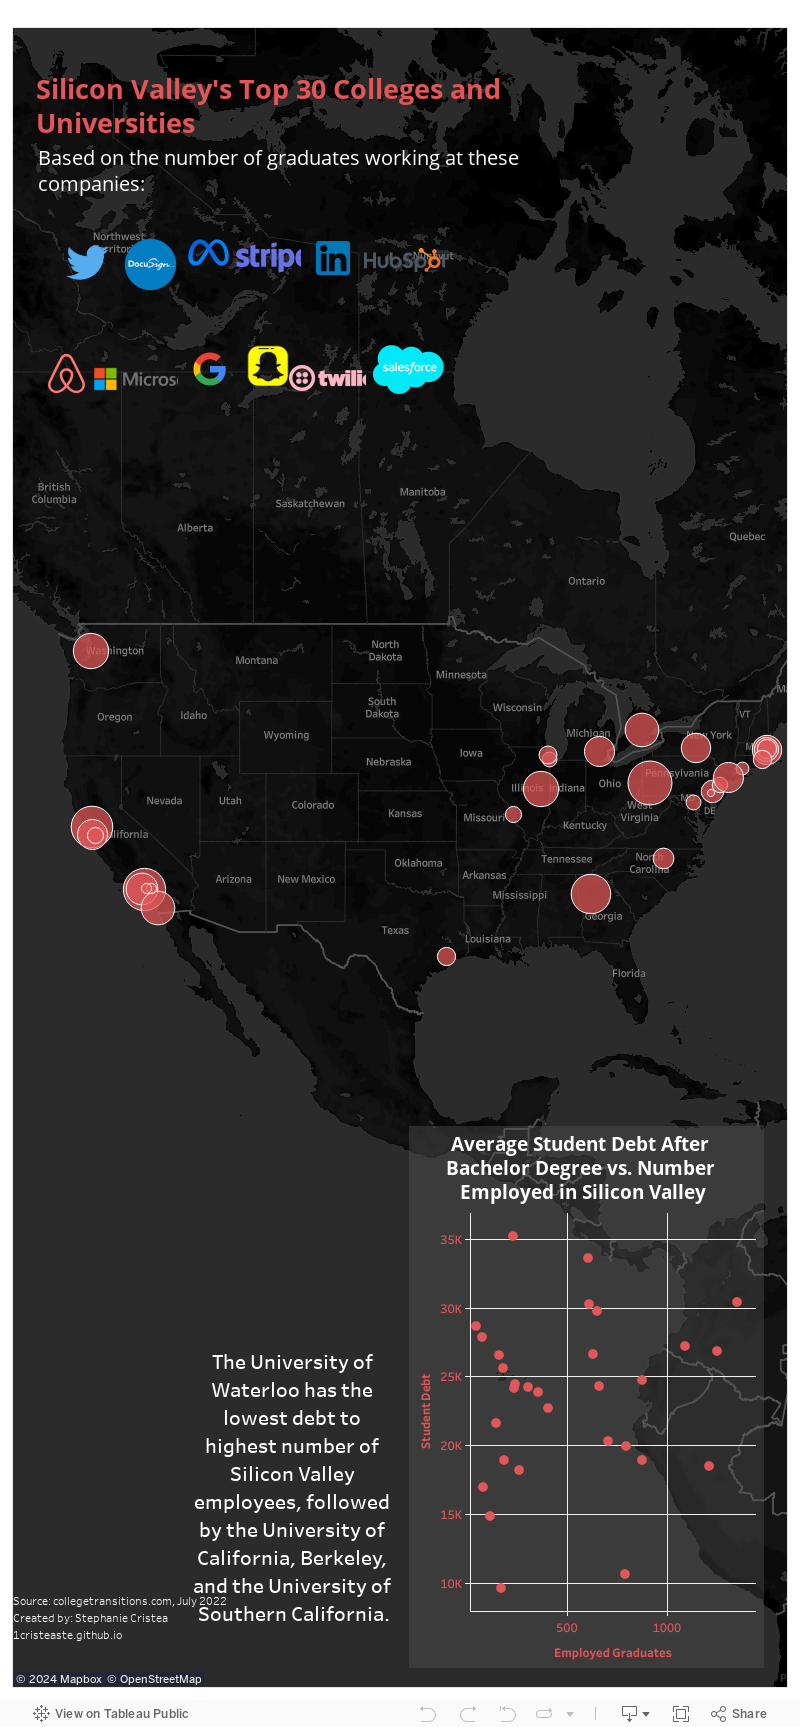
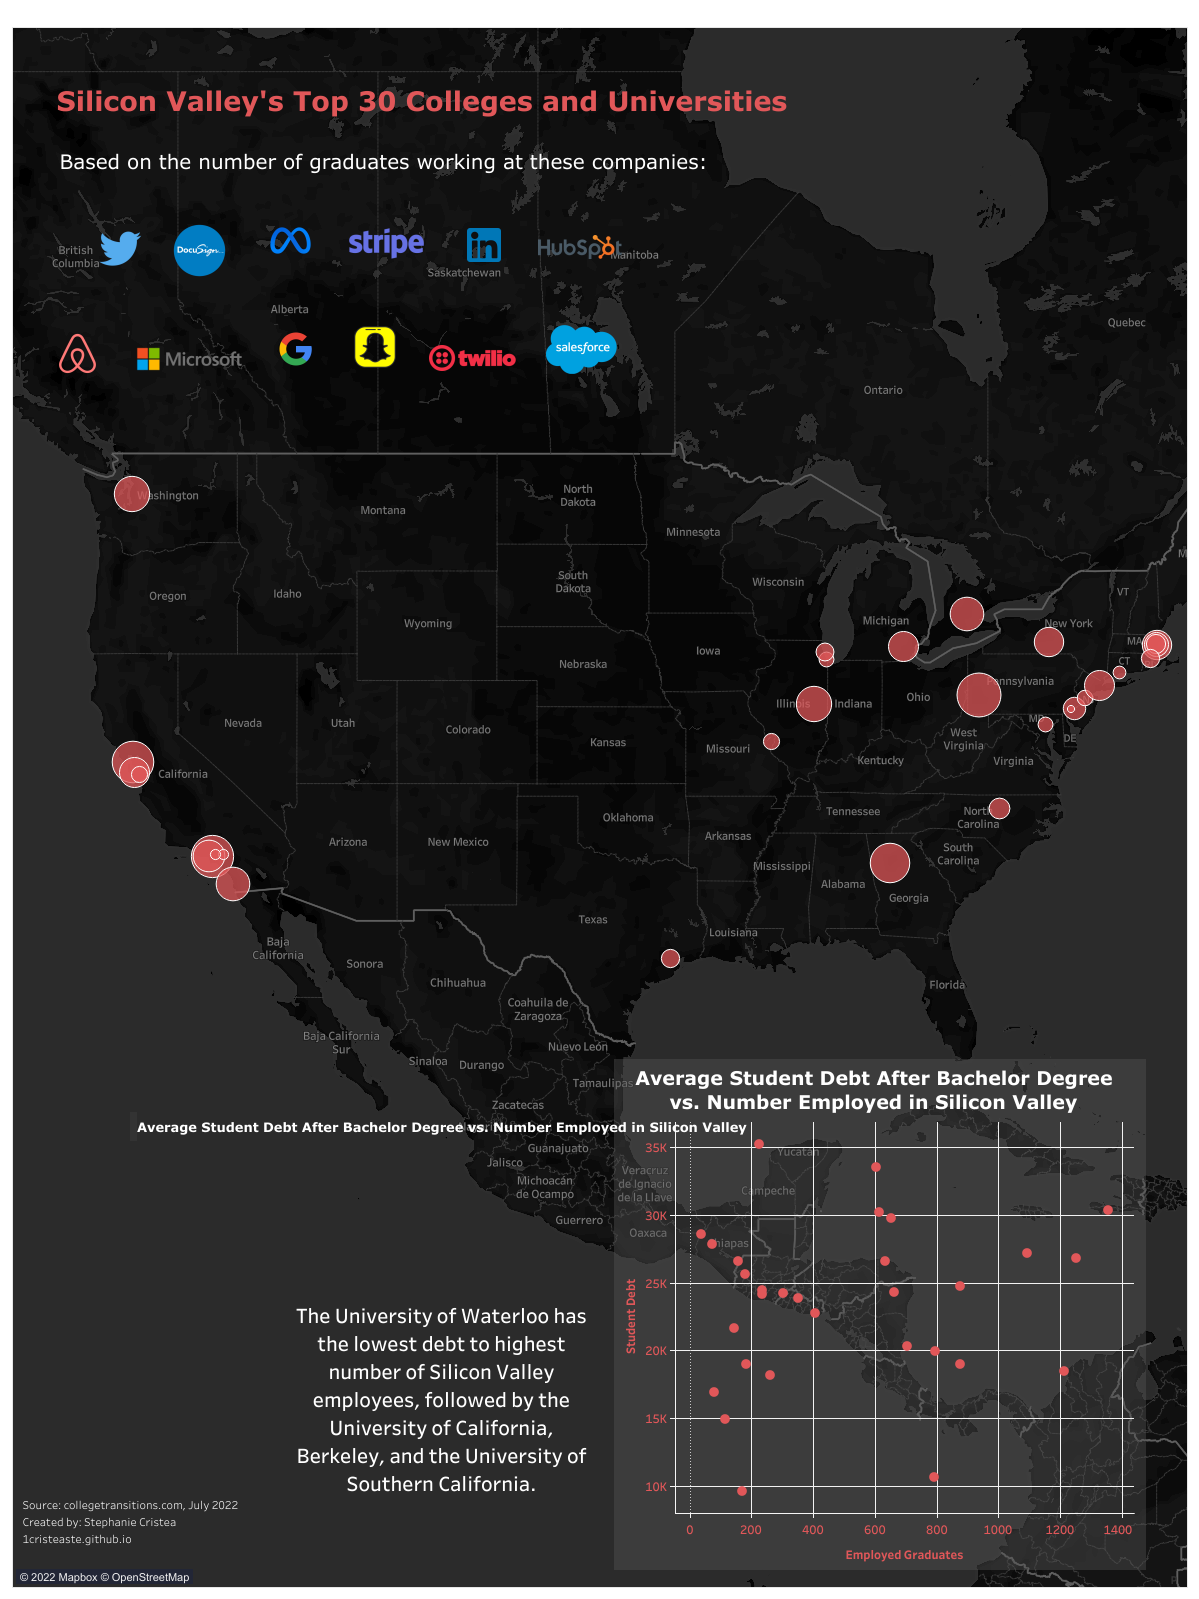
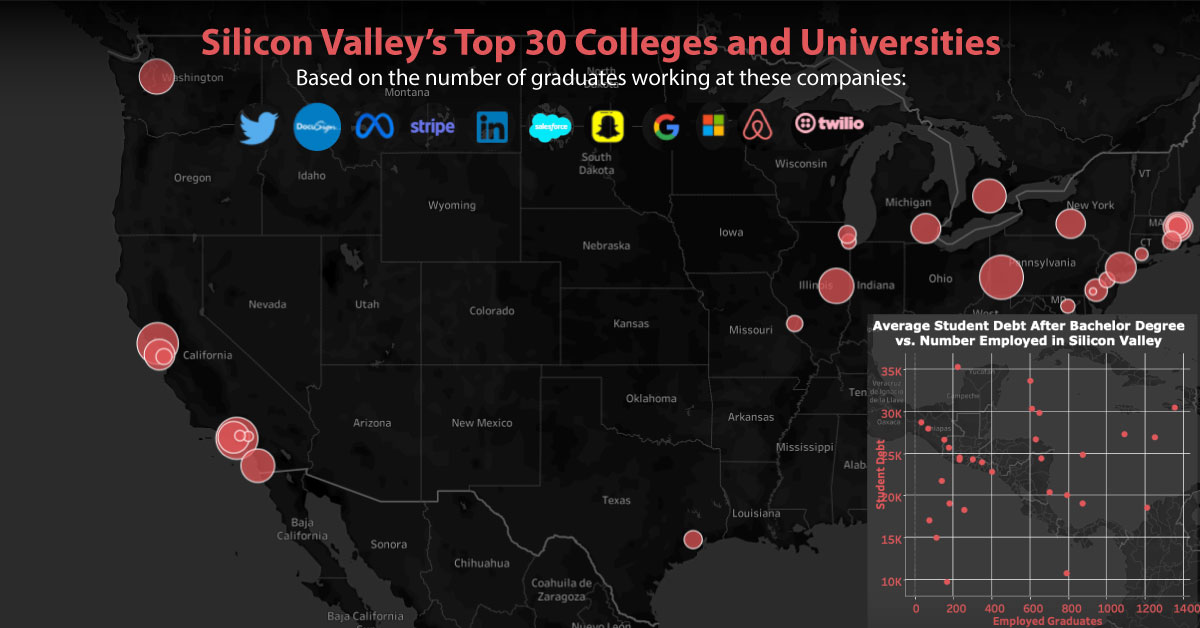
This interactive map by Stephanie Cristea shows the top feeder schools to some of the largest companies in Silicon Valley.
A Look at The Top 30 Schools
The data for this graphic comes from a study by College Transitions, which looks at the top feeder schools for 12 different companies with employees in Silicon Valley, including Twitter, Alphabet, DocuSign, Meta, and eight other large businesses.
Using publicly available data from LinkedIn, the study looked at more than 70,000 entry level engineers and IT employees at these 12 different companies, and identified where they received their undergraduate degree.
Here are the findings of the top 30 feeder schools across all 12 companies:
| Rank (Total) | Institution | # Employed | Top Employer |
|---|---|---|---|
| 1 | Carnegie Mellon University | 1,356 | |
| 2 | University of Southern California | 1,252 | |
| 3 | University of California, Berkeley | 1,212 | |
| 4 | Georgia Institute of Technology | 1,094 | Microsoft |
| 5 | University of Illinois at Urbana-Champaign | 877 | |
| 6 | University of Washington | 876 | Microsoft |
| 7 | University of California, San Diego | 795 | |
| 8 | University of Waterloo | 793 | |
| 9 | University of California, Los Angeles | 704 | |
| 10 | Stanford University | 661 | |
| 11 | Columbia University | 651 | |
| 12 | University of Michigan | 632 | |
| 13 | Cornell University | 612 | |
| 14 | Northeastern University | 604 | |
| 15 | University of Texas at Austin | 578 | |
| 16 | University of California, Irvine | 482 | |
| 17 | San Jose State University | 470 | |
| 18 | Purdue University | 469 | Microsoft |
| 19 | University of Toronto | 466 | |
| 20 | New York University | 464 | |
| 21 | Massachusetts Institute of Technology | 405 | |
| 22 | University of Pennsylvania | 352 | |
| 23 | University of California, Davis | 333 | |
| 24 | North Carolina State University | 329 | |
| 25 | University of Maryland | 309 | |
| 26 | Duke University | 304 | |
| 27 | Harvard University | 260 | |
| 28 | University of Wisconsin, Madison | 249 | |
| 29 | University of Virginia | 244 | Microsoft |
| 30 | Brown University | 236 |
While this research is far from exhaustive, it provides a glimpse of where 12 of the largest companies in Silicon Valley source their talent, and what it takes to make it into the big leagues.
Adjusted Proportional Rankings
Next, let’s look at the ranking after being adjusted proportionally for each school’s undergraduate enrollment numbers (so smaller schools can be fairly represented in the data):
| Rank (Adjusted) | Institution | # Employed | Top Employer |
|---|---|---|---|
| 1 | Carnegie Mellon University | 1356 | |
| 2 | Columbia University | 651 | |
| 3 | Stanford University | 661 | |
| 4 | Massachusetts Institute of Technology | 405 | |
| 5 | California Institute of Technology | 78 | |
| 6 | Harvey Mudd College | 72 | |
| 7 | Georgia Institute of Technology | 1094 | Microsoft |
| 8 | University of Southern California | 1252 | |
| 9 | Rice University | 235 | |
| 10 | Harvard University | 260 | |
| 11 | Duke University | 304 | |
| 12 | Cornell University | 612 | |
| 13 | Northeastern University | 604 | |
| 14 | University of California, Berkeley | 1212 | |
| 15 | University of Pennsylvania | 352 | |
| 16 | Princeton University | 170 | |
| 17 | Brown University | 236 | |
| 18 | Santa Clara University | 180 | |
| 19 | Northwestern University | 226 | |
| 20 | University of Illinois Urbana-Champaign | 877 | |
| 21 | Swarthmore College | 36 | |
| 22 | University of California San Diego | 795 | |
| 23 | University of Washington | 876 | Microsoft |
| 24 | Yale University | 115 | |
| 25 | Washington University in St. Louis | 183 | |
| 26 | Johns Hopkins University | 143 | |
| 27 | University of Chicago | 156 | |
| 28 | University of California, Los Angeles | 704 | |
| 29 | University of Waterloo | 793 | |
| 30 | University of Michigan | 632 |
Interestingly, when looking at the adjusted figures, only two of the top 10 feeder schools are Ivy League institutions: Columbia, which comes second on the list, and Harvard, which just makes the cut at number 10.
Carnegie Mellon takes first place, with over 1,300 hired graduates across all 12 companies. While the Pittsburgh-based university is not an Ivy League school, it still has a great reputation—in a recent study by U.S. News & World Report, it ranked as one of the best universities in America.
Even with its excellent reputation, Carnegie Mellon’s acceptance rate is relatively high at 17%, especially when compared to its Ivy League counterparts like Columbia (6%) and Harvard (4%).
It’s worth mentioning that, while Ivy League didn’t dominate the top 10 list, all eight schools made it into the top 30. So, while this data shows that Silicon Valley isn’t exclusively hiring from Ivy League schools, it does indicate that these prestigious institutions have a seat at the table.

This article was published as a part of Visual Capitalist's Creator Program, which features data-driven visuals from some of our favorite Creators around the world.


Misc
How Hard Is It to Get Into an Ivy League School?
We detail the admission rates and average annual cost for Ivy League schools, as well as the median SAT scores required to be accepted.


How Hard Is It to Get Into an Ivy League School?
This was originally posted on our Voronoi app. Download the app for free on iOS or Android and discover incredible data-driven charts from a variety of trusted sources.
Ivy League institutions are renowned worldwide for their academic excellence and long-standing traditions. But how hard is it to get into one of the top universities in the U.S.?
In this graphic, we detail the admission rates and average annual cost for Ivy League schools, as well as the median SAT scores required to be accepted. The data comes from the National Center for Education Statistics and was compiled by 24/7 Wall St.
Note that “average annual cost” represents the net price a student pays after subtracting the average value of grants and/or scholarships received.
Harvard is the Most Selective
The SAT is a standardized test commonly used for college admissions in the United States. It’s taken by high school juniors and seniors to assess their readiness for college-level academic work.
When comparing SAT scores, Harvard and Dartmouth are among the most challenging universities to gain admission to. The median SAT scores for their students are 760 for reading and writing and 790 for math. Still, Harvard has half the admission rate (3.2%) compared to Dartmouth (6.4%).
| School | Admission rate (%) | SAT Score: Reading & Writing | SAT Score: Math | Avg Annual Cost* |
|---|---|---|---|---|
| Harvard University | 3.2 | 760 | 790 | $13,259 |
| Columbia University | 3.9 | 750 | 780 | $12,836 |
| Yale University | 4.6 | 760 | 780 | $16,341 |
| Brown University | 5.1 | 760 | 780 | $26,308 |
| Princeton University | 5.7 | 760 | 780 | $11,080 |
| Dartmouth College | 6.4 | 760 | 790 | $33,023 |
| University of Pennsylvania | 6.5 | 750 | 790 | $14,851 |
| Cornell University | 7.5 | 750 | 780 | $29,011 |
*Costs after receiving federal financial aid.
Additionally, Dartmouth has the highest average annual cost at $33,000. Princeton has the lowest at $11,100.
While student debt has surged in the United States in recent years, hitting $1.73 trillion in 2023, the worth of obtaining a degree from any of the schools listed surpasses mere academics. This is evidenced by the substantial incomes earned by former students.
Harvard grads, for example, have the highest average starting salary in the country, at $91,700.

-

 Maps2 weeks ago
Mapped: Average Wages Across Europe
-

 Money1 week ago
Which States Have the Highest Minimum Wage in America?
-

 Real Estate1 week ago
Ranked: The Most Valuable Housing Markets in America
-

 Markets1 week ago
Charted: Big Four Market Share by S&P 500 Audits
-

 AI1 week ago
The Stock Performance of U.S. Chipmakers So Far in 2024
-

 Automotive2 weeks ago
Almost Every EV Stock is Down After Q1 2024
-

 Money2 weeks ago
Where Does One U.S. Tax Dollar Go?
-

 Green2 weeks ago
Ranked: Top Countries by Total Forest Loss Since 2001