Technology
Animation: The Rise and Fall of Popular Web Browsers Since 1994
Article/Editing:
Animation: The Rise and Fall of Popular Web Browsers Since 1994
In its early stages, the internet was a highly technical interface that most people had difficulty navigating. But that all changed when the Mosaic web browser entered the scene in 1993.
Mosaic was one of the first “user-friendly” internet portals—although by today’s standards, the browser was actually quite difficult to access. Comparatively, modern browsers in high use today have changed exponentially.
This animated graphic by James Eagle chronicles the evolution of the web browser market, showing the rise and fall of various internet portals from January 1994 to March 2022.
The 1990s: From Mosaic to Netscape
In the early 90s, Mosaic was by far the most dominant web browser. At the time, about 97% of all internet searches were done through this popular web portal.
| Web browser | % Share (January 1994) |
|---|---|
| Mosaic | 97.0% |
| Other | 3.0% |
Mosaic was the first web browser to display images directly on a page in line with text. Earlier browsers loaded pictures as separate files, which meant users have to click, download, and open a new file in order to view them.
The pioneering portal was created by a team of university undergrads at the University of Illinois, led by 21-year-old Marc Andreessen. When Andreessen graduated, he went on to be the co-founder of Mosaic Communications Corporation, which evolved into Netscape Communications Corporation, the company that created Netscape Navigator.
Netscape was essentially a new and improved version of Mosaic, but since the University of Illinois owned the rights to Mosaic, Andreessen’s new company couldn’t actually use any of the original code.
Netscape became a nearly instant success, and as a result, Mosaic’s market share began to fall. By the late 90s, Netscape had captured 89% of the web browser market.
| Web browser | % Share (April 1996) |
|---|---|
| Netscape | 88.9% |
| Mosaic | 7.2% |
| Internet Explorer | 3.9% |
Netscape dominated the market for a few more years. However, in the new millennium, a new tech giant started to take over—Internet Explorer.
The 2000s: Internet Explorer Enters the Chat, Followed by Firefox
In 1995, Microsoft launched Internet Explorer as part of an add-on package for its operating system, Microsoft Windows 95.
Given the popularity of the Windows franchise at the time, Internet Explorer was quickly adopted. By the early 2000s, it had captured over 90% of the market, reflecting Microsoft’s hold on the personal computing market.
| Web browser | % Share (January 2000) |
|---|---|
| Internet Explorer | 76.6% |
| Netscape | 18.4% |
| Opera | 0.7% |
| Other | 4.3% |
Netscape was mostly phased out of the market by then, which meant Internet Explorer didn’t have much competition until Mozilla entered the arena.
Founded by members of Netscape, Mozilla began in 1998 as a project for fostering innovation in the web browser market. They shared Netscape’s source code with the public, and over time built a community of programmers around the world that helped make the product even better.
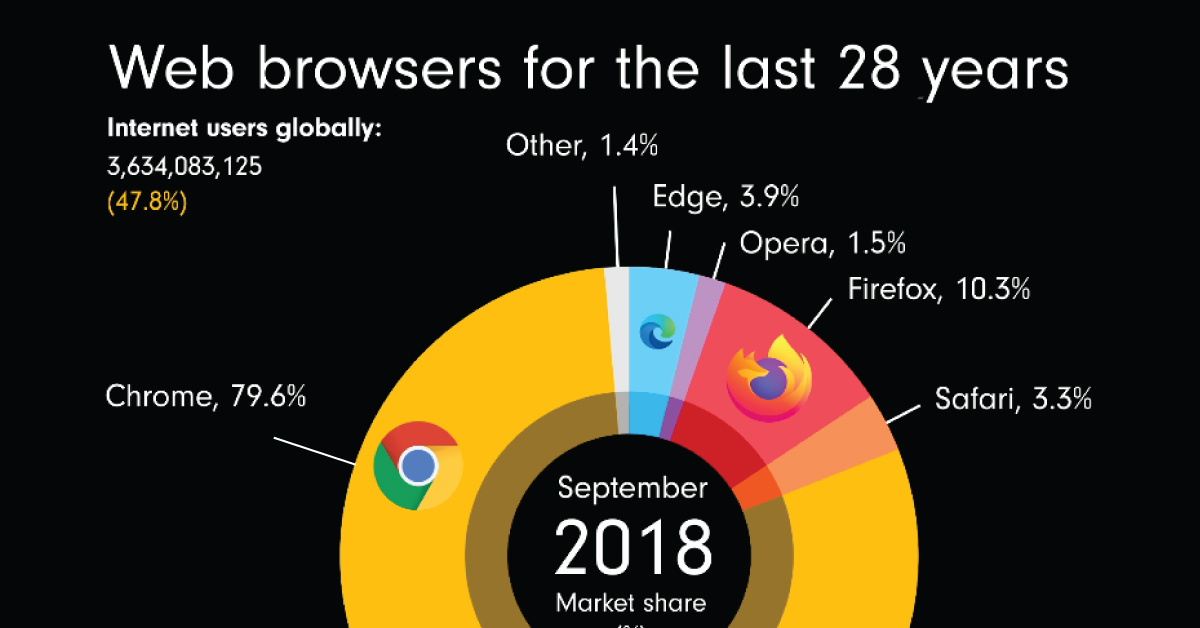
By 2004, Mozilla launched Firefox, and by 2006, the free, open-source browser had captured nearly 30% of the market. Firefox and Internet Explorer battled it out for a few more years, but by the mid-2010s, both browsers started to get leapfrogged by Google Chrome.
Present Day: Google Chrome is King of the Web Browsers
When Google’s co-founders Larry Page and Sergey Brin pitched the idea of starting a Google web browser to CEO Larry Schmidt in 2003, he was worried that they couldn’t keep up with the fierce competition. Eventually, the co-founders convinced Schmidt, and in 2008, Google Chrome was released to the public.
One of Chrome’s distinguishing features was (and still is) the fact that each tab operated separately. This meant that if one tab froze, it wouldn’t stall or crash the others, at the cost of higher memory and CPU usage.
By 2013, Chrome had swallowed up half the market. And with Android emerging as the most popular mobile OS on the global market, there were even more Chrome installations (and of course, searches on Google) as a result.
Notes on Data and Methodology
It’s important to note that the dataset in this animation uses visitor log files from web development site and resource W3Schools from 1999 onwards. Despite getting more than 60 million monthly visits, its userbase is likely slanted towards PC over mobile users.
Further, though Google’s Android platform has a sizable lead over Apple’s iOS in the global mobile sector, this likely slant also impacts the representation of iOS and therefore Safari browsers in the animation and dataset.

This article was published as a part of Visual Capitalist's Creator Program, which features data-driven visuals from some of our favorite Creators around the world.


Technology
Visualizing AI Patents by Country
See which countries have been granted the most AI patents each year, from 2012 to 2022.


Visualizing AI Patents by Country
This was originally posted on our Voronoi app. Download the app for free on iOS or Android and discover incredible data-driven charts from a variety of trusted sources.
This infographic shows the number of AI-related patents granted each year from 2010 to 2022 (latest data available). These figures come from the Center for Security and Emerging Technology (CSET), accessed via Stanford University’s 2024 AI Index Report.
From this data, we can see that China first overtook the U.S. in 2013. Since then, the country has seen enormous growth in the number of AI patents granted each year.
| Year | China | EU and UK | U.S. | RoW | Global Total |
|---|---|---|---|---|---|
| 2010 | 307 | 137 | 984 | 571 | 1,999 |
| 2011 | 516 | 129 | 980 | 581 | 2,206 |
| 2012 | 926 | 112 | 950 | 660 | 2,648 |
| 2013 | 1,035 | 91 | 970 | 627 | 2,723 |
| 2014 | 1,278 | 97 | 1,078 | 667 | 3,120 |
| 2015 | 1,721 | 110 | 1,135 | 539 | 3,505 |
| 2016 | 1,621 | 128 | 1,298 | 714 | 3,761 |
| 2017 | 2,428 | 144 | 1,489 | 1,075 | 5,136 |
| 2018 | 4,741 | 155 | 1,674 | 1,574 | 8,144 |
| 2019 | 9,530 | 322 | 3,211 | 2,720 | 15,783 |
| 2020 | 13,071 | 406 | 5,441 | 4,455 | 23,373 |
| 2021 | 21,907 | 623 | 8,219 | 7,519 | 38,268 |
| 2022 | 35,315 | 1,173 | 12,077 | 13,699 | 62,264 |
In 2022, China was granted more patents than every other country combined.
While this suggests that the country is very active in researching the field of artificial intelligence, it doesn’t necessarily mean that China is the farthest in terms of capability.
Key Facts About AI Patents
According to CSET, AI patents relate to mathematical relationships and algorithms, which are considered abstract ideas under patent law. They can also have different meaning, depending on where they are filed.
In the U.S., AI patenting is concentrated amongst large companies including IBM, Microsoft, and Google. On the other hand, AI patenting in China is more distributed across government organizations, universities, and tech firms (e.g. Tencent).
In terms of focus area, China’s patents are typically related to computer vision, a field of AI that enables computers and systems to interpret visual data and inputs. Meanwhile America’s efforts are more evenly distributed across research fields.
Learn More About AI From Visual Capitalist
If you want to see more data visualizations on artificial intelligence, check out this graphic that shows which job departments will be impacted by AI the most.

-

 Mining1 week ago
Gold vs. S&P 500: Which Has Grown More Over Five Years?
-

 Markets2 weeks ago
Ranked: The Most Valuable Housing Markets in America
-

 Money2 weeks ago
Which States Have the Highest Minimum Wage in America?
-

 AI2 weeks ago
Ranked: Semiconductor Companies by Industry Revenue Share
-

 Markets2 weeks ago
Ranked: The World’s Top Flight Routes, by Revenue
-

 Countries2 weeks ago
Population Projections: The World’s 6 Largest Countries in 2075
-

 Markets2 weeks ago
The Top 10 States by Real GDP Growth in 2023
-

 Demographics2 weeks ago
The Smallest Gender Wage Gaps in OECD Countries