Energy
The Periodic Table of Endangered Elements
Article/Editing:
Click to view a larger version of the graphic.
The Periodic Table of Endangered Elements
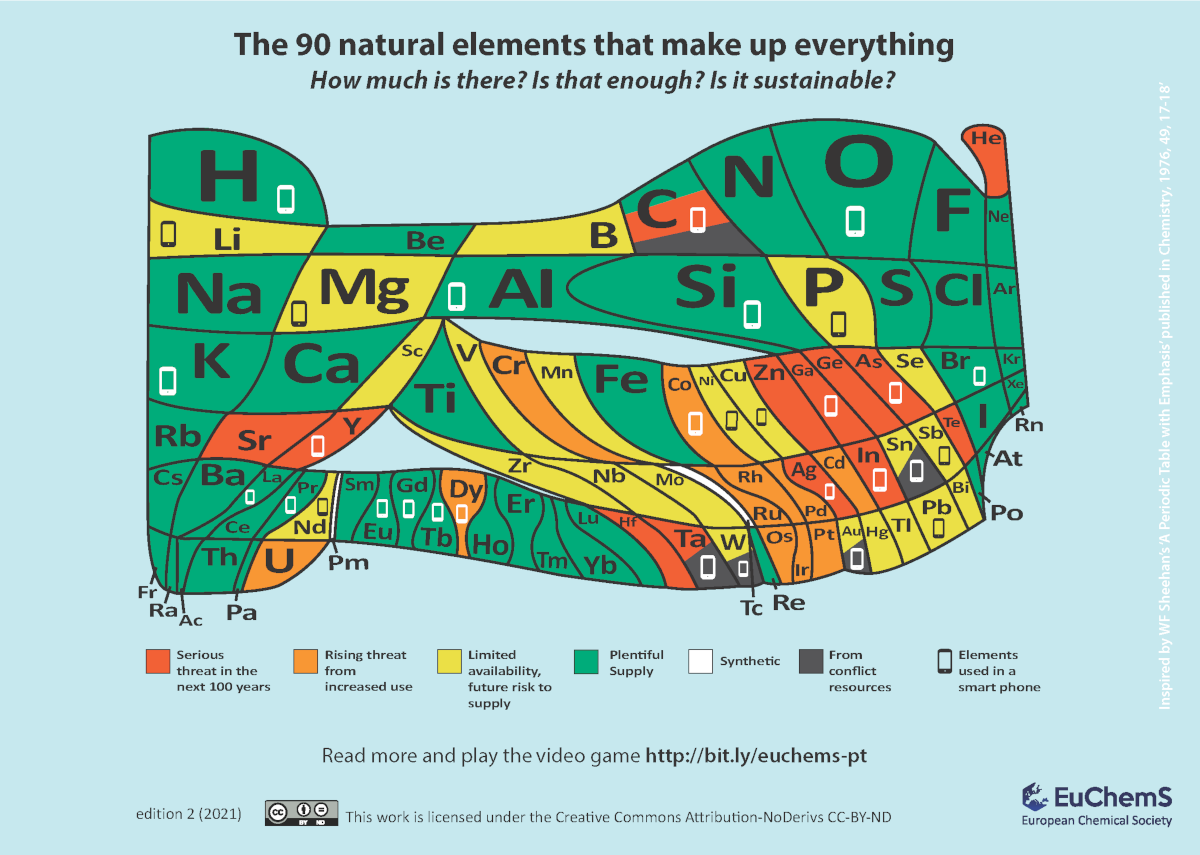
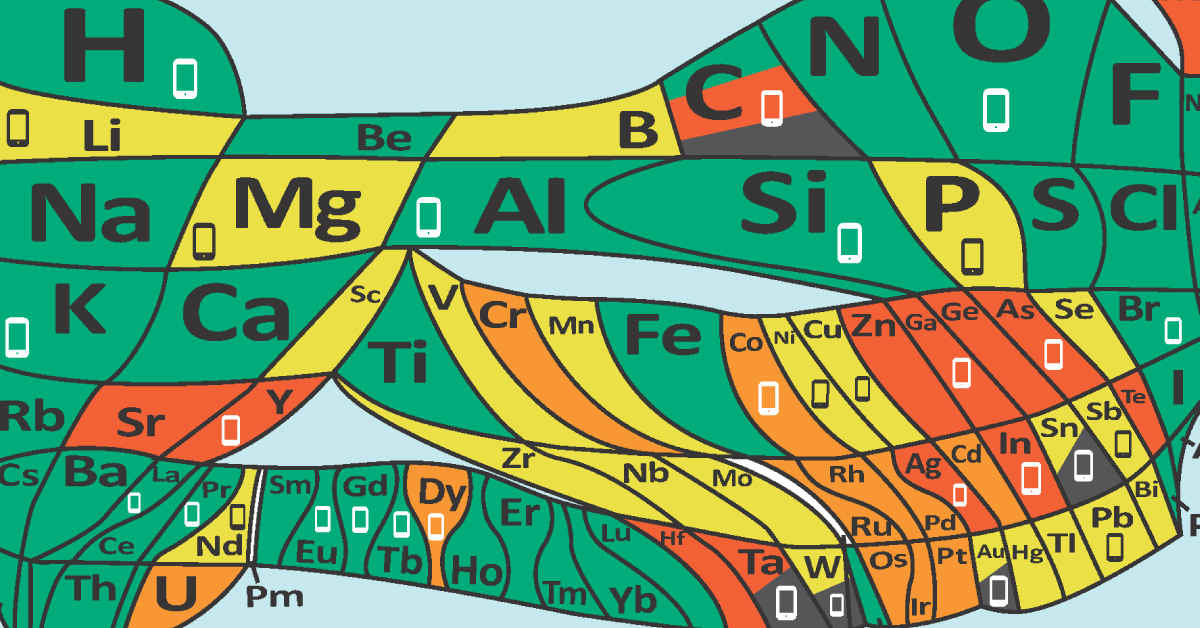
The building blocks for everything on Earth are made from 90 different naturally occurring elements.
This visualization made by the European Chemical Society (EuChemS), shows a periodic table of these 90 different elements, highlighting which ones are in abundance and which ones are in serious threat as of 2021.
On the graphic, the area of each element relates to its number of atoms on a logarithmic scale. The color-coding shows whether there’s enough of each element, or whether the element is becoming scarce, based on current consumption levels.
| Element | Full Name | Status |
|---|---|---|
| Ac | Actinium | Plentiful supply |
| Ag | Silver | Serious threat |
| AI | Aluminum | Plentiful supply |
| Ar | Argon | Plentiful supply |
| As | Arsenic | Serious threat |
| At | Astatine | Plentiful supply |
| Au | Gold | Limited availability |
| B | Boron | Limited availability |
| Ba | Barium | Plentiful supply |
| Be | Beryllium | Plentiful supply |
| Bi | Bismuth | Limited availability |
| Br | Bromine | Plentiful supply |
| C | Carbon | Plentiful supply / serious threat |
| Ca | Calcium | Plentiful supply |
| Cd | Cadmium | Rising threat |
| Ce | Cerium | Plentiful supply |
| CI | Chlorine | Plentiful supply |
| Co | Cobalt | Rising threat |
| Cr | Chromium | Rising threat |
| Cs | Cesium | Plentiful supply |
| Cu | Copper | Rising threat |
| Dy | Dysprosium | Rising threat |
| Er | Erbium | Plentiful supply |
| Eu | Europium | Plentiful supply |
| F | Flourine | Plentiful supply |
| Fe | Iron | Plentiful supply |
| Fr | Francium | Plentiful supply |
| Ga | Gallium | Serious threat |
| Gd | Gadolinium | Plentiful supply |
| Ge | Germanium | Serious threat |
| H | Hydrogen | Plentiful supply |
| He | Helium | Serious threat |
| Hf | Hafnium | Serious threat |
| Hg | Mercury | Limited availability |
| Ho | Holmium | Plentiful supply |
| I | Iodine | Plentiful supply |
| In | Indium | Serious threat |
| Ir | Iridium | Rising threat |
| K | Potassium | Plentiful supply |
| Kr | Krypton | Plentiful supply |
| La | Lanthanum | Plentiful supply |
| Li | Lithium | Limited availability |
| Lu | Lutetium | Plentiful supply |
| Mg | Magnesium | Limited availability |
| Mn | Manganese | Limited availability |
| Mo | Molybdenum | Limited availability |
| N | Nitrogen | Plentiful supply |
| Na | Sodium | Plentiful supply |
| Nb | Niobium | Limited availability |
| Nd | Neodymium | Limited availability |
| Ne | Neon | Plentify supply |
| Ni | Nickel | Limited availability |
| O | Oxygen | Plentiful supply |
| Os | Osmium | Rising threat |
| P | Phosphorus | Limited availability |
| Pa | Protactinium | Plentiful supply |
| Pb | Lead | Limited availability |
| Pd | Palladium | Rising threat |
| Po | Polonium | Plentiful supply |
| Pr | Praseodymium | Plentiful supply |
| Pt | Platinum | Rising threat |
| Ra | Radium | Plentiful supply |
| Rb | Rubidium | Plentiful supply |
| Re | Rhenium | Plentiful supply |
| Rh | Rhodium | Rising threat |
| Rn | Radon | Plentify supply |
| Ru | Ruthenium | Rising threat |
| Sb | Antimony | Limited availability |
| Sc | Scandium | Limited availability |
| Se | Selenium | Limited availability |
| Si | Silicon | Plentiful supply |
| S | Sulfur | Plentiful supply |
| Sm | Samarium | Plentiful supply |
| Sn | Tin | Limited availability |
| Sr | Strontium | Serious threat |
| Ta | Tantalum | Serious threat |
| Tb | Terbium | Plentiful supply |
| Te | Tellurium | Serious threat |
| Ti | Titanium | Plentiful supply |
| TI | Thalium | Limited availability |
| Tm | Thulium | Plentiful supply |
| V | Vanadium | Limited availability |
| W | Tungsten | Limited availability |
| Xe | Xenon | Plentiful supply |
| Y | Yttrium | Serious threat |
| Yb | Ytterbium | Plentiful supply |
| Zn | Zinc | Serious threat |
| Zr | Zirconium | Limited availability |
| Th | Thorium | Plentiful supply |
| U | Uranium | Rising threat |
While these elements don’t technically run out and instead transform (except for helium, which rises and escapes from Earth’s atmosphere), some are being used up exceptionally fast, to the point where they may soon become extremely scarce.
One element worth pointing out on the graphic is carbon, which is three different colors: green, red, and dark gray.
- Green, because carbon is in abundance (to a fault) in the form of carbon dioxide
- Red, because it will soon cause a number of cataphoric problems if consumption habits don’t change
- Gray because carbon-based fuels often come from conflict countries
For more elements-related content, check out our channel dedicated to raw materials and the megatrends that drive them, VC Elements.

This article was published as a part of Visual Capitalist's Creator Program, which features data-driven visuals from some of our favorite Creators around the world.


Energy
The World’s Biggest Nuclear Energy Producers
China has grown its nuclear capacity over the last decade, now ranking second on the list of top nuclear energy producers.


The World’s Biggest Nuclear Energy Producers
This was originally posted on our Voronoi app. Download the app for free on Apple or Android and discover incredible data-driven charts from a variety of trusted sources.
Scientists in South Korea recently broke a record in a nuclear fusion experiment. For 48 seconds, they sustained a temperature seven times that of the sun’s core.
But generating commercially viable energy from nuclear fusion still remains more science fiction than reality. Meanwhile, its more reliable sibling, nuclear fission, has been powering our world for many decades.
In this graphic, we visualized the top producers of nuclear energy by their share of the global total, measured in terawatt hours (TWh). Data for this was sourced from the Nuclear Energy Institute, last updated in August 2022.
Which Country Generates the Most Nuclear Energy?
Nuclear energy production in the U.S. is more than twice the amount produced by China (ranked second) and France (ranked third) put together. In total, the U.S. accounts for nearly 30% of global nuclear energy output.
However, nuclear power only accounts for one-fifth of America’s electricity supply. This is in contrast to France, which generates 60% of its electricity from nuclear plants.
| Rank | Country | Nuclear Energy Produced (TWh) | % of Total |
|---|---|---|---|
| 1 | 🇺🇸 U.S. | 772 | 29% |
| 2 | 🇨🇳 China | 383 | 14% |
| 3 | 🇫🇷 France | 363 | 14% |
| 4 | 🇷🇺 Russia | 208 | 8% |
| 5 | 🇰🇷 South Korea | 150 | 6% |
| 6 | 🇨🇦 Canada | 87 | 3% |
| 7 | 🇺🇦 Ukraine | 81 | 3% |
| 8 | 🇩🇪 Germany | 65 | 2% |
| 9 | 🇯🇵 Japan | 61 | 2% |
| 10 | 🇪🇸 Spain | 54 | 2% |
| 11 | 🇸🇪 Sweden | 51 | 2% |
| 12 | 🇧🇪 Belgium | 48 | 2% |
| 13 | 🇬🇧 UK | 42 | 2% |
| 14 | 🇮🇳 India | 40 | 2% |
| 15 | 🇨🇿 Czech Republic | 29 | 1% |
| N/A | 🌐 Other | 219 | 8% |
| N/A | 🌍 Total | 2,653 | 100% |
Another highlight is how China has rapidly grown its nuclear energy capabilities in the last decade. Between 2016 and 2021, for example, it increased its share of global nuclear energy output from less than 10% to more than 14%, overtaking France for second place.
On the opposite end, the UK’s share has slipped to 2% over the same time period.
Meanwhile, Ukraine has heavily relied on nuclear energy to power its grid. In March 2022, it lost access to its key Zaporizhzhia Nuclear Power Station after Russian forces wrested control of the facility. With six 1,000 MW reactors, the plant is one of the largest in Europe. It is currently not producing any power, and has been the site of recent drone attacks.

-

 Real Estate2 weeks ago
Visualizing America’s Shortage of Affordable Homes
-

 Technology1 week ago
Ranked: Semiconductor Companies by Industry Revenue Share
-

 Money1 week ago
Which States Have the Highest Minimum Wage in America?
-

 Real Estate1 week ago
Ranked: The Most Valuable Housing Markets in America
-

 Business2 weeks ago
Charted: Big Four Market Share by S&P 500 Audits
-

 AI2 weeks ago
The Stock Performance of U.S. Chipmakers So Far in 2024
-

 Misc2 weeks ago
Almost Every EV Stock is Down After Q1 2024
-

 Money2 weeks ago
Where Does One U.S. Tax Dollar Go?