Technology
The Cost of Mining Bitcoin in 198 Different Countries
Article/Editing:
View a higher resolution version of this map.
Cost of Mining Bitcoin in 198 Different Countries
View a higher resolution version of this map.
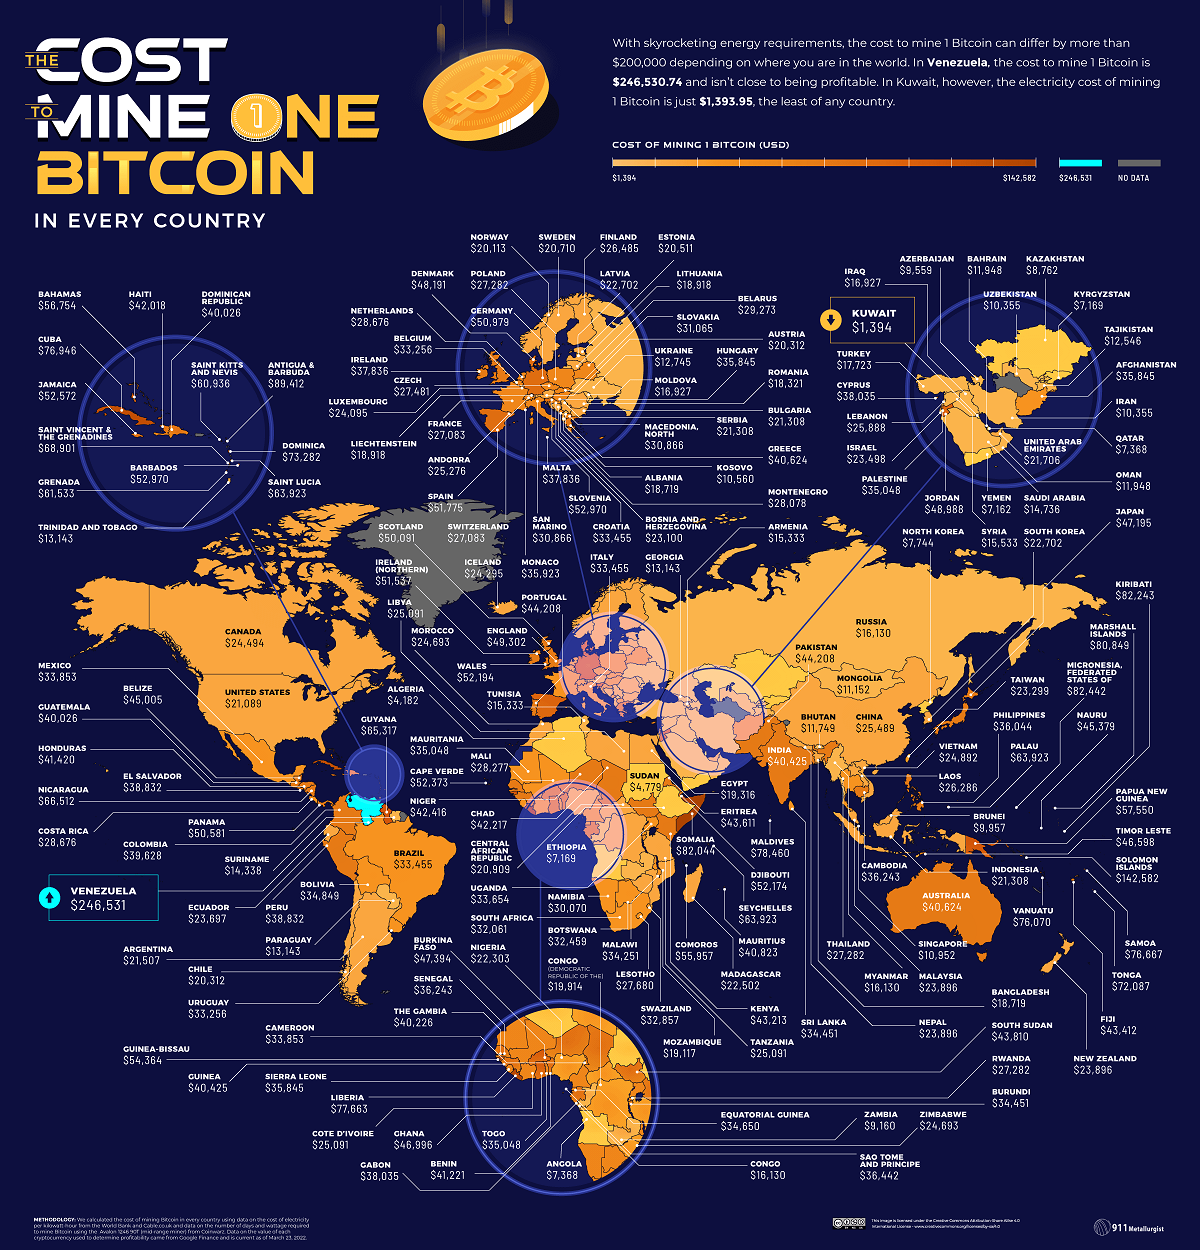
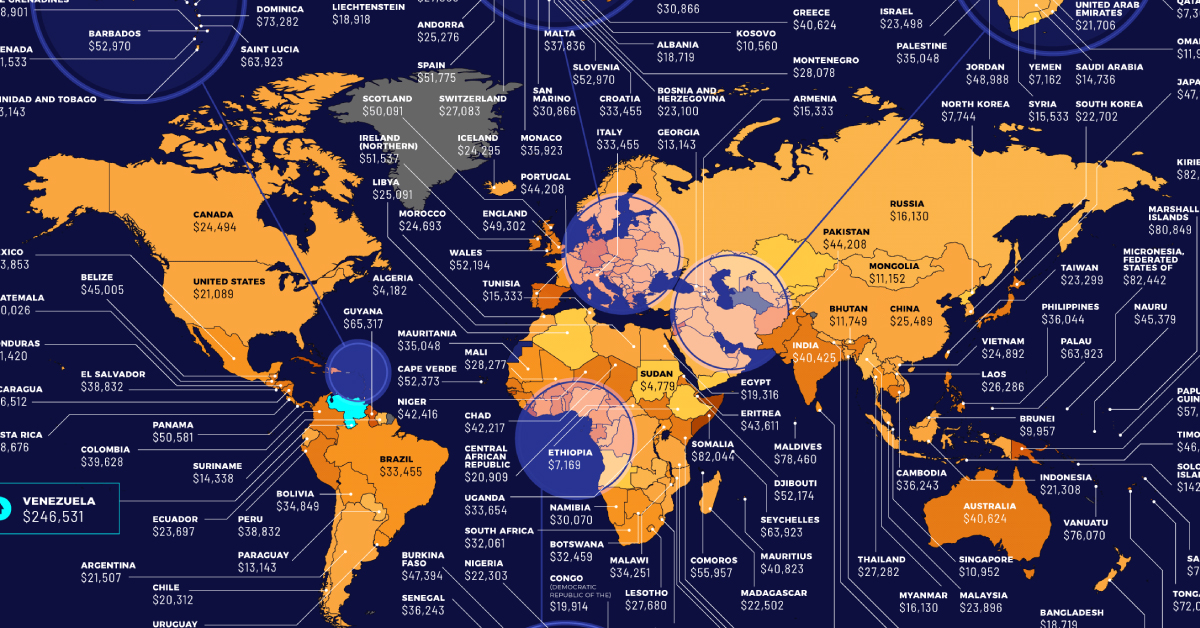
It takes an estimated 1,449 kilowatt hours (kWh) of energy to mine a single bitcoin. That’s the same amount of energy an average U.S. household consumes in approximately 13 years.
Given the high amount of energy needed to mine bitcoin, it can be a costly venture to get into. But exact prices fluctuate, depending on the location and the cost of electricity in the area.
Where are the cheapest and most expensive places to mine this popular cryptocurrency? This graphic by 911 Metallurgist provides a snapshot of the estimated cost of mining bitcoin around the world, using pricing and relative costs from March 23, 2022.
How Does Bitcoin Mining Work?
Before diving in, it’s worth briefly explaining the basics of bitcoin mining, and why it requires so much energy.
When someone mines for bitcoin, what they’re really doing is adding and verifying a new transaction record to the blockchain—the decentralized bank ledger where bitcoin is traded and distributed.
To create this new record, crypto miners need to crack a complex equation that’s been generated by the blockchain system.
Potentially tens of thousands of miners are racing to crack the same code at any given time. Only the first person to solve the equation gets rewarded (unless you’re part of a mining pool, which is essentially a group of miners who agree to combine efforts to increase their chances of solving the equation).
The faster your computing power is, the better your chances are of winning, so solving the equation first requires powerful equipment that takes up a lot of energy.
The Costs and Profits of Mining Bitcoin in 198 Countries
Across the 198 countries included in the dataset, the average cost to mine bitcoin sat at $35,404.03, more than bitcoin’s value of $20,863.69 on July 15, 2022. Though it’s important to note that fluctuating energy prices, and more or less miners on the bitcoin network, constantly change the necessary energy and final cost.
Here’s a breakdown of what the cost to mine one bitcoin in each country was in March 23, 2022, along with the potential profit after accounting for mining costs:
| # | Country | Cost to mine 1 bitcoin | Profit (July 15, 2022) |
|---|---|---|---|
| 1 | 🇰🇼 Kuwait | $1,393.95 | $18,362.58 |
| 2 | 🇩🇿 Algeria | $4,181.86 | $15,574.67 |
| 3 | 🇸🇩 Sudan | $4,779.27 | $14,977.26 |
| 4 | 🇾🇪 Yemen | $7,161.77 | $12,594.76 |
| 5 | 🇪🇹 Ethiopia | $7,168.91 | $12,587.62 |
| 6 | 🇰🇬 Kyrgyzstan | $7,168.91 | $12,587.62 |
| 7 | 🇦🇴 Angola | $7,368.04 | $12,388.49 |
| 8 | 🇶🇦 Qatar | $7,368.04 | $12,388.49 |
| 9 | 🇰🇵 North Korea | $7,744.32 | $12,012.21 |
| 10 | 🇰🇿 Kazakhstan | $8,762.00 | $10,994.53 |
| 11 | 🇿🇲 Zambia | $9,160.27 | $10,596.26 |
| 12 | 🇦🇿 Azerbaijan | $9,558.54 | $10,197.99 |
| 13 | 🇧🇳 Brunei | $9,956.81 | $9,799.72 |
| 14 | 🇮🇷 Iran | $10,355.09 | $9,401.44 |
| 15 | 🇺🇿 Uzbekistan | $10,355.09 | $9,401.44 |
| 16 | 🇽🇰 Kosovo | $10,560.17 | $9,196.36 |
| 17 | 🇸🇬 Singapore | $10,952.50 | $8,804.03 |
| 18 | 🇲🇳 Mongolia | $11,151.63 | $8,604.90 |
| 19 | 🇧🇹 Bhutan | $11,749.04 | $8,007.49 |
| 20 | 🇧🇭 Bahrain | $11,948.18 | $7,808.35 |
| 21 | 🇴🇲 Oman | $11,948.18 | $7,808.35 |
| 22 | 🇹🇯 Tajikistan | $12,545.59 | $7,210.94 |
| 23 | 🇺🇦 Ukraine | $12,744.72 | $7,011.81 |
| 24 | 🇬🇪 Georgia | $13,143.00 | $6,613.53 |
| 25 | 🇦🇬 Paraguay | $13,143.00 | $6,613.53 |
| 26 | 🇹🇹 Trinidad and Tobago | $13,143.00 | $6,613.53 |
| 27 | 🇸🇷 Suriname | $14,337.81 | $5,418.72 |
| 28 | 🇸🇦 Saudi Arabia | $14,736.09 | $5,020.44 |
| 29 | 🇦🇲 Armenia | $15,333.50 | $4,423.03 |
| 30 | 🇹🇳 Tunisia | $15,333.50 | $4,423.03 |
| 31 | 🇸🇾 Syria | $15,532.63 | $4,223.90 |
| 32 | 🇨🇬 Congo (Republic Of The) | $16,130.04 | $3,626.49 |
| 33 | 🇲🇲 Myanmar | $16,130.04 | $3,626.49 |
| 34 | 🇷🇺 Russia | $16,130.04 | $3,626.49 |
| 35 | 🇮🇶 Iraq | $16,926.59 | $2,829.94 |
| 36 | 🇲🇩 Moldova | $16,926.59 | $2,829.94 |
| 37 | 🇹🇷 Turkey | $17,723.13 | $2,033.40 |
| 38 | 🇷🇴 Romania | $18,320.54 | $1,435.99 |
| 39 | 🇦🇱 Albania | $18,718.81 | $1,037.72 |
| 40 | 🇧🇩 Bangladesh | $18,718.81 | $1,037.72 |
| 41 | 🇱🇮 Liechtenstein | $18,917.95 | $838.58 |
| 42 | 🇱🇹 Lithuania | $18,917.95 | $838.58 |
| 43 | 🇲🇿 Mozambique | $19,117.08 | $639.45 |
| 44 | 🇪🇬 Egypt | $19,316.22 | $440.31 |
| 45 | 🇨🇩 Congo (Democratic Republic Of The) | $19,913.63 | -$157.10 |
| 46 | 🇳🇴 Norway | $20,112.77 | -$356.24 |
| 47 | 🇦🇹 Austria | $20,311.90 | -$555.37 |
| 48 | 🇨🇱 Chile | $20,311.90 | -$555.37 |
| 49 | 🇪🇪 Estonia | $20,511.04 | -$754.51 |
| 50 | 🇸🇪 Sweden | $20,710.18 | -$953.65 |
| 51 | 🇨🇫 Central African Republic | $20,909.31 | -$1,152.78 |
| 52 | 🇺🇸 United States | $21,088.53 | -$1,332.00 |
| 53 | 🇧🇬 Bulgaria | $21,307.58 | -$1,551.05 |
| 54 | 🇮🇩 Indonesia | $21,307.58 | -$1,551.05 |
| 55 | 🇷🇸 Serbia | $21,307.58 | -$1,551.05 |
| 56 | 🇦🇷 Argentina | $21,506.72 | -$1,750.19 |
| 57 | 🇦🇪 United Arab Emirates | $21,705.86 | -$1,949.33 |
| 58 | 🇳🇬 Nigeria | $22,303.27 | -$2,546.74 |
| 59 | 🇲🇬 Madagascar | $22,502.40 | -$2,745.87 |
| 60 | 🇱🇻 Latvia | $22,701.54 | -$2,945.01 |
| 61 | 🇰🇷 South Korea | $22,701.54 | -$2,945.01 |
| 62 | 🇧🇦 Bosnia and Herzegovina | $23,099.81 | -$3,343.28 |
| 63 | 🇹🇼 Taiwan | $23,298.95 | -$3,542.42 |
| 64 | 🇮🇱 Israel | $23,498.08 | -$3,741.55 |
| 65 | 🇪🇨 Ecuador | $23,697.22 | -$3,940.69 |
| 66 | 🇲🇾 Malaysia | $23,896.36 | -$4,139.83 |
| 67 | 🇳🇵 Nepal | $23,896.36 | -$4,139.83 |
| 68 | 🇳🇿 New Zealand | $23,896.36 | -$4,139.83 |
| 69 | 🇱🇺 Luxembourg | $24,095.49 | -$4,338.96 |
| 70 | 🇮🇸 Iceland | $24,294.63 | -$4,538.10 |
| 71 | 🇨🇦 Canada | $24,493.76 | -$4,737.23 |
| 72 | 🇲🇦 Morocco | $24,692.90 | -$4,936.37 |
| 73 | 🇿🇼 Zimbabwe | $24,692.90 | -$4,936.37 |
| 74 | 🇻🇳 Vietnam | $24,892.04 | -$5,135.51 |
| 75 | 🇨🇮 Côte D’Ivoire (Ivory Coast) | $25,091.17 | -$5,334.64 |
| 76 | 🇱🇾 Libya | $25,091.17 | -$5,334.64 |
| 77 | 🇹🇿 Tanzania | $25,091.17 | -$5,334.64 |
| 78 | 🇦🇩 Andorra | $25,276.27 | -$5,519.74 |
| 79 | 🇨🇳 China | $25,489.45 | -$5,732.92 |
| 80 | 🇱🇧 Lebanon | $25,887.72 | -$6,131.19 |
| 81 | 🇱🇦 Laos | $26,285.99 | -$6,529.46 |
| 82 | 🇫🇮 Finland | $26,485.13 | -$6,728.60 |
| 83 | 🇫🇷 France | $27,082.54 | -$7,326.01 |
| 84 | 🇨🇭 Switzerland | $27,082.54 | -$7,326.01 |
| 85 | 🇵🇱 Poland | $27,281.67 | -$7,525.14 |
| 86 | 🇷🇼 Rwanda | $27,281.67 | -$7,525.14 |
| 87 | 🇹🇭 Thailand | $27,281.67 | -$7,525.14 |
| 88 | 🇨🇿 Czech Republic | $27,480.81 | -$7,724.28 |
| 89 | 🇱🇸 Lesotho | $27,679.95 | -$7,923.42 |
| 90 | 🇲🇪 Montenegro | $28,078.22 | -$8,321.69 |
| 91 | 🇲🇱 Mali | $28,277.35 | -$8,520.82 |
| 92 | 🇨🇷 Costa Rica | $28,675.63 | -$8,919.10 |
| 93 | 🇳🇱 Netherlands | $28,675.63 | -$8,919.10 |
| 94 | 🇧🇾 Belarus | $29,273.04 | -$9,516.51 |
| 95 | 🇳🇦 Namibia | $30,069.58 | -$10,313.05 |
| 96 | 🇲🇰 Macedonia, North | $30,866.13 | -$11,109.60 |
| 97 | 🇸🇲 San Marino | $30,866.13 | -$11,109.60 |
| 98 | 🇸🇰 Slovakia | $31,065.26 | -$11,308.73 |
| 99 | 🇿🇦 South Africa | $32,060.94 | -$12,304.41 |
| 100 | 🇧🇼 Botswana | $32,459.22 | -$12,702.69 |
| 101 | 🇸🇿 Swaziland | $32,857.49 | -$13,100.96 |
| 102 | 🇧🇪 Belgium | $33,255.76 | -$13,499.23 |
| 103 | 🇺🇾 Uruguay | $33,255.76 | -$13,499.23 |
| 104 | 🇧🇷 Brazil | $33,454.90 | -$13,698.37 |
| 105 | 🇭🇷 Croatia | $33,454.90 | -$13,698.37 |
| 106 | 🇮🇹 Italy | $33,454.90 | -$13,698.37 |
| 107 | 🇺🇬 Uganda | $33,654.03 | -$13,897.50 |
| 108 | 🇨🇲 Cameroon | $33,853.17 | -$14,096.64 |
| 109 | 🇲🇽 Mexico | $33,853.17 | -$14,096.64 |
| 110 | 🇲🇼 Malawi | $34,251.44 | -$14,494.91 |
| 111 | 🇧🇮 Burundi | $34,450.58 | -$14,694.05 |
| 112 | 🇱🇰 Sri Lanka | $34,450.58 | -$14,694.05 |
| 113 | 🇬🇶 Equatorial Guinea | $34,649.72 | -$14,893.19 |
| 114 | 🇧🇴 Bolivia | $34,848.85 | -$15,092.32 |
| 115 | 🇲🇷 Mauritania | $35,047.99 | -$15,291.46 |
| 116 | 🇵🇸 Palestine | $35,047.99 | -$15,291.46 |
| 117 | 🇹🇬 Togo | $35,047.99 | -$15,291.46 |
| 118 | 🇦🇫 Afghanistan | $35,844.53 | -$16,088.00 |
| 119 | 🇭🇺 Hungary | $35,844.53 | -$16,088.00 |
| 120 | 🇸🇱 Sierra Leone | $35,844.53 | -$16,088.00 |
| 121 | 🇲🇨 Monaco | $35,922.73 | -$16,166.20 |
| 122 | 🇵🇭 Philippines | $36,043.67 | -$16,287.14 |
| 123 | 🇰🇭 Cambodia | $36,242.81 | -$16,486.28 |
| 124 | 🇸🇳 Senegal | $36,242.81 | -$16,486.28 |
| 125 | 🇸🇹 São Tomé and Príncipe | $36,441.94 | -$16,685.41 |
| 126 | 🇮🇪 Ireland (Republic Of) | $37,835.90 | -$18,079.37 |
| 127 | 🇲🇹 Malta | $37,835.90 | -$18,079.37 |
| 128 | 🇨🇾 Cyprus | $38,035.03 | -$18,278.50 |
| 129 | 🇬🇦 Gabon | $38,035.03 | -$18,278.50 |
| 130 | 🇸🇻 El Salvador | $38,831.58 | -$19,075.05 |
| 131 | 🇵🇪 Peru | $38,831.58 | -$19,075.05 |
| 132 | 🇨🇴 Colombia | $39,628.12 | -$19,871.59 |
| 133 | 🇩🇴 Dominican Republic | $40,026.40 | -$20,269.87 |
| 134 | 🇬🇹 Guatemala | $40,026.40 | -$20,269.87 |
| 135 | 🇬🇲 The Gambia | $40,225.53 | -$20,469.00 |
| 136 | 🇬🇳 Guinea | $40,424.67 | -$20,668.14 |
| 137 | 🇮🇳 India | $40,424.67 | -$20,668.14 |
| 138 | 🇦🇺 Australia | $40,623.81 | -$20,867.28 |
| 139 | 🇬🇷 Greece | $40,623.81 | -$20,867.28 |
| 140 | 🇲🇺 Mauritius | $40,822.94 | -$21,066.41 |
| 141 | 🇧🇯 Benin | $41,221.21 | -$21,464.68 |
| 142 | 🇭🇳 Honduras | $41,420.35 | -$21,663.82 |
| 143 | 🇭🇹 Haiti | $42,017.76 | -$22,261.23 |
| 144 | 🇹🇩 Chad | $42,216.90 | -$22,460.37 |
| 145 | 🇳🇪 Niger | $42,416.03 | -$22,659.50 |
| 146 | 🇰🇪 Kenya | $43,212.58 | -$23,456.05 |
| 147 | 🇫🇯 Fiji | $43,411.71 | -$23,655.18 |
| 148 | 🇪🇷 Eritrea | $43,610.85 | -$23,854.32 |
| 149 | 🇸🇸 South Sudan | $43,809.99 | -$24,053.46 |
| 150 | 🇵🇰 Pakistan | $44,208.26 | -$24,451.73 |
| 151 | 🇵🇹 Portugal | $44,208.26 | -$24,451.73 |
| 152 | 🇧🇿 Belize | $45,004.80 | -$25,248.27 |
| 153 | 🇳🇷 Nauru | $45,378.54 | -$25,622.01 |
| 154 | 🇹🇱 Timor-Leste | $46,597.89 | -$26,841.36 |
| 155 | 🇬🇭 Ghana | $46,996.17 | -$27,239.64 |
| 156 | 🇯🇵 Japan | $47,195.30 | -$27,438.77 |
| 157 | 🇧🇫 Burkina Faso | $47,394.44 | -$27,637.91 |
| 158 | 🇩🇰 Denmark | $48,190.98 | -$28,434.45 |
| 159 | 🇯🇴 Jordan | $48,987.53 | -$29,231.00 |
| 160 | 🏴 England | $49,301.82 | -$29,545.29 |
| 161 | 🏴 Scotland | $50,090.64 | -$30,334.11 |
| 162 | 🇵🇦 Panama | $50,580.62 | -$30,824.09 |
| 163 | 🇩🇪 Germany | $50,978.89 | -$31,222.36 |
| 164 | 🇬🇧 Ireland (Northern) | $51,536.83 | -$31,780.30 |
| 165 | 🇪🇸 Spain | $51,775.44 | -$32,018.91 |
| 166 | 🇩🇯 Djibouti | $52,173.71 | -$32,417.18 |
| 167 | 🏴 Wales | $52,194.19 | -$32,437.66 |
| 168 | 🇨🇻 Cape Verde | $52,372.85 | -$32,616.32 |
| 169 | 🇯🇲 Jamaica | $52,571.98 | -$32,815.45 |
| 170 | 🇧🇧 Barbados | $52,970.26 | -$33,213.73 |
| 171 | 🇸🇮 Slovenia | $52,970.26 | -$33,213.73 |
| 172 | 🇹🇻 Tuvalu | $53,887.02 | -$34,130.49 |
| 173 | 🇬🇼 Guinea-Bissau | $54,364.21 | -$34,607.68 |
| 174 | 🇰🇲 Comoros | $55,957.30 | -$36,200.77 |
| 175 | 🇧🇸 Bahamas | $56,753.85 | -$36,997.32 |
| 176 | 🇵🇬 Papua New Guinea | $57,550.39 | -$37,793.86 |
| 177 | 🇰🇳 Saint Kitts and Nevis | $60,935.71 | -$41,179.18 |
| 178 | 🇬🇩 Grenada | $61,533.12 | -$41,776.59 |
| 179 | 🇵🇼 Palau | $63,922.75 | -$44,166.22 |
| 180 | 🇱🇨 Saint Lucia | $63,922.75 | -$44,166.22 |
| 181 | 🇸🇨 Seychelles | $63,922.75 | -$44,166.22 |
| 182 | 🇬🇾 Guyana | $65,316.71 | -$45,560.18 |
| 183 | 🇳🇮 Nicaragua | $66,511.52 | -$46,754.99 |
| 184 | 🇻🇨 Saint Vincent and Grenadines | $68,901.16 | -$49,144.63 |
| 185 | 🇹🇴 Tonga | $72,087.34 | -$52,330.81 |
| 186 | 🇩🇲 Dominica | $73,282.16 | -$53,525.63 |
| 187 | 🇻🇺 Vanuatu | $76,070.07 | -$56,313.54 |
| 188 | 🇼🇸 Samoa | $76,667.48 | -$56,910.95 |
| 189 | 🇨🇺 Cuba | $76,946.27 | -$57,189.74 |
| 190 | 🇱🇷 Liberia | $77,663.16 | -$57,906.63 |
| 191 | 🇲🇻 Maldives | $78,459.70 | -$58,703.17 |
| 192 | 🇲🇭 Marshall Islands | $80,849.34 | -$61,092.81 |
| 193 | 🇸🇴 Somalia | $82,044.16 | -$62,287.63 |
| 194 | 🇰🇮 Kiribati | $82,243.29 | -$62,486.76 |
| 195 | 🇫🇲 Micronesia, Federated States Of | $82,442.43 | -$62,685.90 |
| 196 | 🇦🇬 Antigua and Barbuda | $89,412.20 | -$69,655.67 |
| 197 | 🇸🇧 Solomon Islands | $142,581.59 | -$122,825.06 |
| 198 | 🇻🇪 Venezuela | $246,530.74 | -$226,774.21 |
Venezuela ranks as the number one most expensive country to mine bitcoin. It costs a whooping $246,530.74 to mine a single bitcoin in the South American country, meaning the process is far from profitable. Energy costs are so expensive in the country that miners would be out $225,667.05 for just one bitcoin.
On the opposite end of the spectrum, the cheapest place to mine bitcoin is in Kuwait. It costs $1,393.95 to mine a single bitcoin in Kuwait, meaning miners could gain $19,469.74 in profits.
The Middle Eastern country has some of the cheapest electricity in the world, with one kWh costing an average of just 3 cents. For context, the average cost of one kWh in North America is 21 cents.
The Race is On
Despite the steep costs of bitcoin mining, many people believe it’s worth the upfront investment.
One thing that makes bitcoin particularly appealing is its finite supply—there are only 21 million coins available for mining, and as of this article’s publication, more than 19 million bitcoin have already been mined.
While the price of bitcoin (BTC) is notorious for its volatility, its value has still grown significantly over the last decade. And if cryptocurrencies become mainstream as many people believe they will, this could boost the price of bitcoin even further.

This article was published as a part of Visual Capitalist's Creator Program, which features data-driven visuals from some of our favorite Creators around the world.


Brands
How Tech Logos Have Evolved Over Time
From complete overhauls to more subtle tweaks, these tech logos have had quite a journey. Featuring: Google, Apple, and more.


How Tech Logos Have Evolved Over Time
This was originally posted on our Voronoi app. Download the app for free on iOS or Android and discover incredible data-driven charts from a variety of trusted sources.
One would be hard-pressed to find a company that has never changed its logo. Granted, some brands—like Rolex, IBM, and Coca-Cola—tend to just have more minimalistic updates. But other companies undergo an entire identity change, thus necessitating a full overhaul.
In this graphic, we visualized the evolution of prominent tech companies’ logos over time. All of these brands ranked highly in a Q1 2024 YouGov study of America’s most famous tech brands. The logo changes are sourced from 1000logos.net.
How Many Times Has Google Changed Its Logo?
Google and Facebook share a 98% fame rating according to YouGov. But while Facebook’s rise was captured in The Social Network (2010), Google’s history tends to be a little less lionized in popular culture.
For example, Google was initially called “Backrub” because it analyzed “back links” to understand how important a website was. Since its founding, Google has undergone eight logo changes, finally settling on its current one in 2015.
| Company | Number of Logo Changes |
|---|---|
| 8 | |
| HP | 8 |
| Amazon | 6 |
| Microsoft | 6 |
| Samsung | 6 |
| Apple | 5* |
Note: *Includes color changes. Source: 1000Logos.net
Another fun origin story is Microsoft, which started off as Traf-O-Data, a traffic counter reading company that generated reports for traffic engineers. By 1975, the company was renamed. But it wasn’t until 2012 that Microsoft put the iconic Windows logo—still the most popular desktop operating system—alongside its name.
And then there’s Samsung, which started as a grocery trading store in 1938. Its pivot to electronics started in the 1970s with black and white television sets. For 55 years, the company kept some form of stars from its first logo, until 1993, when the iconic encircled blue Samsung logo debuted.
Finally, Apple’s first logo in 1976 featured Isaac Newton reading under a tree—moments before an apple fell on his head. Two years later, the iconic bitten apple logo would be designed at Steve Jobs’ behest, and it would take another two decades for it to go monochrome.

-

 Green1 week ago
Ranked: The Countries With the Most Air Pollution in 2023
-

 Automotive2 weeks ago
Almost Every EV Stock is Down After Q1 2024
-

 AI2 weeks ago
The Stock Performance of U.S. Chipmakers So Far in 2024
-

 Markets2 weeks ago
Charted: Big Four Market Share by S&P 500 Audits
-

 Real Estate2 weeks ago
Ranked: The Most Valuable Housing Markets in America
-

 Money2 weeks ago
Which States Have the Highest Minimum Wage in America?
-

 AI2 weeks ago
Ranked: Semiconductor Companies by Industry Revenue Share
-

 Travel2 weeks ago
Ranked: The World’s Top Flight Routes, by Revenue