Technology
The Cost of Mining Bitcoin in 198 Different Countries
Article/Editing:
View a higher resolution version of this map.
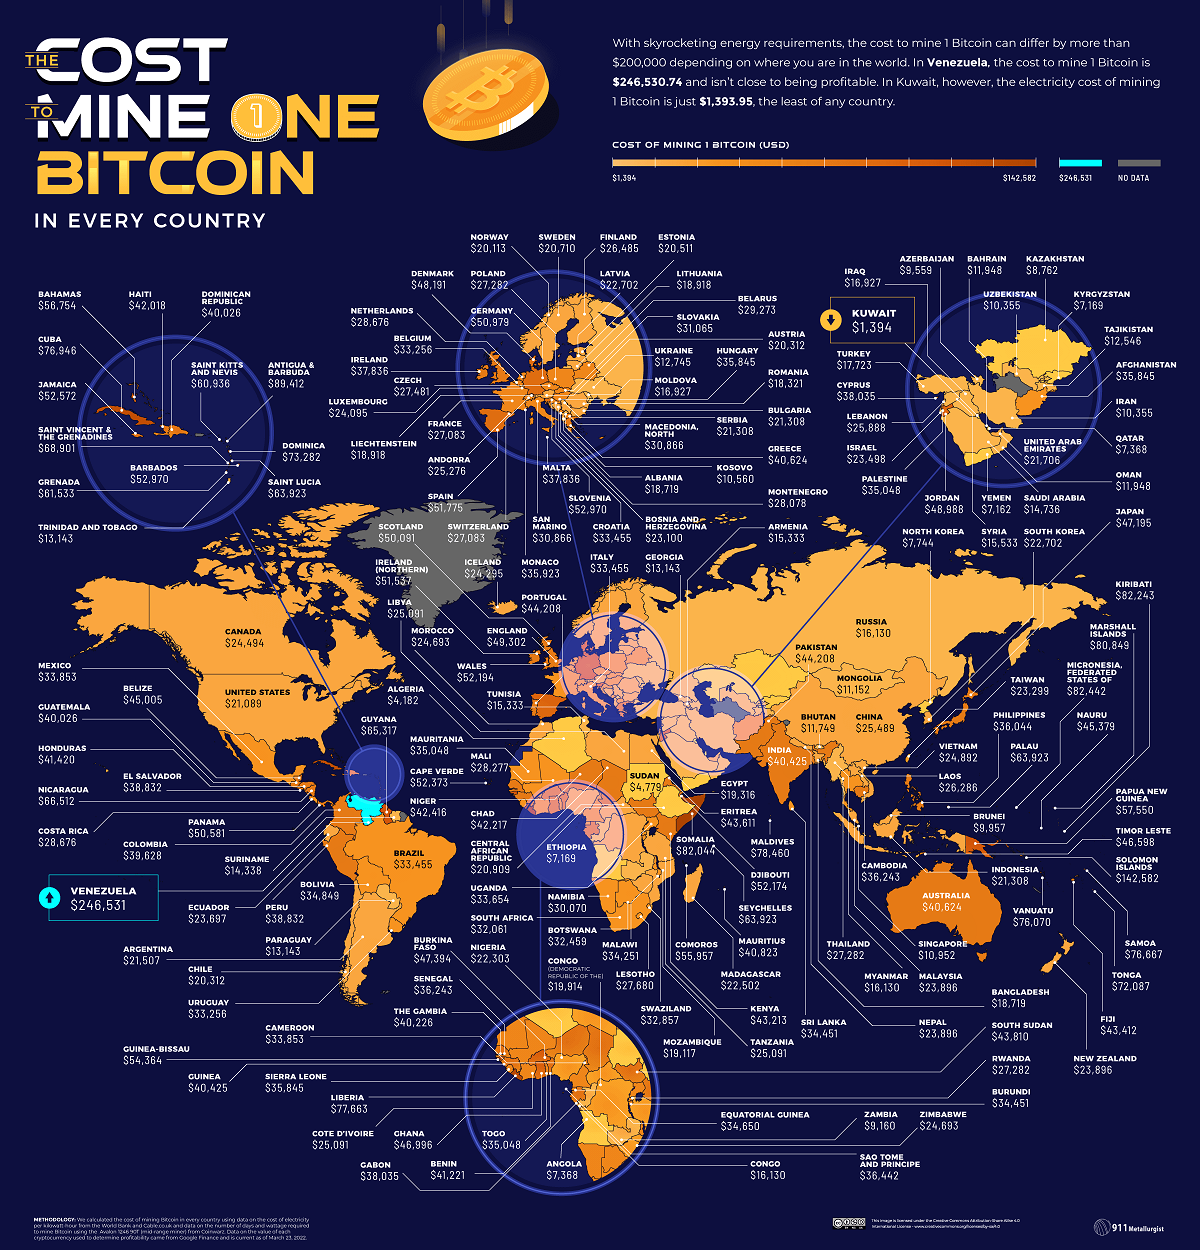
Cost of Mining Bitcoin in 198 Different Countries
View a higher resolution version of this map.
It takes an estimated 1,449 kilowatt hours (kWh) of energy to mine a single bitcoin. That’s the same amount of energy an average U.S. household consumes in approximately 13 years.
Given the high amount of energy needed to mine bitcoin, it can be a costly venture to get into. But exact prices fluctuate, depending on the location and the cost of electricity in the area.
Where are the cheapest and most expensive places to mine this popular cryptocurrency? This graphic by 911 Metallurgist provides a snapshot of the estimated cost of mining bitcoin around the world, using pricing and relative costs from March 23, 2022.
How Does Bitcoin Mining Work?
Before diving in, it’s worth briefly explaining the basics of bitcoin mining, and why it requires so much energy.
When someone mines for bitcoin, what they’re really doing is adding and verifying a new transaction record to the blockchain—the decentralized bank ledger where bitcoin is traded and distributed.
To create this new record, crypto miners need to crack a complex equation that’s been generated by the blockchain system.
Potentially tens of thousands of miners are racing to crack the same code at any given time. Only the first person to solve the equation gets rewarded (unless you’re part of a mining pool, which is essentially a group of miners who agree to combine efforts to increase their chances of solving the equation).
The faster your computing power is, the better your chances are of winning, so solving the equation first requires powerful equipment that takes up a lot of energy.
The Costs and Profits of Mining Bitcoin in 198 Countries
Across the 198 countries included in the dataset, the average cost to mine bitcoin sat at $35,404.03, more than bitcoin’s value of $20,863.69 on July 15, 2022. Though it’s important to note that fluctuating energy prices, and more or less miners on the bitcoin network, constantly change the necessary energy and final cost.
Here’s a breakdown of what the cost to mine one bitcoin in each country was in March 23, 2022, along with the potential profit after accounting for mining costs:
| # | Country | Cost to mine 1 bitcoin | Profit (July 15, 2022) |
|---|---|---|---|
| 1 | 🇰🇼 Kuwait | $1,393.95 | $18,362.58 |
| 2 | 🇩🇿 Algeria | $4,181.86 | $15,574.67 |
| 3 | 🇸🇩 Sudan | $4,779.27 | $14,977.26 |
| 4 | 🇾🇪 Yemen | $7,161.77 | $12,594.76 |
| 5 | 🇪🇹 Ethiopia | $7,168.91 | $12,587.62 |
| 6 | 🇰🇬 Kyrgyzstan | $7,168.91 | $12,587.62 |
| 7 | 🇦🇴 Angola | $7,368.04 | $12,388.49 |
| 8 | 🇶🇦 Qatar | $7,368.04 | $12,388.49 |
| 9 | 🇰🇵 North Korea | $7,744.32 | $12,012.21 |
| 10 | 🇰🇿 Kazakhstan | $8,762.00 | $10,994.53 |
| 11 | 🇿🇲 Zambia | $9,160.27 | $10,596.26 |
| 12 | 🇦🇿 Azerbaijan | $9,558.54 | $10,197.99 |
| 13 | 🇧🇳 Brunei | $9,956.81 | $9,799.72 |
| 14 | 🇮🇷 Iran | $10,355.09 | $9,401.44 |
| 15 | 🇺🇿 Uzbekistan | $10,355.09 | $9,401.44 |
| 16 | 🇽🇰 Kosovo | $10,560.17 | $9,196.36 |
| 17 | 🇸🇬 Singapore | $10,952.50 | $8,804.03 |
| 18 | 🇲🇳 Mongolia | $11,151.63 | $8,604.90 |
| 19 | 🇧🇹 Bhutan | $11,749.04 | $8,007.49 |
| 20 | 🇧🇭 Bahrain | $11,948.18 | $7,808.35 |
| 21 | 🇴🇲 Oman | $11,948.18 | $7,808.35 |
| 22 | 🇹🇯 Tajikistan | $12,545.59 | $7,210.94 |
| 23 | 🇺🇦 Ukraine | $12,744.72 | $7,011.81 |
| 24 | 🇬🇪 Georgia | $13,143.00 | $6,613.53 |
| 25 | 🇦🇬 Paraguay | $13,143.00 | $6,613.53 |
| 26 | 🇹🇹 Trinidad and Tobago | $13,143.00 | $6,613.53 |
| 27 | 🇸🇷 Suriname | $14,337.81 | $5,418.72 |
| 28 | 🇸🇦 Saudi Arabia | $14,736.09 | $5,020.44 |
| 29 | 🇦🇲 Armenia | $15,333.50 | $4,423.03 |
| 30 | 🇹🇳 Tunisia | $15,333.50 | $4,423.03 |
| 31 | 🇸🇾 Syria | $15,532.63 | $4,223.90 |
| 32 | 🇨🇬 Congo (Republic Of The) | $16,130.04 | $3,626.49 |
| 33 | 🇲🇲 Myanmar | $16,130.04 | $3,626.49 |
| 34 | 🇷🇺 Russia | $16,130.04 | $3,626.49 |
| 35 | 🇮🇶 Iraq | $16,926.59 | $2,829.94 |
| 36 | 🇲🇩 Moldova | $16,926.59 | $2,829.94 |
| 37 | 🇹🇷 Turkey | $17,723.13 | $2,033.40 |
| 38 | 🇷🇴 Romania | $18,320.54 | $1,435.99 |
| 39 | 🇦🇱 Albania | $18,718.81 | $1,037.72 |
| 40 | 🇧🇩 Bangladesh | $18,718.81 | $1,037.72 |
| 41 | 🇱🇮 Liechtenstein | $18,917.95 | $838.58 |
| 42 | 🇱🇹 Lithuania | $18,917.95 | $838.58 |
| 43 | 🇲🇿 Mozambique | $19,117.08 | $639.45 |
| 44 | 🇪🇬 Egypt | $19,316.22 | $440.31 |
| 45 | 🇨🇩 Congo (Democratic Republic Of The) | $19,913.63 | -$157.10 |
| 46 | 🇳🇴 Norway | $20,112.77 | -$356.24 |
| 47 | 🇦🇹 Austria | $20,311.90 | -$555.37 |
| 48 | 🇨🇱 Chile | $20,311.90 | -$555.37 |
| 49 | 🇪🇪 Estonia | $20,511.04 | -$754.51 |
| 50 | 🇸🇪 Sweden | $20,710.18 | -$953.65 |
| 51 | 🇨🇫 Central African Republic | $20,909.31 | -$1,152.78 |
| 52 | 🇺🇸 United States | $21,088.53 | -$1,332.00 |
| 53 | 🇧🇬 Bulgaria | $21,307.58 | -$1,551.05 |
| 54 | 🇮🇩 Indonesia | $21,307.58 | -$1,551.05 |
| 55 | 🇷🇸 Serbia | $21,307.58 | -$1,551.05 |
| 56 | 🇦🇷 Argentina | $21,506.72 | -$1,750.19 |
| 57 | 🇦🇪 United Arab Emirates | $21,705.86 | -$1,949.33 |
| 58 | 🇳🇬 Nigeria | $22,303.27 | -$2,546.74 |
| 59 | 🇲🇬 Madagascar | $22,502.40 | -$2,745.87 |
| 60 | 🇱🇻 Latvia | $22,701.54 | -$2,945.01 |
| 61 | 🇰🇷 South Korea | $22,701.54 | -$2,945.01 |
| 62 | 🇧🇦 Bosnia and Herzegovina | $23,099.81 | -$3,343.28 |
| 63 | 🇹🇼 Taiwan | $23,298.95 | -$3,542.42 |
| 64 | 🇮🇱 Israel | $23,498.08 | -$3,741.55 |
| 65 | 🇪🇨 Ecuador | $23,697.22 | -$3,940.69 |
| 66 | 🇲🇾 Malaysia | $23,896.36 | -$4,139.83 |
| 67 | 🇳🇵 Nepal | $23,896.36 | -$4,139.83 |
| 68 | 🇳🇿 New Zealand | $23,896.36 | -$4,139.83 |
| 69 | 🇱🇺 Luxembourg | $24,095.49 | -$4,338.96 |
| 70 | 🇮🇸 Iceland | $24,294.63 | -$4,538.10 |
| 71 | 🇨🇦 Canada | $24,493.76 | -$4,737.23 |
| 72 | 🇲🇦 Morocco | $24,692.90 | -$4,936.37 |
| 73 | 🇿🇼 Zimbabwe | $24,692.90 | -$4,936.37 |
| 74 | 🇻🇳 Vietnam | $24,892.04 | -$5,135.51 |
| 75 | 🇨🇮 Côte D’Ivoire (Ivory Coast) | $25,091.17 | -$5,334.64 |
| 76 | 🇱🇾 Libya | $25,091.17 | -$5,334.64 |
| 77 | 🇹🇿 Tanzania | $25,091.17 | -$5,334.64 |
| 78 | 🇦🇩 Andorra | $25,276.27 | -$5,519.74 |
| 79 | 🇨🇳 China | $25,489.45 | -$5,732.92 |
| 80 | 🇱🇧 Lebanon | $25,887.72 | -$6,131.19 |
| 81 | 🇱🇦 Laos | $26,285.99 | -$6,529.46 |
| 82 | 🇫🇮 Finland | $26,485.13 | -$6,728.60 |
| 83 | 🇫🇷 France | $27,082.54 | -$7,326.01 |
| 84 | 🇨🇭 Switzerland | $27,082.54 | -$7,326.01 |
| 85 | 🇵🇱 Poland | $27,281.67 | -$7,525.14 |
| 86 | 🇷🇼 Rwanda | $27,281.67 | -$7,525.14 |
| 87 | 🇹🇭 Thailand | $27,281.67 | -$7,525.14 |
| 88 | 🇨🇿 Czech Republic | $27,480.81 | -$7,724.28 |
| 89 | 🇱🇸 Lesotho | $27,679.95 | -$7,923.42 |
| 90 | 🇲🇪 Montenegro | $28,078.22 | -$8,321.69 |
| 91 | 🇲🇱 Mali | $28,277.35 | -$8,520.82 |
| 92 | 🇨🇷 Costa Rica | $28,675.63 | -$8,919.10 |
| 93 | 🇳🇱 Netherlands | $28,675.63 | -$8,919.10 |
| 94 | 🇧🇾 Belarus | $29,273.04 | -$9,516.51 |
| 95 | 🇳🇦 Namibia | $30,069.58 | -$10,313.05 |
| 96 | 🇲🇰 Macedonia, North | $30,866.13 | -$11,109.60 |
| 97 | 🇸🇲 San Marino | $30,866.13 | -$11,109.60 |
| 98 | 🇸🇰 Slovakia | $31,065.26 | -$11,308.73 |
| 99 | 🇿🇦 South Africa | $32,060.94 | -$12,304.41 |
| 100 | 🇧🇼 Botswana | $32,459.22 | -$12,702.69 |
| 101 | 🇸🇿 Swaziland | $32,857.49 | -$13,100.96 |
| 102 | 🇧🇪 Belgium | $33,255.76 | -$13,499.23 |
| 103 | 🇺🇾 Uruguay | $33,255.76 | -$13,499.23 |
| 104 | 🇧🇷 Brazil | $33,454.90 | -$13,698.37 |
| 105 | 🇭🇷 Croatia | $33,454.90 | -$13,698.37 |
| 106 | 🇮🇹 Italy | $33,454.90 | -$13,698.37 |
| 107 | 🇺🇬 Uganda | $33,654.03 | -$13,897.50 |
| 108 | 🇨🇲 Cameroon | $33,853.17 | -$14,096.64 |
| 109 | 🇲🇽 Mexico | $33,853.17 | -$14,096.64 |
| 110 | 🇲🇼 Malawi | $34,251.44 | -$14,494.91 |
| 111 | 🇧🇮 Burundi | $34,450.58 | -$14,694.05 |
| 112 | 🇱🇰 Sri Lanka | $34,450.58 | -$14,694.05 |
| 113 | 🇬🇶 Equatorial Guinea | $34,649.72 | -$14,893.19 |
| 114 | 🇧🇴 Bolivia | $34,848.85 | -$15,092.32 |
| 115 | 🇲🇷 Mauritania | $35,047.99 | -$15,291.46 |
| 116 | 🇵🇸 Palestine | $35,047.99 | -$15,291.46 |
| 117 | 🇹🇬 Togo | $35,047.99 | -$15,291.46 |
| 118 | 🇦🇫 Afghanistan | $35,844.53 | -$16,088.00 |
| 119 | 🇭🇺 Hungary | $35,844.53 | -$16,088.00 |
| 120 | 🇸🇱 Sierra Leone | $35,844.53 | -$16,088.00 |
| 121 | 🇲🇨 Monaco | $35,922.73 | -$16,166.20 |
| 122 | 🇵🇭 Philippines | $36,043.67 | -$16,287.14 |
| 123 | 🇰🇭 Cambodia | $36,242.81 | -$16,486.28 |
| 124 | 🇸🇳 Senegal | $36,242.81 | -$16,486.28 |
| 125 | 🇸🇹 São Tomé and Príncipe | $36,441.94 | -$16,685.41 |
| 126 | 🇮🇪 Ireland (Republic Of) | $37,835.90 | -$18,079.37 |
| 127 | 🇲🇹 Malta | $37,835.90 | -$18,079.37 |
| 128 | 🇨🇾 Cyprus | $38,035.03 | -$18,278.50 |
| 129 | 🇬🇦 Gabon | $38,035.03 | -$18,278.50 |
| 130 | 🇸🇻 El Salvador | $38,831.58 | -$19,075.05 |
| 131 | 🇵🇪 Peru | $38,831.58 | -$19,075.05 |
| 132 | 🇨🇴 Colombia | $39,628.12 | -$19,871.59 |
| 133 | 🇩🇴 Dominican Republic | $40,026.40 | -$20,269.87 |
| 134 | 🇬🇹 Guatemala | $40,026.40 | -$20,269.87 |
| 135 | 🇬🇲 The Gambia | $40,225.53 | -$20,469.00 |
| 136 | 🇬🇳 Guinea | $40,424.67 | -$20,668.14 |
| 137 | 🇮🇳 India | $40,424.67 | -$20,668.14 |
| 138 | 🇦🇺 Australia | $40,623.81 | -$20,867.28 |
| 139 | 🇬🇷 Greece | $40,623.81 | -$20,867.28 |
| 140 | 🇲🇺 Mauritius | $40,822.94 | -$21,066.41 |
| 141 | 🇧🇯 Benin | $41,221.21 | -$21,464.68 |
| 142 | 🇭🇳 Honduras | $41,420.35 | -$21,663.82 |
| 143 | 🇭🇹 Haiti | $42,017.76 | -$22,261.23 |
| 144 | 🇹🇩 Chad | $42,216.90 | -$22,460.37 |
| 145 | 🇳🇪 Niger | $42,416.03 | -$22,659.50 |
| 146 | 🇰🇪 Kenya | $43,212.58 | -$23,456.05 |
| 147 | 🇫🇯 Fiji | $43,411.71 | -$23,655.18 |
| 148 | 🇪🇷 Eritrea | $43,610.85 | -$23,854.32 |
| 149 | 🇸🇸 South Sudan | $43,809.99 | -$24,053.46 |
| 150 | 🇵🇰 Pakistan | $44,208.26 | -$24,451.73 |
| 151 | 🇵🇹 Portugal | $44,208.26 | -$24,451.73 |
| 152 | 🇧🇿 Belize | $45,004.80 | -$25,248.27 |
| 153 | 🇳🇷 Nauru | $45,378.54 | -$25,622.01 |
| 154 | 🇹🇱 Timor-Leste | $46,597.89 | -$26,841.36 |
| 155 | 🇬🇭 Ghana | $46,996.17 | -$27,239.64 |
| 156 | 🇯🇵 Japan | $47,195.30 | -$27,438.77 |
| 157 | 🇧🇫 Burkina Faso | $47,394.44 | -$27,637.91 |
| 158 | 🇩🇰 Denmark | $48,190.98 | -$28,434.45 |
| 159 | 🇯🇴 Jordan | $48,987.53 | -$29,231.00 |
| 160 | 🏴 England | $49,301.82 | -$29,545.29 |
| 161 | 🏴 Scotland | $50,090.64 | -$30,334.11 |
| 162 | 🇵🇦 Panama | $50,580.62 | -$30,824.09 |
| 163 | 🇩🇪 Germany | $50,978.89 | -$31,222.36 |
| 164 | 🇬🇧 Ireland (Northern) | $51,536.83 | -$31,780.30 |
| 165 | 🇪🇸 Spain | $51,775.44 | -$32,018.91 |
| 166 | 🇩🇯 Djibouti | $52,173.71 | -$32,417.18 |
| 167 | 🏴 Wales | $52,194.19 | -$32,437.66 |
| 168 | 🇨🇻 Cape Verde | $52,372.85 | -$32,616.32 |
| 169 | 🇯🇲 Jamaica | $52,571.98 | -$32,815.45 |
| 170 | 🇧🇧 Barbados | $52,970.26 | -$33,213.73 |
| 171 | 🇸🇮 Slovenia | $52,970.26 | -$33,213.73 |
| 172 | 🇹🇻 Tuvalu | $53,887.02 | -$34,130.49 |
| 173 | 🇬🇼 Guinea-Bissau | $54,364.21 | -$34,607.68 |
| 174 | 🇰🇲 Comoros | $55,957.30 | -$36,200.77 |
| 175 | 🇧🇸 Bahamas | $56,753.85 | -$36,997.32 |
| 176 | 🇵🇬 Papua New Guinea | $57,550.39 | -$37,793.86 |
| 177 | 🇰🇳 Saint Kitts and Nevis | $60,935.71 | -$41,179.18 |
| 178 | 🇬🇩 Grenada | $61,533.12 | -$41,776.59 |
| 179 | 🇵🇼 Palau | $63,922.75 | -$44,166.22 |
| 180 | 🇱🇨 Saint Lucia | $63,922.75 | -$44,166.22 |
| 181 | 🇸🇨 Seychelles | $63,922.75 | -$44,166.22 |
| 182 | 🇬🇾 Guyana | $65,316.71 | -$45,560.18 |
| 183 | 🇳🇮 Nicaragua | $66,511.52 | -$46,754.99 |
| 184 | 🇻🇨 Saint Vincent and Grenadines | $68,901.16 | -$49,144.63 |
| 185 | 🇹🇴 Tonga | $72,087.34 | -$52,330.81 |
| 186 | 🇩🇲 Dominica | $73,282.16 | -$53,525.63 |
| 187 | 🇻🇺 Vanuatu | $76,070.07 | -$56,313.54 |
| 188 | 🇼🇸 Samoa | $76,667.48 | -$56,910.95 |
| 189 | 🇨🇺 Cuba | $76,946.27 | -$57,189.74 |
| 190 | 🇱🇷 Liberia | $77,663.16 | -$57,906.63 |
| 191 | 🇲🇻 Maldives | $78,459.70 | -$58,703.17 |
| 192 | 🇲🇭 Marshall Islands | $80,849.34 | -$61,092.81 |
| 193 | 🇸🇴 Somalia | $82,044.16 | -$62,287.63 |
| 194 | 🇰🇮 Kiribati | $82,243.29 | -$62,486.76 |
| 195 | 🇫🇲 Micronesia, Federated States Of | $82,442.43 | -$62,685.90 |
| 196 | 🇦🇬 Antigua and Barbuda | $89,412.20 | -$69,655.67 |
| 197 | 🇸🇧 Solomon Islands | $142,581.59 | -$122,825.06 |
| 198 | 🇻🇪 Venezuela | $246,530.74 | -$226,774.21 |
Venezuela ranks as the number one most expensive country to mine bitcoin. It costs a whooping $246,530.74 to mine a single bitcoin in the South American country, meaning the process is far from profitable. Energy costs are so expensive in the country that miners would be out $225,667.05 for just one bitcoin.
On the opposite end of the spectrum, the cheapest place to mine bitcoin is in Kuwait. It costs $1,393.95 to mine a single bitcoin in Kuwait, meaning miners could gain $19,469.74 in profits.
The Middle Eastern country has some of the cheapest electricity in the world, with one kWh costing an average of just 3 cents. For context, the average cost of one kWh in North America is 21 cents.
The Race is On
Despite the steep costs of bitcoin mining, many people believe it’s worth the upfront investment.
One thing that makes bitcoin particularly appealing is its finite supply—there are only 21 million coins available for mining, and as of this article’s publication, more than 19 million bitcoin have already been mined.
While the price of bitcoin (BTC) is notorious for its volatility, its value has still grown significantly over the last decade. And if cryptocurrencies become mainstream as many people believe they will, this could boost the price of bitcoin even further.

This article was published as a part of Visual Capitalist's Creator Program, which features data-driven visuals from some of our favorite Creators around the world.


Technology
Visualizing AI Patents by Country
See which countries have been granted the most AI patents each year, from 2012 to 2022.


Visualizing AI Patents by Country
This was originally posted on our Voronoi app. Download the app for free on iOS or Android and discover incredible data-driven charts from a variety of trusted sources.
This infographic shows the number of AI-related patents granted each year from 2010 to 2022 (latest data available). These figures come from the Center for Security and Emerging Technology (CSET), accessed via Stanford University’s 2024 AI Index Report.
From this data, we can see that China first overtook the U.S. in 2013. Since then, the country has seen enormous growth in the number of AI patents granted each year.
| Year | China | EU and UK | U.S. | RoW | Global Total |
|---|---|---|---|---|---|
| 2010 | 307 | 137 | 984 | 571 | 1,999 |
| 2011 | 516 | 129 | 980 | 581 | 2,206 |
| 2012 | 926 | 112 | 950 | 660 | 2,648 |
| 2013 | 1,035 | 91 | 970 | 627 | 2,723 |
| 2014 | 1,278 | 97 | 1,078 | 667 | 3,120 |
| 2015 | 1,721 | 110 | 1,135 | 539 | 3,505 |
| 2016 | 1,621 | 128 | 1,298 | 714 | 3,761 |
| 2017 | 2,428 | 144 | 1,489 | 1,075 | 5,136 |
| 2018 | 4,741 | 155 | 1,674 | 1,574 | 8,144 |
| 2019 | 9,530 | 322 | 3,211 | 2,720 | 15,783 |
| 2020 | 13,071 | 406 | 5,441 | 4,455 | 23,373 |
| 2021 | 21,907 | 623 | 8,219 | 7,519 | 38,268 |
| 2022 | 35,315 | 1,173 | 12,077 | 13,699 | 62,264 |
In 2022, China was granted more patents than every other country combined.
While this suggests that the country is very active in researching the field of artificial intelligence, it doesn’t necessarily mean that China is the farthest in terms of capability.
Key Facts About AI Patents
According to CSET, AI patents relate to mathematical relationships and algorithms, which are considered abstract ideas under patent law. They can also have different meaning, depending on where they are filed.
In the U.S., AI patenting is concentrated amongst large companies including IBM, Microsoft, and Google. On the other hand, AI patenting in China is more distributed across government organizations, universities, and tech firms (e.g. Tencent).
In terms of focus area, China’s patents are typically related to computer vision, a field of AI that enables computers and systems to interpret visual data and inputs. Meanwhile America’s efforts are more evenly distributed across research fields.
Learn More About AI From Visual Capitalist
If you want to see more data visualizations on artificial intelligence, check out this graphic that shows which job departments will be impacted by AI the most.

-

 Markets1 week ago
U.S. Debt Interest Payments Reach $1 Trillion
-

 Markets2 weeks ago
Ranked: The Most Valuable Housing Markets in America
-

 Money2 weeks ago
Which States Have the Highest Minimum Wage in America?
-

 AI2 weeks ago
Ranked: Semiconductor Companies by Industry Revenue Share
-

 Markets2 weeks ago
Ranked: The World’s Top Flight Routes, by Revenue
-

 Countries2 weeks ago
Population Projections: The World’s 6 Largest Countries in 2075
-

 Markets2 weeks ago
The Top 10 States by Real GDP Growth in 2023
-

 Money2 weeks ago
The Smallest Gender Wage Gaps in OECD Countries