Technology
The Cost of Mining Bitcoin in 198 Different Countries
Article/Editing:
View a higher resolution version of this map.
Cost of Mining Bitcoin in 198 Different Countries
View a higher resolution version of this map.
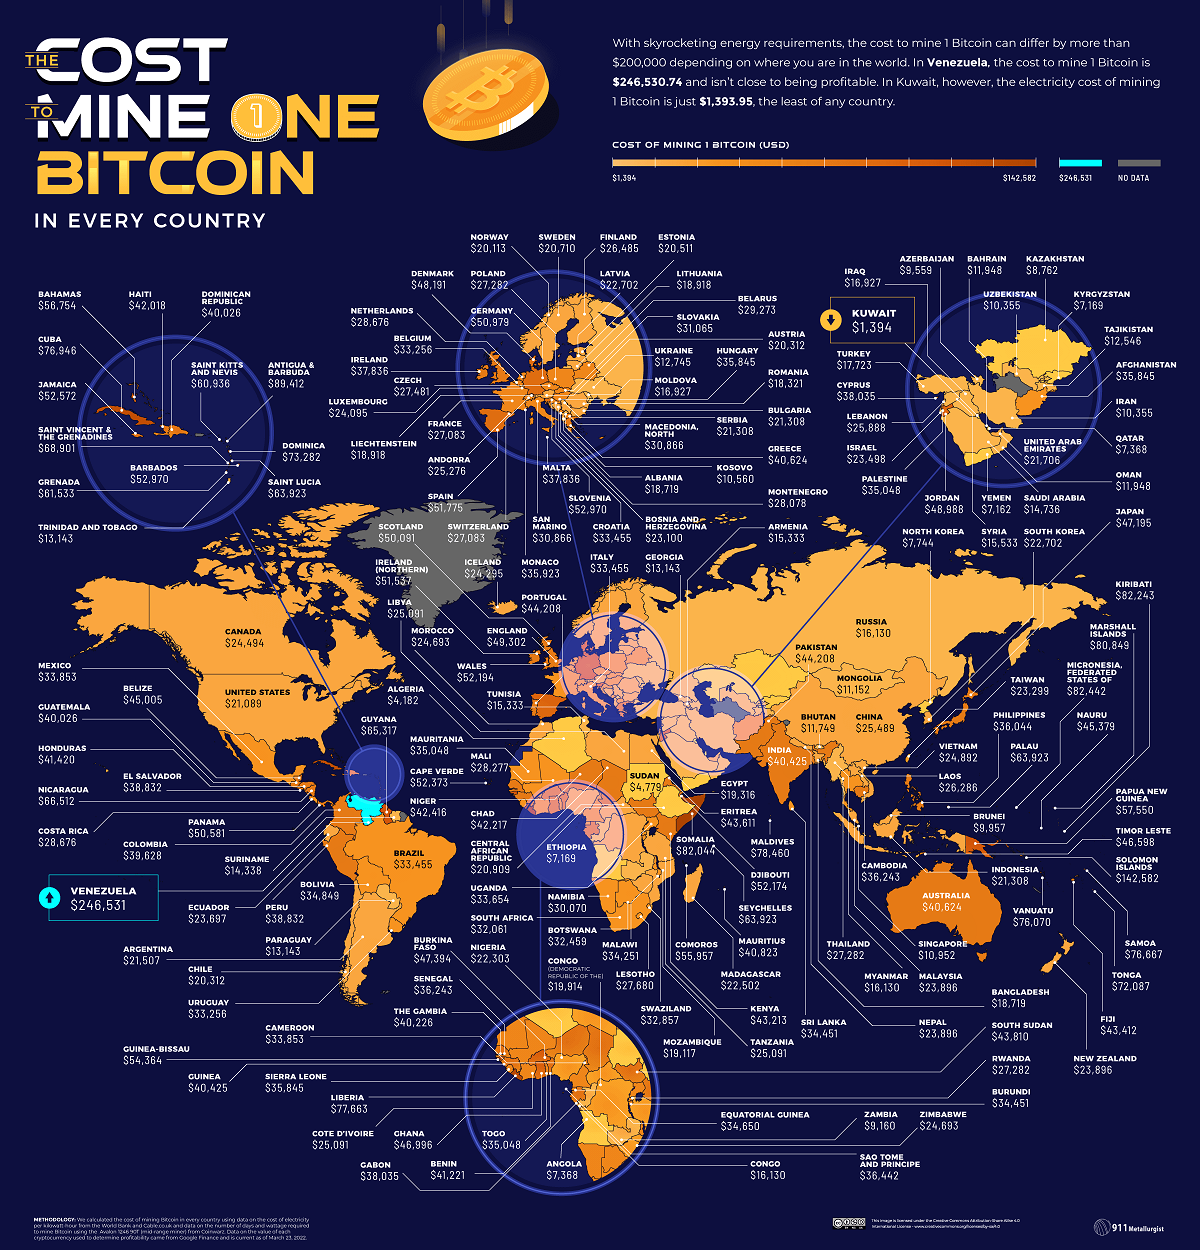
It takes an estimated 1,449 kilowatt hours (kWh) of energy to mine a single bitcoin. That’s the same amount of energy an average U.S. household consumes in approximately 13 years.
Given the high amount of energy needed to mine bitcoin, it can be a costly venture to get into. But exact prices fluctuate, depending on the location and the cost of electricity in the area.
Where are the cheapest and most expensive places to mine this popular cryptocurrency? This graphic by 911 Metallurgist provides a snapshot of the estimated cost of mining bitcoin around the world, using pricing and relative costs from March 23, 2022.
How Does Bitcoin Mining Work?
Before diving in, it’s worth briefly explaining the basics of bitcoin mining, and why it requires so much energy.
When someone mines for bitcoin, what they’re really doing is adding and verifying a new transaction record to the blockchain—the decentralized bank ledger where bitcoin is traded and distributed.
To create this new record, crypto miners need to crack a complex equation that’s been generated by the blockchain system.
Potentially tens of thousands of miners are racing to crack the same code at any given time. Only the first person to solve the equation gets rewarded (unless you’re part of a mining pool, which is essentially a group of miners who agree to combine efforts to increase their chances of solving the equation).
The faster your computing power is, the better your chances are of winning, so solving the equation first requires powerful equipment that takes up a lot of energy.
The Costs and Profits of Mining Bitcoin in 198 Countries
Across the 198 countries included in the dataset, the average cost to mine bitcoin sat at $35,404.03, more than bitcoin’s value of $20,863.69 on July 15, 2022. Though it’s important to note that fluctuating energy prices, and more or less miners on the bitcoin network, constantly change the necessary energy and final cost.
Here’s a breakdown of what the cost to mine one bitcoin in each country was in March 23, 2022, along with the potential profit after accounting for mining costs:
| # | Country | Cost to mine 1 bitcoin | Profit (July 15, 2022) |
|---|---|---|---|
| 1 | 🇰🇼 Kuwait | $1,393.95 | $18,362.58 |
| 2 | 🇩🇿 Algeria | $4,181.86 | $15,574.67 |
| 3 | 🇸🇩 Sudan | $4,779.27 | $14,977.26 |
| 4 | 🇾🇪 Yemen | $7,161.77 | $12,594.76 |
| 5 | 🇪🇹 Ethiopia | $7,168.91 | $12,587.62 |
| 6 | 🇰🇬 Kyrgyzstan | $7,168.91 | $12,587.62 |
| 7 | 🇦🇴 Angola | $7,368.04 | $12,388.49 |
| 8 | 🇶🇦 Qatar | $7,368.04 | $12,388.49 |
| 9 | 🇰🇵 North Korea | $7,744.32 | $12,012.21 |
| 10 | 🇰🇿 Kazakhstan | $8,762.00 | $10,994.53 |
| 11 | 🇿🇲 Zambia | $9,160.27 | $10,596.26 |
| 12 | 🇦🇿 Azerbaijan | $9,558.54 | $10,197.99 |
| 13 | 🇧🇳 Brunei | $9,956.81 | $9,799.72 |
| 14 | 🇮🇷 Iran | $10,355.09 | $9,401.44 |
| 15 | 🇺🇿 Uzbekistan | $10,355.09 | $9,401.44 |
| 16 | 🇽🇰 Kosovo | $10,560.17 | $9,196.36 |
| 17 | 🇸🇬 Singapore | $10,952.50 | $8,804.03 |
| 18 | 🇲🇳 Mongolia | $11,151.63 | $8,604.90 |
| 19 | 🇧🇹 Bhutan | $11,749.04 | $8,007.49 |
| 20 | 🇧🇭 Bahrain | $11,948.18 | $7,808.35 |
| 21 | 🇴🇲 Oman | $11,948.18 | $7,808.35 |
| 22 | 🇹🇯 Tajikistan | $12,545.59 | $7,210.94 |
| 23 | 🇺🇦 Ukraine | $12,744.72 | $7,011.81 |
| 24 | 🇬🇪 Georgia | $13,143.00 | $6,613.53 |
| 25 | 🇦🇬 Paraguay | $13,143.00 | $6,613.53 |
| 26 | 🇹🇹 Trinidad and Tobago | $13,143.00 | $6,613.53 |
| 27 | 🇸🇷 Suriname | $14,337.81 | $5,418.72 |
| 28 | 🇸🇦 Saudi Arabia | $14,736.09 | $5,020.44 |
| 29 | 🇦🇲 Armenia | $15,333.50 | $4,423.03 |
| 30 | 🇹🇳 Tunisia | $15,333.50 | $4,423.03 |
| 31 | 🇸🇾 Syria | $15,532.63 | $4,223.90 |
| 32 | 🇨🇬 Congo (Republic Of The) | $16,130.04 | $3,626.49 |
| 33 | 🇲🇲 Myanmar | $16,130.04 | $3,626.49 |
| 34 | 🇷🇺 Russia | $16,130.04 | $3,626.49 |
| 35 | 🇮🇶 Iraq | $16,926.59 | $2,829.94 |
| 36 | 🇲🇩 Moldova | $16,926.59 | $2,829.94 |
| 37 | 🇹🇷 Turkey | $17,723.13 | $2,033.40 |
| 38 | 🇷🇴 Romania | $18,320.54 | $1,435.99 |
| 39 | 🇦🇱 Albania | $18,718.81 | $1,037.72 |
| 40 | 🇧🇩 Bangladesh | $18,718.81 | $1,037.72 |
| 41 | 🇱🇮 Liechtenstein | $18,917.95 | $838.58 |
| 42 | 🇱🇹 Lithuania | $18,917.95 | $838.58 |
| 43 | 🇲🇿 Mozambique | $19,117.08 | $639.45 |
| 44 | 🇪🇬 Egypt | $19,316.22 | $440.31 |
| 45 | 🇨🇩 Congo (Democratic Republic Of The) | $19,913.63 | -$157.10 |
| 46 | 🇳🇴 Norway | $20,112.77 | -$356.24 |
| 47 | 🇦🇹 Austria | $20,311.90 | -$555.37 |
| 48 | 🇨🇱 Chile | $20,311.90 | -$555.37 |
| 49 | 🇪🇪 Estonia | $20,511.04 | -$754.51 |
| 50 | 🇸🇪 Sweden | $20,710.18 | -$953.65 |
| 51 | 🇨🇫 Central African Republic | $20,909.31 | -$1,152.78 |
| 52 | 🇺🇸 United States | $21,088.53 | -$1,332.00 |
| 53 | 🇧🇬 Bulgaria | $21,307.58 | -$1,551.05 |
| 54 | 🇮🇩 Indonesia | $21,307.58 | -$1,551.05 |
| 55 | 🇷🇸 Serbia | $21,307.58 | -$1,551.05 |
| 56 | 🇦🇷 Argentina | $21,506.72 | -$1,750.19 |
| 57 | 🇦🇪 United Arab Emirates | $21,705.86 | -$1,949.33 |
| 58 | 🇳🇬 Nigeria | $22,303.27 | -$2,546.74 |
| 59 | 🇲🇬 Madagascar | $22,502.40 | -$2,745.87 |
| 60 | 🇱🇻 Latvia | $22,701.54 | -$2,945.01 |
| 61 | 🇰🇷 South Korea | $22,701.54 | -$2,945.01 |
| 62 | 🇧🇦 Bosnia and Herzegovina | $23,099.81 | -$3,343.28 |
| 63 | 🇹🇼 Taiwan | $23,298.95 | -$3,542.42 |
| 64 | 🇮🇱 Israel | $23,498.08 | -$3,741.55 |
| 65 | 🇪🇨 Ecuador | $23,697.22 | -$3,940.69 |
| 66 | 🇲🇾 Malaysia | $23,896.36 | -$4,139.83 |
| 67 | 🇳🇵 Nepal | $23,896.36 | -$4,139.83 |
| 68 | 🇳🇿 New Zealand | $23,896.36 | -$4,139.83 |
| 69 | 🇱🇺 Luxembourg | $24,095.49 | -$4,338.96 |
| 70 | 🇮🇸 Iceland | $24,294.63 | -$4,538.10 |
| 71 | 🇨🇦 Canada | $24,493.76 | -$4,737.23 |
| 72 | 🇲🇦 Morocco | $24,692.90 | -$4,936.37 |
| 73 | 🇿🇼 Zimbabwe | $24,692.90 | -$4,936.37 |
| 74 | 🇻🇳 Vietnam | $24,892.04 | -$5,135.51 |
| 75 | 🇨🇮 Côte D’Ivoire (Ivory Coast) | $25,091.17 | -$5,334.64 |
| 76 | 🇱🇾 Libya | $25,091.17 | -$5,334.64 |
| 77 | 🇹🇿 Tanzania | $25,091.17 | -$5,334.64 |
| 78 | 🇦🇩 Andorra | $25,276.27 | -$5,519.74 |
| 79 | 🇨🇳 China | $25,489.45 | -$5,732.92 |
| 80 | 🇱🇧 Lebanon | $25,887.72 | -$6,131.19 |
| 81 | 🇱🇦 Laos | $26,285.99 | -$6,529.46 |
| 82 | 🇫🇮 Finland | $26,485.13 | -$6,728.60 |
| 83 | 🇫🇷 France | $27,082.54 | -$7,326.01 |
| 84 | 🇨🇭 Switzerland | $27,082.54 | -$7,326.01 |
| 85 | 🇵🇱 Poland | $27,281.67 | -$7,525.14 |
| 86 | 🇷🇼 Rwanda | $27,281.67 | -$7,525.14 |
| 87 | 🇹🇭 Thailand | $27,281.67 | -$7,525.14 |
| 88 | 🇨🇿 Czech Republic | $27,480.81 | -$7,724.28 |
| 89 | 🇱🇸 Lesotho | $27,679.95 | -$7,923.42 |
| 90 | 🇲🇪 Montenegro | $28,078.22 | -$8,321.69 |
| 91 | 🇲🇱 Mali | $28,277.35 | -$8,520.82 |
| 92 | 🇨🇷 Costa Rica | $28,675.63 | -$8,919.10 |
| 93 | 🇳🇱 Netherlands | $28,675.63 | -$8,919.10 |
| 94 | 🇧🇾 Belarus | $29,273.04 | -$9,516.51 |
| 95 | 🇳🇦 Namibia | $30,069.58 | -$10,313.05 |
| 96 | 🇲🇰 Macedonia, North | $30,866.13 | -$11,109.60 |
| 97 | 🇸🇲 San Marino | $30,866.13 | -$11,109.60 |
| 98 | 🇸🇰 Slovakia | $31,065.26 | -$11,308.73 |
| 99 | 🇿🇦 South Africa | $32,060.94 | -$12,304.41 |
| 100 | 🇧🇼 Botswana | $32,459.22 | -$12,702.69 |
| 101 | 🇸🇿 Swaziland | $32,857.49 | -$13,100.96 |
| 102 | 🇧🇪 Belgium | $33,255.76 | -$13,499.23 |
| 103 | 🇺🇾 Uruguay | $33,255.76 | -$13,499.23 |
| 104 | 🇧🇷 Brazil | $33,454.90 | -$13,698.37 |
| 105 | 🇭🇷 Croatia | $33,454.90 | -$13,698.37 |
| 106 | 🇮🇹 Italy | $33,454.90 | -$13,698.37 |
| 107 | 🇺🇬 Uganda | $33,654.03 | -$13,897.50 |
| 108 | 🇨🇲 Cameroon | $33,853.17 | -$14,096.64 |
| 109 | 🇲🇽 Mexico | $33,853.17 | -$14,096.64 |
| 110 | 🇲🇼 Malawi | $34,251.44 | -$14,494.91 |
| 111 | 🇧🇮 Burundi | $34,450.58 | -$14,694.05 |
| 112 | 🇱🇰 Sri Lanka | $34,450.58 | -$14,694.05 |
| 113 | 🇬🇶 Equatorial Guinea | $34,649.72 | -$14,893.19 |
| 114 | 🇧🇴 Bolivia | $34,848.85 | -$15,092.32 |
| 115 | 🇲🇷 Mauritania | $35,047.99 | -$15,291.46 |
| 116 | 🇵🇸 Palestine | $35,047.99 | -$15,291.46 |
| 117 | 🇹🇬 Togo | $35,047.99 | -$15,291.46 |
| 118 | 🇦🇫 Afghanistan | $35,844.53 | -$16,088.00 |
| 119 | 🇭🇺 Hungary | $35,844.53 | -$16,088.00 |
| 120 | 🇸🇱 Sierra Leone | $35,844.53 | -$16,088.00 |
| 121 | 🇲🇨 Monaco | $35,922.73 | -$16,166.20 |
| 122 | 🇵🇭 Philippines | $36,043.67 | -$16,287.14 |
| 123 | 🇰🇭 Cambodia | $36,242.81 | -$16,486.28 |
| 124 | 🇸🇳 Senegal | $36,242.81 | -$16,486.28 |
| 125 | 🇸🇹 São Tomé and Príncipe | $36,441.94 | -$16,685.41 |
| 126 | 🇮🇪 Ireland (Republic Of) | $37,835.90 | -$18,079.37 |
| 127 | 🇲🇹 Malta | $37,835.90 | -$18,079.37 |
| 128 | 🇨🇾 Cyprus | $38,035.03 | -$18,278.50 |
| 129 | 🇬🇦 Gabon | $38,035.03 | -$18,278.50 |
| 130 | 🇸🇻 El Salvador | $38,831.58 | -$19,075.05 |
| 131 | 🇵🇪 Peru | $38,831.58 | -$19,075.05 |
| 132 | 🇨🇴 Colombia | $39,628.12 | -$19,871.59 |
| 133 | 🇩🇴 Dominican Republic | $40,026.40 | -$20,269.87 |
| 134 | 🇬🇹 Guatemala | $40,026.40 | -$20,269.87 |
| 135 | 🇬🇲 The Gambia | $40,225.53 | -$20,469.00 |
| 136 | 🇬🇳 Guinea | $40,424.67 | -$20,668.14 |
| 137 | 🇮🇳 India | $40,424.67 | -$20,668.14 |
| 138 | 🇦🇺 Australia | $40,623.81 | -$20,867.28 |
| 139 | 🇬🇷 Greece | $40,623.81 | -$20,867.28 |
| 140 | 🇲🇺 Mauritius | $40,822.94 | -$21,066.41 |
| 141 | 🇧🇯 Benin | $41,221.21 | -$21,464.68 |
| 142 | 🇭🇳 Honduras | $41,420.35 | -$21,663.82 |
| 143 | 🇭🇹 Haiti | $42,017.76 | -$22,261.23 |
| 144 | 🇹🇩 Chad | $42,216.90 | -$22,460.37 |
| 145 | 🇳🇪 Niger | $42,416.03 | -$22,659.50 |
| 146 | 🇰🇪 Kenya | $43,212.58 | -$23,456.05 |
| 147 | 🇫🇯 Fiji | $43,411.71 | -$23,655.18 |
| 148 | 🇪🇷 Eritrea | $43,610.85 | -$23,854.32 |
| 149 | 🇸🇸 South Sudan | $43,809.99 | -$24,053.46 |
| 150 | 🇵🇰 Pakistan | $44,208.26 | -$24,451.73 |
| 151 | 🇵🇹 Portugal | $44,208.26 | -$24,451.73 |
| 152 | 🇧🇿 Belize | $45,004.80 | -$25,248.27 |
| 153 | 🇳🇷 Nauru | $45,378.54 | -$25,622.01 |
| 154 | 🇹🇱 Timor-Leste | $46,597.89 | -$26,841.36 |
| 155 | 🇬🇭 Ghana | $46,996.17 | -$27,239.64 |
| 156 | 🇯🇵 Japan | $47,195.30 | -$27,438.77 |
| 157 | 🇧🇫 Burkina Faso | $47,394.44 | -$27,637.91 |
| 158 | 🇩🇰 Denmark | $48,190.98 | -$28,434.45 |
| 159 | 🇯🇴 Jordan | $48,987.53 | -$29,231.00 |
| 160 | 🏴 England | $49,301.82 | -$29,545.29 |
| 161 | 🏴 Scotland | $50,090.64 | -$30,334.11 |
| 162 | 🇵🇦 Panama | $50,580.62 | -$30,824.09 |
| 163 | 🇩🇪 Germany | $50,978.89 | -$31,222.36 |
| 164 | 🇬🇧 Ireland (Northern) | $51,536.83 | -$31,780.30 |
| 165 | 🇪🇸 Spain | $51,775.44 | -$32,018.91 |
| 166 | 🇩🇯 Djibouti | $52,173.71 | -$32,417.18 |
| 167 | 🏴 Wales | $52,194.19 | -$32,437.66 |
| 168 | 🇨🇻 Cape Verde | $52,372.85 | -$32,616.32 |
| 169 | 🇯🇲 Jamaica | $52,571.98 | -$32,815.45 |
| 170 | 🇧🇧 Barbados | $52,970.26 | -$33,213.73 |
| 171 | 🇸🇮 Slovenia | $52,970.26 | -$33,213.73 |
| 172 | 🇹🇻 Tuvalu | $53,887.02 | -$34,130.49 |
| 173 | 🇬🇼 Guinea-Bissau | $54,364.21 | -$34,607.68 |
| 174 | 🇰🇲 Comoros | $55,957.30 | -$36,200.77 |
| 175 | 🇧🇸 Bahamas | $56,753.85 | -$36,997.32 |
| 176 | 🇵🇬 Papua New Guinea | $57,550.39 | -$37,793.86 |
| 177 | 🇰🇳 Saint Kitts and Nevis | $60,935.71 | -$41,179.18 |
| 178 | 🇬🇩 Grenada | $61,533.12 | -$41,776.59 |
| 179 | 🇵🇼 Palau | $63,922.75 | -$44,166.22 |
| 180 | 🇱🇨 Saint Lucia | $63,922.75 | -$44,166.22 |
| 181 | 🇸🇨 Seychelles | $63,922.75 | -$44,166.22 |
| 182 | 🇬🇾 Guyana | $65,316.71 | -$45,560.18 |
| 183 | 🇳🇮 Nicaragua | $66,511.52 | -$46,754.99 |
| 184 | 🇻🇨 Saint Vincent and Grenadines | $68,901.16 | -$49,144.63 |
| 185 | 🇹🇴 Tonga | $72,087.34 | -$52,330.81 |
| 186 | 🇩🇲 Dominica | $73,282.16 | -$53,525.63 |
| 187 | 🇻🇺 Vanuatu | $76,070.07 | -$56,313.54 |
| 188 | 🇼🇸 Samoa | $76,667.48 | -$56,910.95 |
| 189 | 🇨🇺 Cuba | $76,946.27 | -$57,189.74 |
| 190 | 🇱🇷 Liberia | $77,663.16 | -$57,906.63 |
| 191 | 🇲🇻 Maldives | $78,459.70 | -$58,703.17 |
| 192 | 🇲🇭 Marshall Islands | $80,849.34 | -$61,092.81 |
| 193 | 🇸🇴 Somalia | $82,044.16 | -$62,287.63 |
| 194 | 🇰🇮 Kiribati | $82,243.29 | -$62,486.76 |
| 195 | 🇫🇲 Micronesia, Federated States Of | $82,442.43 | -$62,685.90 |
| 196 | 🇦🇬 Antigua and Barbuda | $89,412.20 | -$69,655.67 |
| 197 | 🇸🇧 Solomon Islands | $142,581.59 | -$122,825.06 |
| 198 | 🇻🇪 Venezuela | $246,530.74 | -$226,774.21 |
Venezuela ranks as the number one most expensive country to mine bitcoin. It costs a whooping $246,530.74 to mine a single bitcoin in the South American country, meaning the process is far from profitable. Energy costs are so expensive in the country that miners would be out $225,667.05 for just one bitcoin.
On the opposite end of the spectrum, the cheapest place to mine bitcoin is in Kuwait. It costs $1,393.95 to mine a single bitcoin in Kuwait, meaning miners could gain $19,469.74 in profits.
The Middle Eastern country has some of the cheapest electricity in the world, with one kWh costing an average of just 3 cents. For context, the average cost of one kWh in North America is 21 cents.
The Race is On
Despite the steep costs of bitcoin mining, many people believe it’s worth the upfront investment.
One thing that makes bitcoin particularly appealing is its finite supply—there are only 21 million coins available for mining, and as of this article’s publication, more than 19 million bitcoin have already been mined.
While the price of bitcoin (BTC) is notorious for its volatility, its value has still grown significantly over the last decade. And if cryptocurrencies become mainstream as many people believe they will, this could boost the price of bitcoin even further.

This article was published as a part of Visual Capitalist's Creator Program, which features data-driven visuals from some of our favorite Creators around the world.


Technology
Ranked: Semiconductor Companies by Industry Revenue Share
Nvidia is coming for Intel’s crown. Samsung is losing ground. AI is transforming the space. We break down revenue for semiconductor companies.


Semiconductor Companies by Industry Revenue Share
This was originally posted on our Voronoi app. Download the app for free on Apple or Android and discover incredible data-driven charts from a variety of trusted sources.
Did you know that some computer chips are now retailing for the price of a new BMW?
As computers invade nearly every sphere of life, so too have the chips that power them, raising the revenues of the businesses dedicated to designing them.
But how did various chipmakers measure against each other last year?
We rank the biggest semiconductor companies by their percentage share of the industry’s revenues in 2023, using data from Omdia research.
Which Chip Company Made the Most Money in 2023?
Market leader and industry-defining veteran Intel still holds the crown for the most revenue in the sector, crossing $50 billion in 2023, or 10% of the broader industry’s topline.
All is not well at Intel, however, with the company’s stock price down over 20% year-to-date after it revealed billion-dollar losses in its foundry business.
| Rank | Company | 2023 Revenue | % of Industry Revenue |
|---|---|---|---|
| 1 | Intel | $51B | 9.4% |
| 2 | NVIDIA | $49B | 9.0% |
| 3 | Samsung Electronics | $44B | 8.1% |
| 4 | Qualcomm | $31B | 5.7% |
| 5 | Broadcom | $28B | 5.2% |
| 6 | SK Hynix | $24B | 4.4% |
| 7 | AMD | $22B | 4.1% |
| 8 | Apple | $19B | 3.4% |
| 9 | Infineon Tech | $17B | 3.2% |
| 10 | STMicroelectronics | $17B | 3.2% |
| 11 | Texas Instruments | $17B | 3.1% |
| 12 | Micron Technology | $16B | 2.9% |
| 13 | MediaTek | $14B | 2.6% |
| 14 | NXP | $13B | 2.4% |
| 15 | Analog Devices | $12B | 2.2% |
| 16 | Renesas Electronics Corporation | $11B | 1.9% |
| 17 | Sony Semiconductor Solutions Corporation | $10B | 1.9% |
| 18 | Microchip Technology | $8B | 1.5% |
| 19 | Onsemi | $8B | 1.4% |
| 20 | KIOXIA Corporation | $7B | 1.3% |
| N/A | Others | $126B | 23.2% |
| N/A | Total | $545B | 100% |
Note: Figures are rounded. Totals and percentages may not sum to 100.
Meanwhile, Nvidia is very close to overtaking Intel, after declaring $49 billion of topline revenue for 2023. This is more than double its 2022 revenue ($21 billion), increasing its share of industry revenues to 9%.
Nvidia’s meteoric rise has gotten a huge thumbs-up from investors. It became a trillion dollar stock last year, and broke the single-day gain record for market capitalization this year.
Other chipmakers haven’t been as successful. Out of the top 20 semiconductor companies by revenue, 12 did not match their 2022 revenues, including big names like Intel, Samsung, and AMD.
The Many Different Types of Chipmakers
All of these companies may belong to the same industry, but they don’t focus on the same niche.
According to Investopedia, there are four major types of chips, depending on their functionality: microprocessors, memory chips, standard chips, and complex systems on a chip.
Nvidia’s core business was once GPUs for computers (graphics processing units), but in recent years this has drastically shifted towards microprocessors for analytics and AI.
These specialized chips seem to be where the majority of growth is occurring within the sector. For example, companies that are largely in the memory segment—Samsung, SK Hynix, and Micron Technology—saw peak revenues in the mid-2010s.

-

 Business2 weeks ago
America’s Top Companies by Revenue (1994 vs. 2023)
-

 Environment1 week ago
Ranked: Top Countries by Total Forest Loss Since 2001
-

 Markets1 week ago
Visualizing America’s Shortage of Affordable Homes
-

 Maps2 weeks ago
Mapped: Average Wages Across Europe
-

 Mining2 weeks ago
Charted: The Value Gap Between the Gold Price and Gold Miners
-

 Demographics2 weeks ago
Visualizing the Size of the Global Senior Population
-

 Misc2 weeks ago
Tesla Is Once Again the World’s Best-Selling EV Company
-

 Technology2 weeks ago
Ranked: The Most Popular Smartphone Brands in the U.S.