GDP
Animated Chart: Remittance Flows and GDP Impact By Country
Article/Editing:
Visualizing Remittance Flows and GDP Impact By Country
The COVID-19 pandemic slowed down the flow of global immigration by 27%. Alongside it, travel restrictions, job losses, and mounting health concerns meant that many migrant workers couldn’t send money in the form of remittances back to families in their home countries.
This flow of remittances received by countries dropped by 1.5% to $711 billion globally in 2020. But over the next two years, things quickly turned back around.
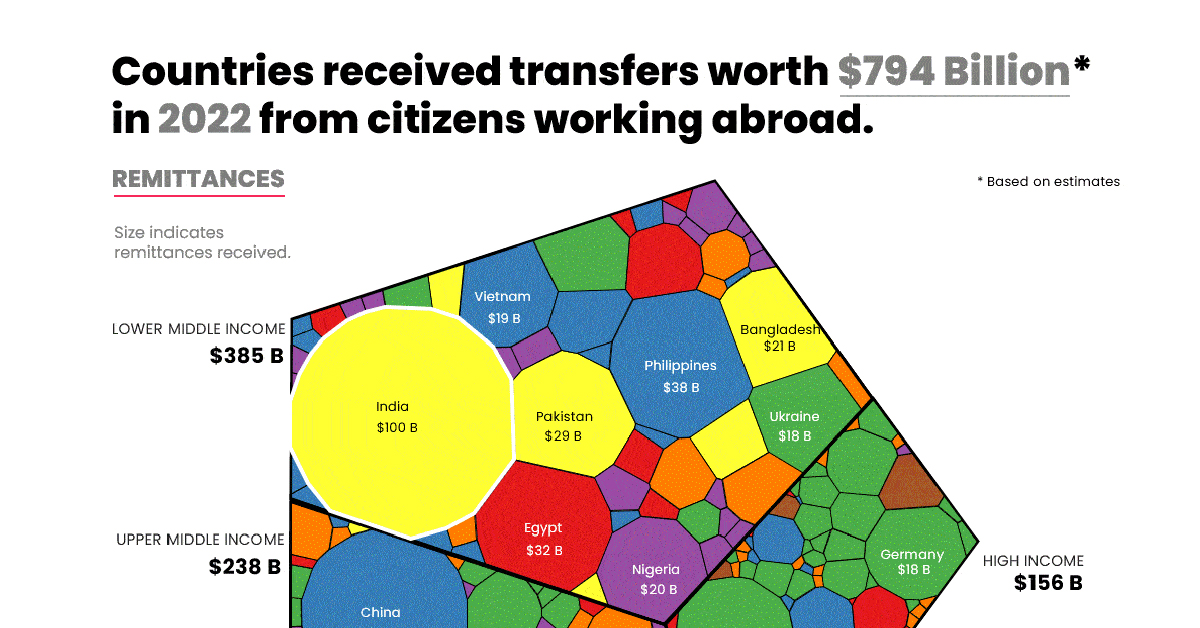
As visa approvals restarted and international borders opened, so did international migration and global remittance flows. In 2021, total global remittances were estimated at $781 billion and have further risen to $794 billion in 2022.
In these images, Richie Lionell uses the World Bank’s KNOMAD data to visualize this increasing flow of money across international borders in 176 countries.
Why Do Remittances Matter?
Remittances contribute to the economy of nations worldwide, especially low and middle-income countries (LMICs).
They have been shown to help alleviate poverty, improve nutrition, and even increase school enrollment rates in these nations. Research has also found that these inflows of income can help recipient households become resilient, especially in the face of disasters.
At the same time, it’s worth noting that these transfers aren’t a silver bullet for recipient nations. In fact, some research shows that overreliance on remittances can cause a vicious cycle that doesn’t translate to consistent economic growth over time.
Countries Receiving the Highest Remittances
For the past 15 years, India has consistently topped the chart of the largest remittance beneficiaries.
| Rank | Remittance Inflows by Country | 2022 (USD) |
|---|---|---|
| 1 | India | $100,000M |
| 2 | Mexico | $60,300M |
| 3 | China | $51,000M |
| 4 | Philippines | $38,000M |
| 5 | Egypt, Arab Rep. | $32,337M |
| 6 | Pakistan | $29,000M |
| 7 | France | $28,520M |
| 8 | Bangladesh | $21,000M |
| 9 | Nigeria | $20,945M |
| 10 | Vietnam | $19,000M |
| 11 | Ukraine | $18,421M |
| 12 | Guatemala | $18,112M |
| 13 | Germany | $18,000M |
| 14 | Belgium | $13,500M |
| 15 | Uzbekistan | $13,500M |
| 16 | Morocco | $11,401M |
| 17 | Romania | $11,064M |
| 18 | Dominican Republic | $9,920M |
| 19 | Indonesia | $9,700M |
| 20 | Thailand | $9,500M |
| 21 | Colombia | $9,133M |
| 22 | Italy | $9,000M |
| 23 | Nepal | $8,500M |
| 24 | Spain | $8,500M |
| 25 | Honduras | $8,284M |
| 26 | Poland | $8,000M |
| 27 | Korea, Rep. | $7,877M |
| 28 | El Salvador | $7,620M |
| 29 | Lebanon | $6,841M |
| 30 | Israel | $6,143M |
| 31 | United States | $6,097M |
| 32 | Russian Federation | $6,000M |
| 33 | Serbia | $5,400M |
| 34 | Brazil | $5,045M |
| 35 | Japan | $5,000M |
| 36 | Portugal | $4,694M |
| 37 | Ghana | $4,664M |
| 38 | Jordan | $4,646M |
| 39 | Czech Republic | $4,539M |
| 40 | Haiti | $4,532M |
| 41 | Ecuador | $4,468M |
| 42 | Georgia | $4,100M |
| 43 | Kenya | $4,091M |
| 44 | Croatia | $3,701M |
| 45 | Peru | $3,699M |
| 46 | Sri Lanka | $3,600M |
| 47 | West Bank and Gaza | $3,495M |
| 48 | Jamaica | $3,419M |
| 49 | Armenia | $3,350M |
| 50 | Tajikistan | $3,200M |
| 51 | Nicaragua | $3,126M |
| 52 | Kyrgyz Republic | $3,050M |
| 53 | Senegal | $2,711M |
| 54 | Austria | $2,700M |
| 55 | Switzerland | $2,631M |
| 56 | Sweden | $2,565M |
| 57 | United Kingdom | $2,501M |
| 58 | Hungary | $2,404M |
| 59 | Bosnia and Herzegovina | $2,400M |
| 60 | Slovak Republic | $2,300M |
| 61 | Moldova | $2,170M |
| 62 | Azerbaijan | $2,150M |
| 63 | Tunisia | $2,085M |
| 64 | Zimbabwe | $2,047M |
| 65 | Luxembourg | $2,000M |
| 66 | Netherlands | $2,000M |
| 67 | Myanmar | $1,900M |
| 68 | Algeria | $1,829M |
| 69 | Albania | $1,800M |
| 70 | Somalia | $1735M |
| 71 | Congo, Dem. Rep. | $1,664M |
| 72 | Malaysia | $1,620M |
| 73 | Kosovo | $1,600M |
| 74 | Denmark | $1,517M |
| 75 | Latvia | $1,500M |
| 76 | Bolivia | $1,403M |
| 77 | Belarus | $1,350M |
| 78 | Cambodia | $1,250M |
| 79 | Bermuda | $1,200M |
| 80 | South Sudan | $1,187M |
| 81 | Uganda | $1,131M |
| 82 | Mali | $1,094M |
| 83 | South Africa | $1,019M |
| 84 | Sudan | $1,013M |
| 85 | Argentina | $966M |
| 86 | Montenegro | $920M |
| 87 | Finland | $880M |
| 88 | Bulgaria | $850M |
| 89 | Slovenia | $800M |
| 90 | Australia | $737M |
| 91 | Madagascar | $718M |
| 92 | Turkey | $710M |
| 93 | Canada | $700M |
| 94 | Lithuania | $700M |
| 95 | Togo | $668M |
| 96 | Greece | $665M |
| 97 | Costa Rica | $654M |
| 98 | Estonia | $626M |
| 99 | Qatar | $624M |
| 100 | Iraq | $624M |
| 101 | Gambia, The | $615M |
| 102 | Tanzania | $609M |
| 103 | Norway | $600M |
| 104 | Panama | $596M |
| 105 | Burkina Faso | $589M |
| 106 | Hong Kong SAR, China | $571M |
| 107 | Paraguay | $554M |
| 108 | Mozambique | $545M |
| 109 | Niger | $534M |
| 110 | Cyprus | $527M |
| 111 | Lesotho | $527M |
| 112 | Mongolia | $500M |
| 113 | Rwanda | $469M |
| 114 | Fiji | $450M |
| 115 | North Macedonia | $450M |
| 116 | Guyana | $400M |
| 117 | Cabo Verde | $375M |
| 118 | Kazakhstan | $370M |
| 119 | Cameroon | $365M |
| 120 | Cote d'Ivoire | $360M |
| 121 | Liberia | $351M |
| 122 | Afghanistan | $350M |
| 123 | Ethiopia | $327M |
| 124 | Samoa | $280M |
| 125 | Mauritius | $279M |
| 126 | Saudi Arabia | $273M |
| 127 | Malta | $271M |
| 128 | Malawi | $267M |
| 129 | Zambia | $260M |
| 130 | Tonga | $250M |
| 131 | Comoros | $250M |
| 132 | Ireland | $249M |
| 133 | Suriname | $221M |
| 134 | Benin | $209M |
| 135 | Lao PDR | $200M |
| 136 | Timor-Leste | $185M |
| 137 | Sierra Leone | $179M |
| 138 | Guinea-Bissau | $178M |
| 139 | Trinidad and Tobago | $172M |
| 140 | Mauritania | $168M |
| 141 | Iceland | $164M |
| 142 | Eswatini | $148M |
| 143 | Belize | $142M |
| 144 | Curacao | $131M |
| 145 | Uruguay | $127M |
| 146 | Chile | $78M |
| 147 | Vanuatu | $75M |
| 148 | St. Vincent and the Grenadines | $70M |
| 149 | Grenada | $69M |
| 150 | Botswana | $56M |
| 151 | St. Lucia | $55M |
| 152 | Bhutan | $55M |
| 153 | Djibouti | $55M |
| 154 | Dominica | $52M |
| 155 | Burundi | $50M |
| 156 | Aruba | $44M |
| 157 | Namibia | $44M |
| 158 | Guinea | $41M |
| 159 | Solomon Islands | $40M |
| 160 | Oman | $39M |
| 161 | Antigua and Barbuda | $35M |
| 162 | St. Kitts and Nevis | $33M |
| 163 | Marshall Islands | $30M |
| 164 | Kuwait | $27M |
| 165 | New Zealand | $25M |
| 166 | Macao SAR, China | $17M |
| 167 | Angola | $16M |
| 168 | Kiribati | $15M |
| 169 | Cayman Islands | $14M |
| 170 | Sao Tome and Principe | $10M |
| 171 | Seychelles | $9M |
| 172 | Maldives | $5M |
| 173 | Gabon | $4M |
| 174 | Palau | $2M |
| 175 | Papua New Guinea | $2M |
| 176 | Turkmenistan | $1M |
| Total | World | $794,059M |
With an estimated $100 billion in remittances received, India is said to have reached an all-time high in 2022.
This increasing flow of remittances can be partially attributed to migrant Indians switching to high-skilled jobs in high-income countries—including the U.S., the UK, and Singapore—from low-skilled and low-paying jobs in Gulf countries.
Mexico and China round out the top three remittance-receiving nations, with estimated inbound transfers of $60 billion and $51 billion respectively in 2022.
Impact on National GDP
While India tops the list of countries benefitting from remittances, its $100 billion received amounts to only 2.9% of its 2022 GDP.
Meanwhile, low and middle-income countries around the world heavily rely on this source of income to boost their economies in a more substantive way. In 2022, for example, remittances accounted for over 15% of the GDP of 25 countries.
| Rank | Remittance Inflows by Country | % of GDP (2022) |
|---|---|---|
| 1 | Tonga | 49.9% |
| 2 | Lebanon | 37.8% |
| 3 | Samoa | 33.7% |
| 4 | Tajikistan | 32.0% |
| 5 | Kyrgyz Republic | 31.2% |
| 6 | Gambia, The | 28.3% |
| 7 | Honduras | 27.1% |
| 8 | South Sudan | 24.8% |
| 9 | El Salvador | 23.8% |
| 10 | Haiti | 22.4% |
| 11 | Nepal | 21.7% |
| 12 | Jamaica | 21.2% |
| 13 | Lesotho | 21.0% |
| 14 | Somalia | 20.6% |
| 15 | Comoros | 20.1% |
| 16 | Nicaragua | 19.9% |
| 17 | Guatemala | 19.8% |
| 18 | Armenia | 18.9% |
| 19 | West Bank and Gaza | 18.5% |
| 20 | Cabo Verde | 18.2% |
| 21 | Kosovo | 17.3% |
| 22 | Uzbekistan | 17.0% |
| 23 | Georgia | 16.2% |
| 24 | Moldova | 15.4% |
| 25 | Montenegro | 15.0% |
| 26 | Ukraine | 13.8% |
| 27 | Marshall Islands | 11.0% |
| 28 | Guinea-Bissau | 10.9% |
| 29 | Bosnia and Herzegovina | 10.1% |
| 30 | Albania | 9.8% |
| 31 | Senegal | 9.8% |
| 32 | Jordan | 9.6% |
| 33 | Philippines | 9.4% |
| 34 | Fiji | 9.2% |
| 35 | Liberia | 9.0% |
| 36 | Dominican Republic | 8.8% |
| 37 | Dominica | 8.6% |
| 38 | Serbia | 8.6% |
| 39 | Togo | 7.9% |
| 40 | Morocco | 7.9% |
| 41 | Pakistan | 7.7% |
| 42 | Vanuatu | 7.6% |
| 43 | Timor-Leste | 7.5% |
| 44 | Suriname | 7.3% |
| 45 | St. Vincent and the Grenadines | 7.3% |
| 46 | Kiribati | 7.2% |
| 47 | Egypt, Arab Rep. | 6.8% |
| 48 | Ghana | 6.1% |
| 49 | Mali | 5.9% |
| 50 | Grenada | 5.8% |
| 51 | Zimbabwe | 5.3% |
| 52 | Croatia | 5.3% |
| 53 | Belize | 5.3% |
| 54 | Sri Lanka | 4.8% |
| 55 | Madagascar | 4.7% |
| 56 | Vietnam | 4.5% |
| 57 | Bangladesh | 4.5% |
| 58 | Tunisia | 4.5% |
| 59 | Cambodia | 4.4% |
| 60 | Sierra Leone | 4.3% |
| 61 | Mexico | 4.2% |
| 62 | Nigeria | 4.1% |
| 63 | Rwanda | 3.8% |
| 64 | Ecuador | 3.8% |
| 65 | Latvia | 3.6% |
| 66 | Romania | 3.6% |
| 67 | Niger | 3.6% |
| 68 | Kenya | 3.5% |
| 69 | Bolivia | 3.2% |
| 70 | Burkina Faso | 3.2% |
| 71 | Myanmar | 3.1% |
| 72 | North Macedonia | 3.1% |
| 73 | Mongolia | 3.1% |
| 74 | Eswatini | 3.1% |
| 75 | Azerbaijan | 3.0% |
| 76 | Mozambique | 3.0% |
| 77 | St. Kitts and Nevis | 2.9% |
| 78 | India | 2.8% |
| 79 | St. Lucia | 2.7% |
| 80 | Guyana | 2.6% |
| 81 | Colombia | 2.6% |
| 82 | Congo, Dem. Rep. | 2.6% |
| 83 | Solomon Islands | 2.4% |
| 84 | Luxembourg | 2.4% |
| 85 | Mauritius | 2.4% |
| 86 | Sudan | 2.3% |
| 87 | Uganda | 2.3% |
| 88 | Malawi | 2.3% |
| 89 | Belgium | 2.2% |
| 90 | Sao Tome and Principe | 2.0% |
| 91 | Afghanistan | 2.0% |
| 92 | Slovak Republic | 2.0% |
| 93 | Antigua and Barbuda | 2.0% |
| 94 | Bhutan | 2.0% |
| 95 | Cyprus | 1.9% |
| 96 | Portugal | 1.8% |
| 97 | Thailand | 1.7% |
| 98 | Belarus | 1.6% |
| 99 | Mauritania | 1.6% |
| 100 | Estonia | 1.6% |
| 101 | Malta | 1.5% |
| 102 | Peru | 1.5% |
| 103 | Czech Republic | 1.5% |
| 104 | Djibouti | 1.4% |
| 105 | Burundi | 1.3% |
| 106 | Paraguay | 1.3% |
| 107 | Hungary | 1.3% |
| 108 | Slovenia | 1.2% |
| 109 | Aruba | 1.2% |
| 110 | Lao PDR | 1.2% |
| 111 | Benin | 1.1% |
| 112 | Israel | 1.1% |
| 113 | Poland | 1.1% |
| 114 | Lithuania | 1.0% |
| 115 | France | 1.0% |
| 116 | Bulgaria | 0.9% |
| 117 | Algeria | 0.9% |
| 118 | Zambia | 0.9% |
| 119 | Costa Rica | 0.9% |
| 120 | Palau | 0.8% |
| 121 | Panama | 0.8% |
| 122 | Cameroon | 0.8% |
| 123 | Tanzania | 0.7% |
| 124 | Indonesia | 0.7% |
| 125 | Spain | 0.6% |
| 126 | Iceland | 0.5% |
| 127 | Trinidad and Tobago | 0.5% |
| 128 | Austria | 0.5% |
| 129 | Cote d'Ivoire | 0.5% |
| 130 | Seychelles | 0.4% |
| 131 | Korea, Rep. | 0.4% |
| 132 | Italy | 0.4% |
| 133 | Germany | 0.4% |
| 134 | Sweden | 0.4% |
| 135 | Denmark | 0.3% |
| 136 | Malaysia | 0.3% |
| 137 | Namibia | 0.3% |
| 138 | Switzerland | 0.3% |
| 139 | Finland | 0.3% |
| 140 | Botswana | 0.3% |
| 141 | Greece | 0.2% |
| 142 | Ethiopia | 0.2% |
| 143 | Qatar | 0.2% |
| 144 | Russian Federation | 0.2% |
| 145 | Brazil | 0.2% |
| 146 | China | 0.2% |
| 147 | South Africa | 0.2% |
| 148 | Iraq | 0.2% |
| 149 | Guinea | 0.2% |
| 150 | Netherlands | 0.2% |
| 151 | Uruguay | 0.1% |
| 152 | Kazakhstan | 0.1% |
| 153 | Hong Kong SAR, China | 0.1% |
| 154 | Argentina | 0.1% |
| 155 | Norway | 0.1% |
| 156 | Japan | 0.1% |
| 157 | Maldives | 0.08% |
| 158 | Turkey | 0.08% |
| 159 | United Kingdom | 0.07% |
| 160 | Macao SAR, China | 0.07% |
| 161 | Ireland | 0.05% |
| 162 | Australia | 0.04% |
| 163 | Oman | 0.04% |
| 164 | Saudi Arabia | 0.03% |
| 165 | Chile | 0.02% |
| 166 | United States | 0.02% |
| 167 | Gabon | 0.02% |
| 168 | Kuwait | 0.01% |
| 169 | Angola | 0.01% |
| 170 | New Zealand | 0.01% |
| 171 | Papua New Guinea | 0.01% |
| 172 | Turkmenistan | 0.001% |
Known primarily as a tourist destination, the Polynesian country of Tonga banks on remittance inflows to support its economy. In 2022, the country’s incoming remittance flows were equal to almost 50% of its GDP.
Next on this list is Lebanon. The country received $6.8 billion in remittances in 2022, estimated to equal almost 38% of its GDP and making it a key support to the nation’s shrinking economy.

This article was published as a part of Visual Capitalist's Creator Program, which features data-driven visuals from some of our favorite Creators around the world.


Markets
Visualizing U.S. GDP by Industry in 2023
Services-producing industries account for the majority of U.S. GDP in 2023, followed by other private industries and the government.
Visualizing U.S. GDP by Industry
The U.S. economy is like a giant machine driven by many different industries, each one akin to an essential cog that moves the whole.
Understanding the breakdown of national gross domestic product (GDP) by industry shows where commercial activity is bustling and how diverse the economy truly is.
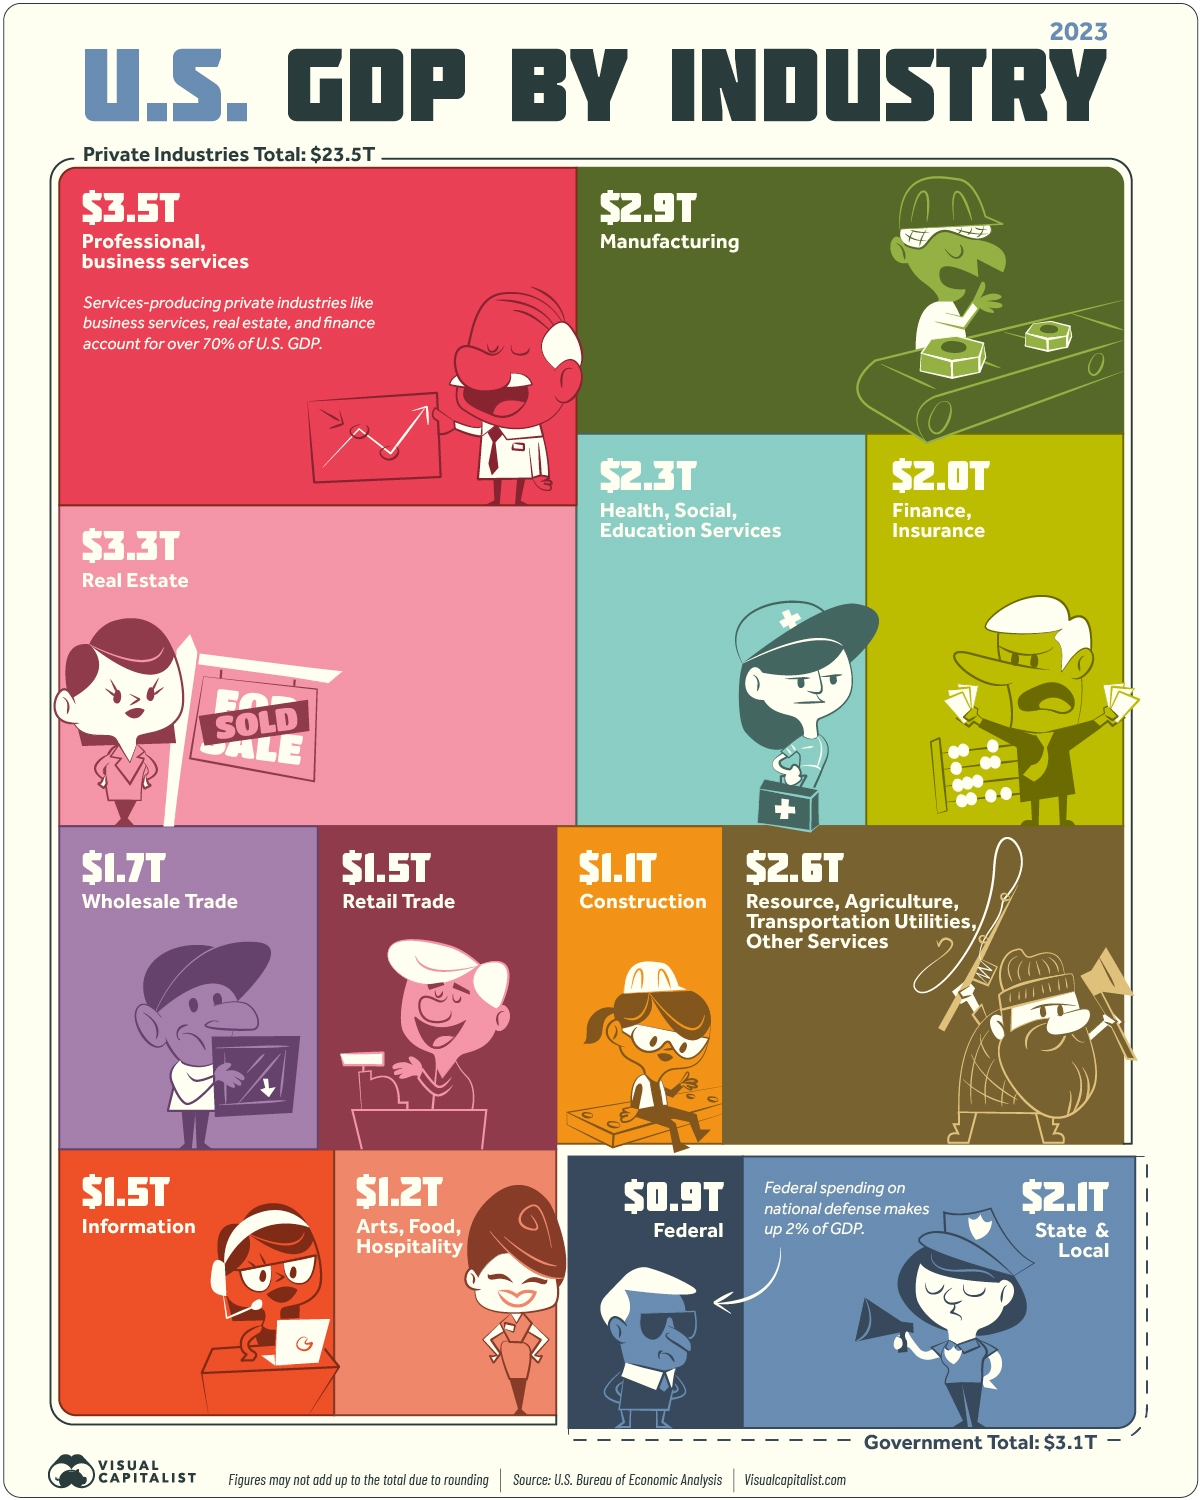
The above infographic uses data from the Bureau of Economic Analysis to visualize a breakdown of U.S. GDP by industry in 2023. To show this, we use value added by industry, which reflects the difference between gross output and the cost of intermediate inputs.
The Top 10 U.S. Industries by GDP
As of Q1 2023, the annualized GDP of the U.S. sits at $26.5 trillion.
Of this, 88% or $23.5 trillion comes from private industries. The remaining $3 trillion is government spending at the federal, state, and local levels.
Here’s a look at the largest private industries by economic contribution in the United States:
| Industry | Annualized Nominal GDP (as of Q1 2023) | % of U.S. GDP |
|---|---|---|
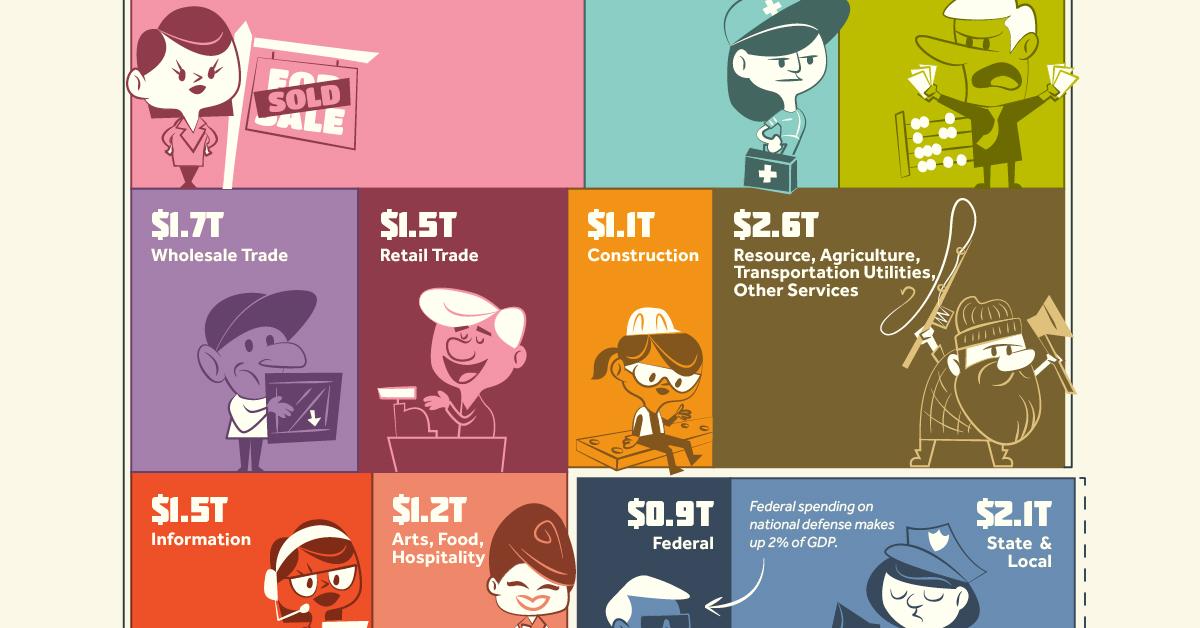
| Professional and business services | $3.5T | 13% |
| Real estate, rental, and leasing | $3.3T | 12% |
| Manufacturing | $2.9T | 11% |
| Educational services, health care, and social assistance | $2.3T | 9% |
| Finance and insurance | $2.0T | 8% |
| Wholesale trade | $1.7T | 6% |
| Retail trade | $1.5T | 6% |
| Information | $1.5T | 6% |
| Arts, entertainment, recreation, accommodation, and food services | $1.2T | 4% |
| Construction | $1.1T | 4% |
| Other private industries | $2.6T | 10% |
| Total | $23.5T | 88% |
Like most other developed nations, the U.S. economy is largely based on services.
Service-based industries, including professional and business services, real estate, finance, and health care, make up the bulk (70%) of U.S. GDP. In comparison, goods-producing industries like agriculture, manufacturing, mining, and construction play a smaller role.
Professional and business services is the largest industry with $3.5 trillion in value added. It comprises establishments providing legal, consulting, design, administration, and other services. This is followed by real estate at $3.3 trillion, which has consistently been an integral part of the economy.
Due to outsourcing and other factors, the manufacturing industry’s share of GDP has been declining for decades, but it still remains a significant part of the economy. Manufacturing of durable goods (metals, machines, computers) accounts for $1.6 trillion in value added, alongside nondurable goods (food, petroleum, chemicals) at $1.3 trillion.
The Government’s Contribution to GDP
Just like private industries, the government’s value added to GDP consists of compensation of employees, taxes collected (less subsidies), and gross operating surplus.
| Government | Annualized Nominal GDP (as of Q1 2023) | % of U.S. GDP |
|---|---|---|
| State and Local | $2.1T | 8% |
| Federal | $0.9T | 4% |
| Total | $3.1T | 12% |
Figures may not add up to the total due to rounding.
State and local government spending, largely focused on the education and public welfare sectors, accounts for the bulk of value added. The Federal contribution to GDP amounts to roughly $948 billion, with 52% of it attributed to national defense.
The Fastest Growing Industries (2022–2032P)
In the next 10 years, services-producing industries are projected to see the fastest growth in output.
The table below shows the five fastest-growing industries in the U.S. from 2022–2032 in terms of total output, based on data from the Bureau of Labor Statistics:
| Industry | Sector | Compound Annual Rate of Output Growth (2022–2032P) |
|---|---|---|
| Software publishers | Information | 5.2% |
| Computing infrastructure providers, data processing, and related services | Information | 3.9% |
| Wireless telecommunications carriers (except satellite) | Information | 3.6% |
| Home health care services | Health care and social assistance | 3.6% |
| Oil and gas extraction | Mining | 3.5% |
Three of the fastest-growing industries are in the information sector, underscoring the growing role of technology and digital infrastructure. Meanwhile, the projected growth of the oil and gas extraction industry highlights the enduring demand for traditional energy sources, despite the energy transition.
Overall, the development of these industries suggests that the U.S. will continue its shift toward a services-oriented economy. But today, it’s also worth noticing how services- and goods-producing industries are increasingly tied together. For example, it’s now common for tech companies to produce devices, and for manufacturers to use software in their operations.
Therefore, the oncoming tide of growth in service-based industries could potentially lift other interconnected sectors of the diverse U.S. economy.

-

 Real Estate2 weeks ago
Visualizing America’s Shortage of Affordable Homes
-

 Technology1 week ago
Ranked: Semiconductor Companies by Industry Revenue Share
-

 Money1 week ago
Which States Have the Highest Minimum Wage in America?
-

 Real Estate1 week ago
Ranked: The Most Valuable Housing Markets in America
-

 Business2 weeks ago
Charted: Big Four Market Share by S&P 500 Audits
-

 AI2 weeks ago
The Stock Performance of U.S. Chipmakers So Far in 2024
-

 Misc2 weeks ago
Almost Every EV Stock is Down After Q1 2024
-

 Money2 weeks ago
Where Does One U.S. Tax Dollar Go?