Technology
Netflix vs Disney: Who’s Winning the Streaming War?
Article/Editing:
Netflix vs Disney: Who’s Winning the Streaming War?
Netflix is well-known as one of the pioneers of mass-market video streaming. The service has become so ubiquitous that the word “Netflix” is now synonymous with watching a movie or television show.
But, while it’s one of the most recognized streaming platforms in the world, has it been able to maintain its dominant position in the industry now that more competitors have entered the fray?
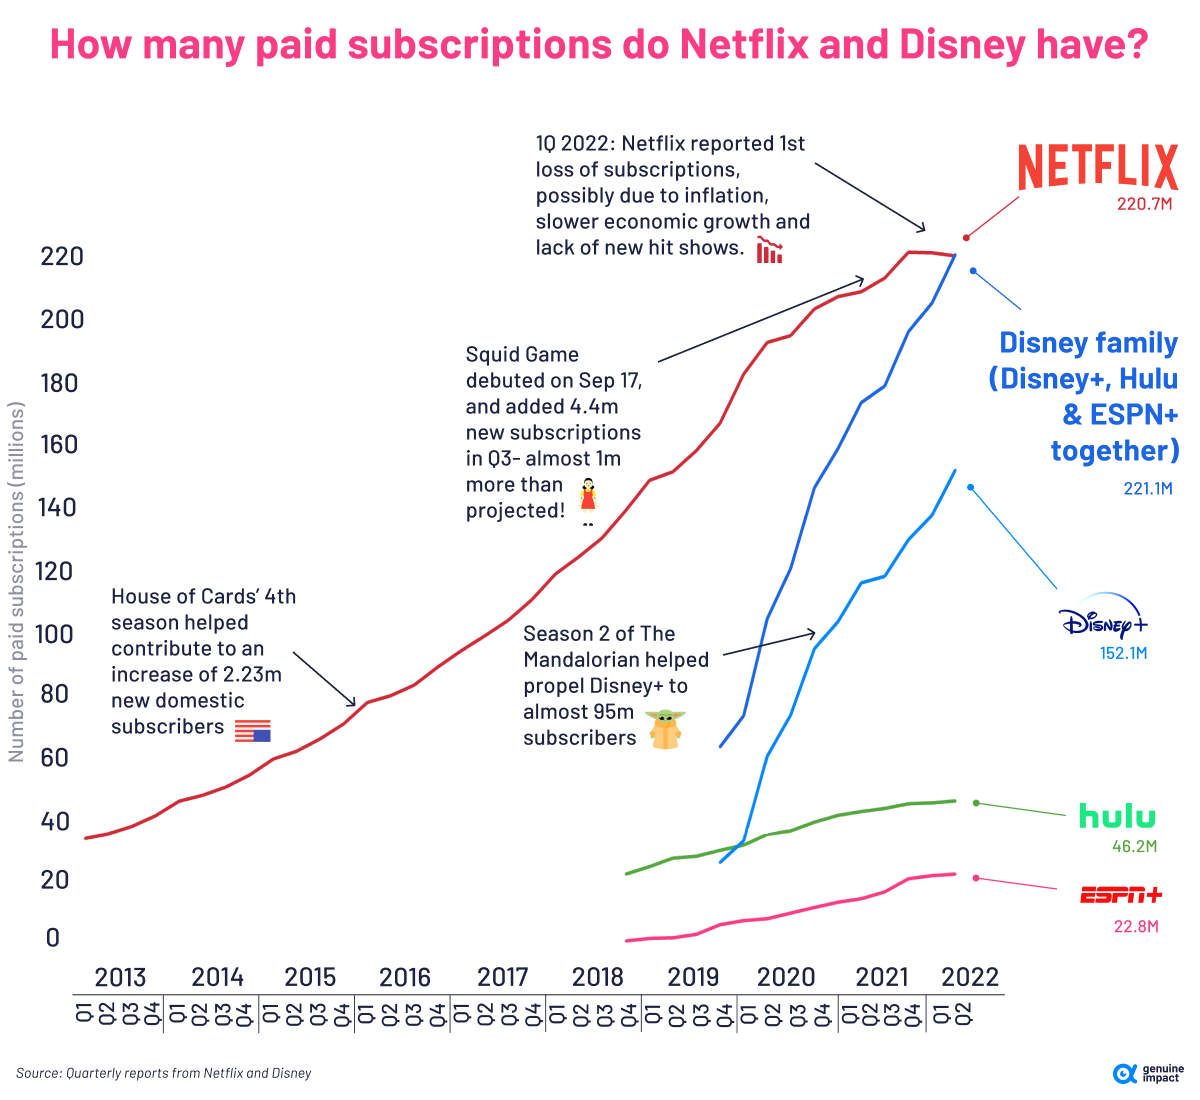
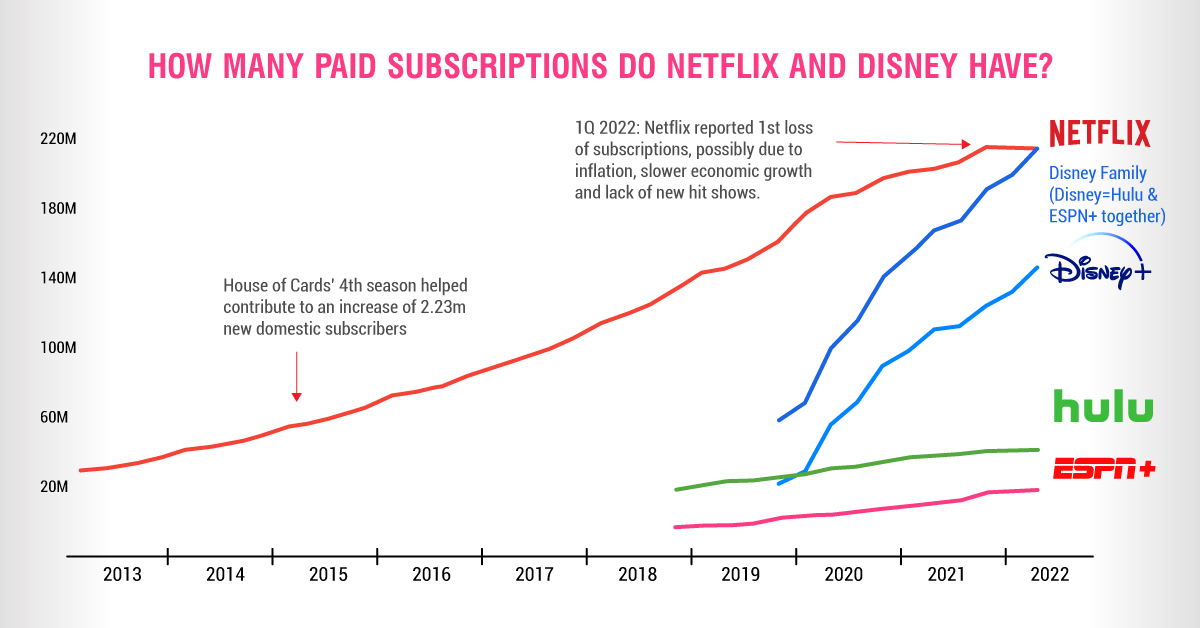
This graphic by Truman Du shows how Disney’s streaming empire (Disney+, Hulu, and ESPN+) has quickly gained subscribers and is giving Netflix a run for its money.
Netflix: The Beginning
Founded in 1997, Netflix started out as mail-order DVD rental company. One of the co-founders Reed Hastings told Fortune Magazine that he got the idea for Netflix after he was charged a $40 late fee for a VHS he’d rented out.
By 2007, Netflix had evolved from a relatively modest DVD rental company into a ground-breaking subscription-based streaming service. While there were a few other streaming platforms at the time, Netflix had a significant first mover’s advantage, operating on a subscription model and acquiring a wide pool of distribution rights from different studios.
This allowed the company to grow rapidly and establish itself as an industry leader. From 2007 to 2022, Netflix’s subscriber base grew from 7 million to 221 million, nearly 3,000%.
When Did Disney Enter the Scene?
The Walt Disney Company got involved in the streaming industry in 2009 when it first joined Hulu as a minor stakeholder, but became more directly invested in 2016 when it bought a 33% stake in BAMTECH Media, a video streaming technology company.
Disney eventually bought a majority stake in BAMTECH Media and in 2018, the company rebranded to Disney Streaming Services. In addition to launching Disney+ and ESPN+, Disney’s acquisition of 21 Century Fox gave the company a majority stake in other streaming platforms including Hulu and Star+.
While Disney arrived much later on the scene compared to Netflix, it didn’t take long for Disney’s platforms to gain traction. And as of Q2 2022, Disney’s streaming empire (Disney+, Hulu, and ESPN+) has more combined subscribers than Netflix, and are gaining at a rapid pace.
Netflix
| Platform | Subscribers (Q2 2022) | % Growth (y-o-y) |
|---|---|---|
| Netflix | 220.7 million | 5.5% |
| Netflix Total | 220.7 million | 5.5% |
Disney
| Platform | Subscribers (Q2 2022) | % Growth (y-o-y) |
|---|---|---|
| Disney+ | 152.1 million | 31.1% |
| Hulu | 46.2 million | 7.9% |
| ESPN | 22.8 million | 53.0% |
| Disney Total | 221.1 million | 27.3% |
Other streaming services like HBO Max and Amazon Prime Video also continue to pick up steam, which begs the question: has the Netflix empire started to tumble?
Recent Trouble With Netflix
In April 2022, Netflix shared its Q1 results which showed a loss of 200,000 subscribers. Though barely a fraction of its 200+ million subscribers, it was Netflix’s first drop in subscribers in over 10 years.
This sent the company’s share price plummeting below $200, the lowest since 2017. As October 10, 2022, its share price still sits at $230, over 30% down from before the Q1 announcement in April 2022.
But change for the company is on the horizon. Netflix has announced that it plans to launch a cheaper, ad-supported service in November—something that other streaming platforms like Peacock and Paramount+ have already been offering customers for a few years.

This article was published as a part of Visual Capitalist's Creator Program, which features data-driven visuals from some of our favorite Creators around the world.


Technology
Ranked: Semiconductor Companies by Industry Revenue Share
Nvidia is coming for Intel’s crown. Samsung is losing ground. AI is transforming the space. We break down revenue for semiconductor companies.


Semiconductor Companies by Industry Revenue Share
This was originally posted on our Voronoi app. Download the app for free on Apple or Android and discover incredible data-driven charts from a variety of trusted sources.
Did you know that some computer chips are now retailing for the price of a new BMW?
As computers invade nearly every sphere of life, so too have the chips that power them, raising the revenues of the businesses dedicated to designing them.
But how did various chipmakers measure against each other last year?
We rank the biggest semiconductor companies by their percentage share of the industry’s revenues in 2023, using data from Omdia research.
Which Chip Company Made the Most Money in 2023?
Market leader and industry-defining veteran Intel still holds the crown for the most revenue in the sector, crossing $50 billion in 2023, or 10% of the broader industry’s topline.
All is not well at Intel, however, with the company’s stock price down over 20% year-to-date after it revealed billion-dollar losses in its foundry business.
| Rank | Company | 2023 Revenue | % of Industry Revenue |
|---|---|---|---|
| 1 | Intel | $51B | 9.4% |
| 2 | NVIDIA | $49B | 9.0% |
| 3 | Samsung Electronics | $44B | 8.1% |
| 4 | Qualcomm | $31B | 5.7% |
| 5 | Broadcom | $28B | 5.2% |
| 6 | SK Hynix | $24B | 4.4% |
| 7 | AMD | $22B | 4.1% |
| 8 | Apple | $19B | 3.4% |
| 9 | Infineon Tech | $17B | 3.2% |
| 10 | STMicroelectronics | $17B | 3.2% |
| 11 | Texas Instruments | $17B | 3.1% |
| 12 | Micron Technology | $16B | 2.9% |
| 13 | MediaTek | $14B | 2.6% |
| 14 | NXP | $13B | 2.4% |
| 15 | Analog Devices | $12B | 2.2% |
| 16 | Renesas Electronics Corporation | $11B | 1.9% |
| 17 | Sony Semiconductor Solutions Corporation | $10B | 1.9% |
| 18 | Microchip Technology | $8B | 1.5% |
| 19 | Onsemi | $8B | 1.4% |
| 20 | KIOXIA Corporation | $7B | 1.3% |
| N/A | Others | $126B | 23.2% |
| N/A | Total | $545B | 100% |
Note: Figures are rounded. Totals and percentages may not sum to 100.
Meanwhile, Nvidia is very close to overtaking Intel, after declaring $49 billion of topline revenue for 2023. This is more than double its 2022 revenue ($21 billion), increasing its share of industry revenues to 9%.
Nvidia’s meteoric rise has gotten a huge thumbs-up from investors. It became a trillion dollar stock last year, and broke the single-day gain record for market capitalization this year.
Other chipmakers haven’t been as successful. Out of the top 20 semiconductor companies by revenue, 12 did not match their 2022 revenues, including big names like Intel, Samsung, and AMD.
The Many Different Types of Chipmakers
All of these companies may belong to the same industry, but they don’t focus on the same niche.
According to Investopedia, there are four major types of chips, depending on their functionality: microprocessors, memory chips, standard chips, and complex systems on a chip.
Nvidia’s core business was once GPUs for computers (graphics processing units), but in recent years this has drastically shifted towards microprocessors for analytics and AI.
These specialized chips seem to be where the majority of growth is occurring within the sector. For example, companies that are largely in the memory segment—Samsung, SK Hynix, and Micron Technology—saw peak revenues in the mid-2010s.

-

 Maps2 weeks ago
Mapped: Average Wages Across Europe
-

 Money1 week ago
Which States Have the Highest Minimum Wage in America?
-

 Real Estate1 week ago
Ranked: The Most Valuable Housing Markets in America
-

 Markets1 week ago
Charted: Big Four Market Share by S&P 500 Audits
-

 AI1 week ago
The Stock Performance of U.S. Chipmakers So Far in 2024
-

 Automotive2 weeks ago
Almost Every EV Stock is Down After Q1 2024
-

 Money2 weeks ago
Where Does One U.S. Tax Dollar Go?
-

 Green2 weeks ago
Ranked: Top Countries by Total Forest Loss Since 2001