Green
Mapping the World’s Forests: How Green is Our Globe?
Article/Editing:
Click to view this graphic in a higher-resolution.
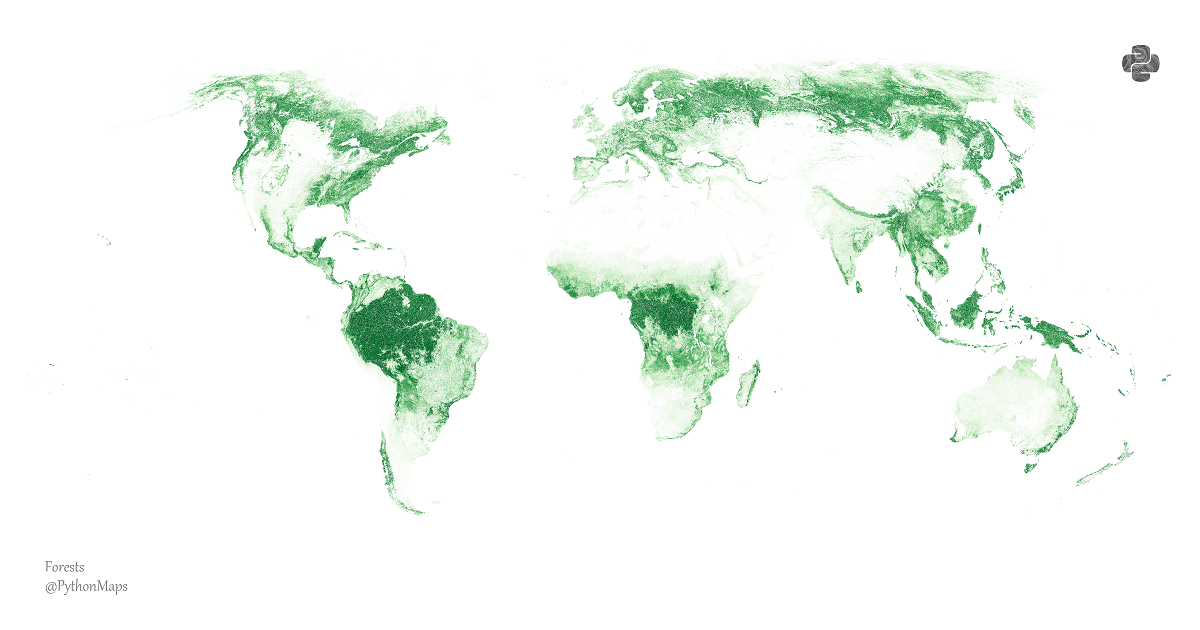
Mapping the World’s Forests: How Green is our Globe?
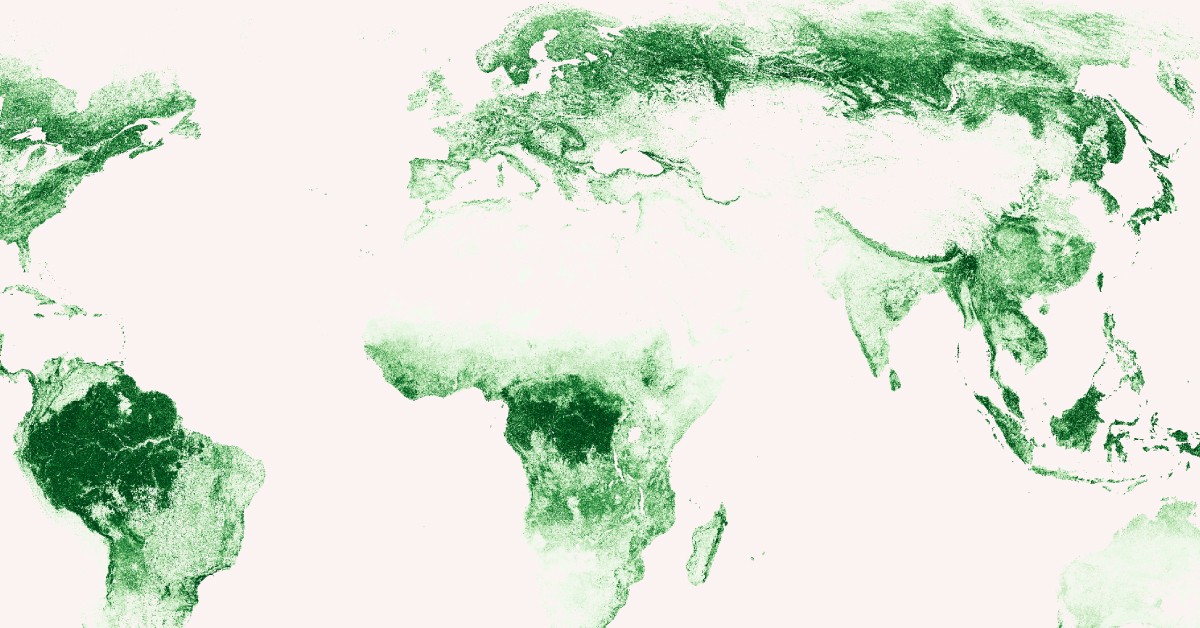
According to the United Nations (UN), forests cover 31% of the world’s land surface. They absorb roughly 15.6 billion tonnes of carbon dioxide (CO₂) every year.
More than half of this green cover is spread across the boreal forests of Russia and Canada, the Amazon in South America, and China’s coniferous and broad-leaved forests. These carbon-sequestering forests purify the air, filter water, prevent soil erosion, and act as an important buffer against climate change.
| Rank | Country | Forest Cover (in millions of hectares) |
|---|---|---|
| #1 | 🇷🇺 Russia | 815 |
| #2 | 🇧🇷 Brazil | 497 |
| #3 | 🇨🇦 Canada | 347 |
| #4 | 🇺🇸 United States | 310 |
| #5 | 🇨🇳 China | 220 |
| #6 | 🇦🇺 Australia | 134 |
| #7 | 🇨🇩 Democratic Republic of the Congo | 126 |
| #8 | 🇮🇩 Indonesia | 92 |
| #9 | 🇵🇪 Peru | 72 |
| #10 | 🇮🇳 India | 72 |
This series of maps by Adam Symington uses data sourced from images collected aboard the MODIS sensor on the Terra satellite to reflect the ratio of the world’s surface covered with tree canopy to non-green areas.
To explore the entire high resolution forest map, click the image above. Below we’ll take a closer look at some of the world’s green zones.
Asia
Home to the boreal forests of Russia, China’s broad-leaved forests, the mangrove forests of Indonesia, and the green belt along the mighty Himalayas, Asia boasts some of the richest and most biodiverse green canopies of the world.
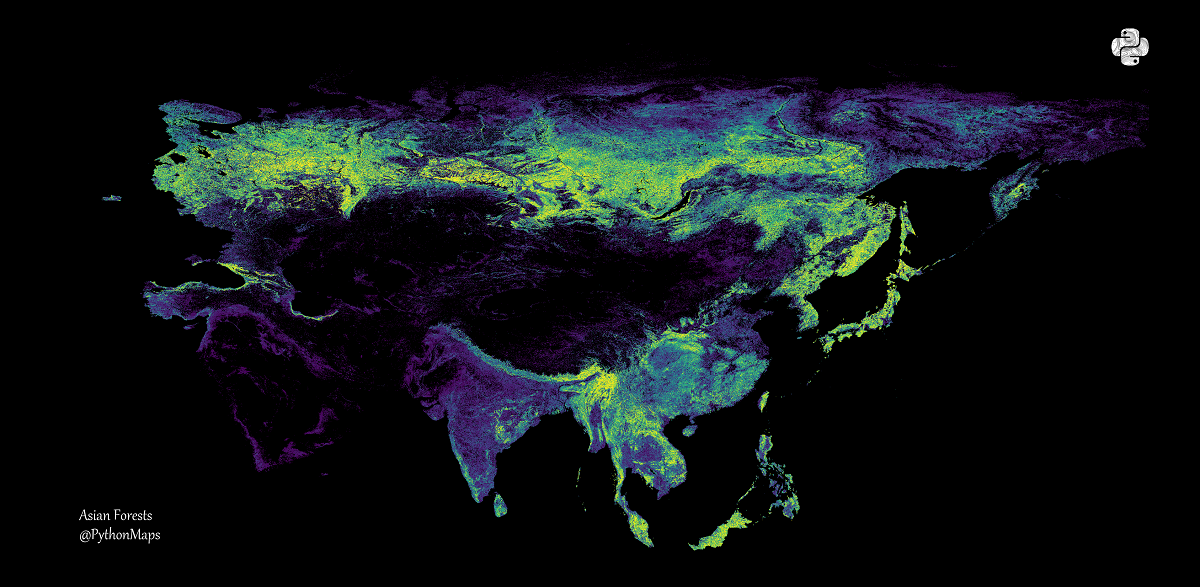
Russia holds more than one-fifth of the world’s trees across 815 million hectares—larger than the Amazon’s canopy. Like the country’s geography, most of Russia’s forests are situated in Asia, but spread into Europe as well.
To the southeast and with a forest cover of almost 220 million hectares, China is the fifth greenest country in the world. However, this was not always the case.
In 1990, China’s forests stretched across only 157 million hectares, covering 16.7% of its land. By the end of 2020, this forest cover reached 23.4%, thanks to decades of greening efforts.
On the other hand, the continent’s third most biodiverse country—Indonesia—is losing its green canopy. With a 92 million hectare-wide forest canopy, the country is home to between 10 and 15% of the world’s known plants, mammals, and birds. Unfortunately, over the past 50 years, 74 million hectares of the country’s rainforest have been logged, burned, or degraded.
Meanwhile, the 72 million hectares of Indian forest cover can be followed closely with the eye. From the rainforests along the Himalayas in the northeast, to montane rainforests of the South Western Ghats, and finally to the coastal mangrove forests.
The Amazon and Congolian Rainforests
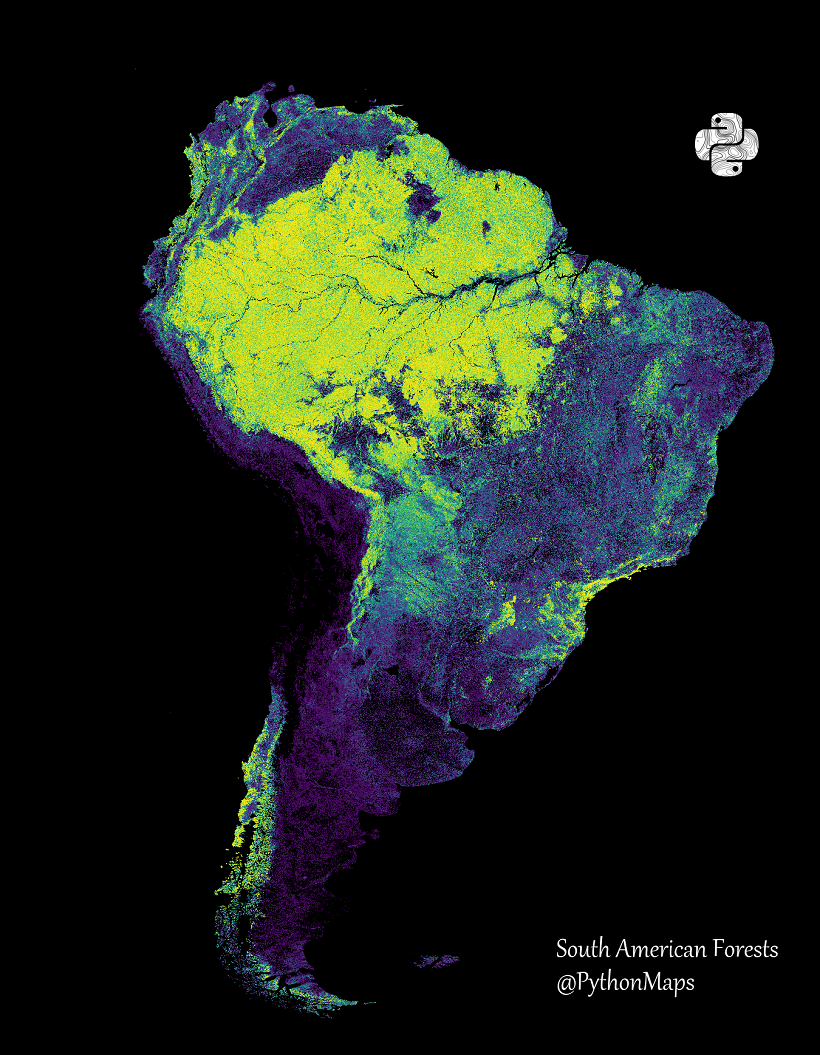 In South America, Brazil has the second-largest green cover in the world.
Most of its 497 million hectare-wide forest cover falls within “the lungs of the planet”—the Amazon rainforest.
One of the most biodiverse places on the planet, the Amazon rainforest is said to house about 10% of the world’s biodiversity, including over three million wildlife species and over 2,500 tree species.
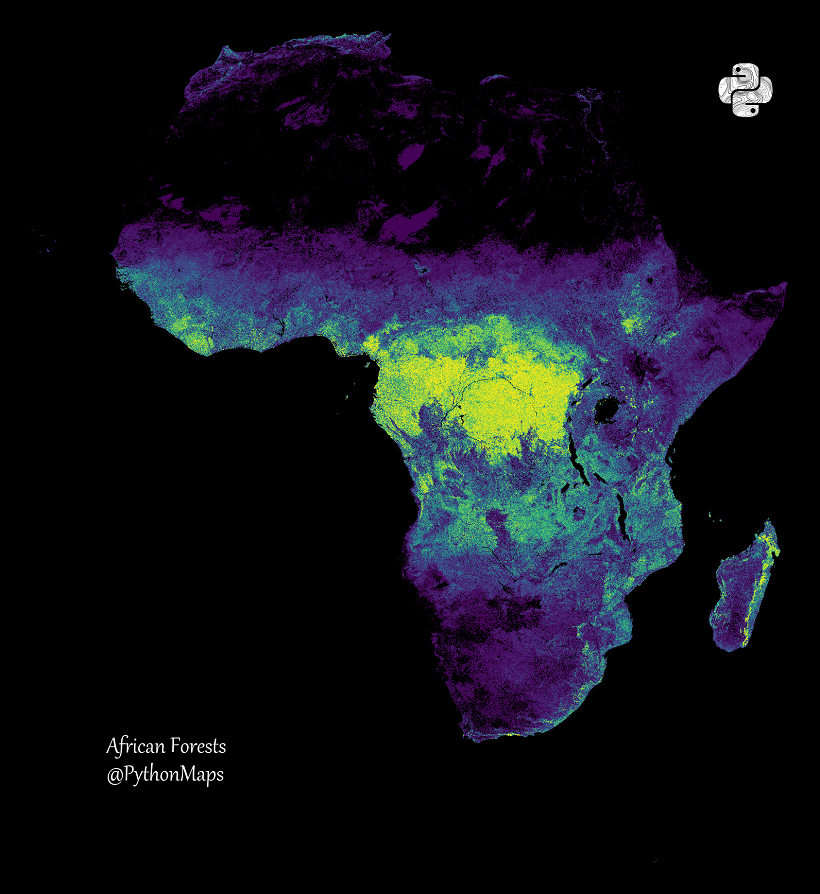 On the other side of the Atlantic, extending along the Congo River basin and its many tributaries, are the Congolian rainforests.
Spread across nine countries in Central Africa, this collection of tropical moist broadleaf forests is one of the remaining regions in the world that absorbs more carbon than it emits.
With 126 million hectares of the world’s green cover, the Democratic Republic of Congo (DRC) contains the largest part of this rainforest, equal to about 60% of Central Africa’s lowland forest cover.
North American Forests
Canada, the United States, and Mexico combine for 723 million hectares of the world’s forests. The vast stretches of pine and fir trees in the Great White North, coupled with the United States’ mixed variety of forests, make the continent one of the largest carbon sinks in the world.
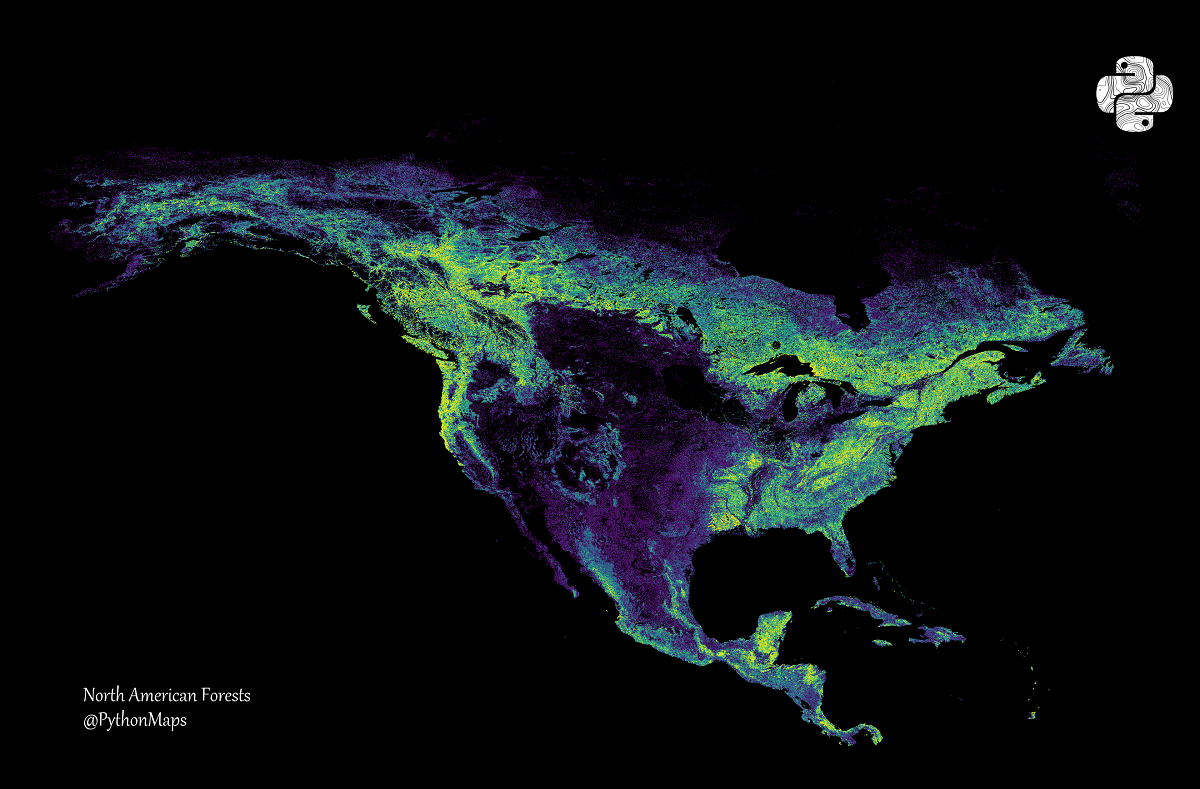
With over 347 million hectares of forests, Canada ranks third in the list of greenest countries. Approximately 40% of its landmass is tree-covered, representing 9% of the global forest cover.
Its boreal forests store twice as much carbon per unit as tropical forests and help regulate the global carbon footprint.
The United States, on the other hand, holds about 8% of the world’s forests. Spread across 310 million hectares of land, these diverse forests range from the boreal forests of Alaska to pine plantations in the South, and the deciduous forests in the Eastern United States to the dry coniferous forests in the West. The country is also home to temperate rainforests along its West Coast and tropical rainforests in Puerto Rico and Hawaii.
The World’s Lost Forests
While China and a few select countries have proven that there is hope for building out the world’s forests, the story is different in other places around the world. This map by Adam Symington uses data from the University of Maryland to track the changes in the world’s forest cover from 2000 to 2021.
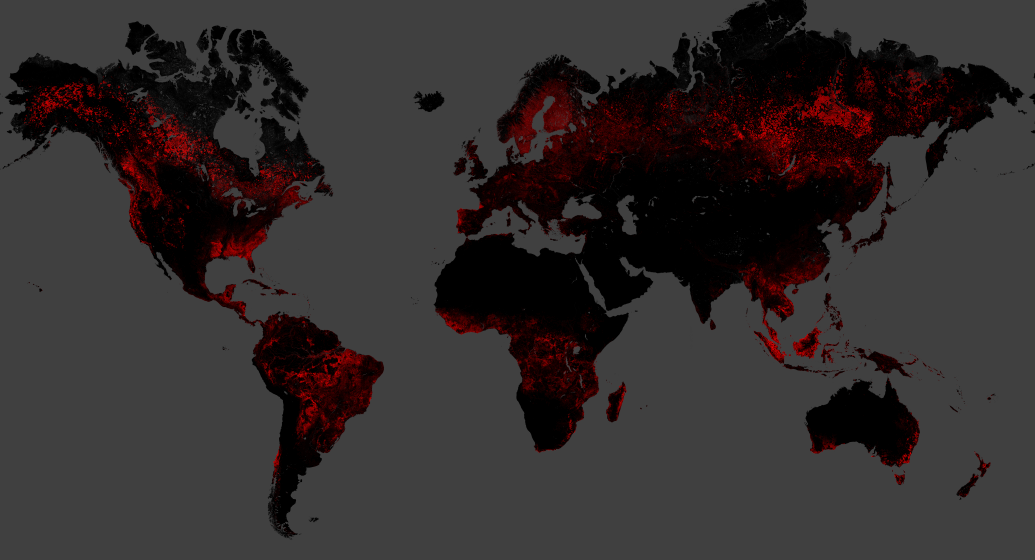
Since 2000, the world lost over 104 million hectares of pristine and intact forest landscapes. In 2020 alone, over 10 thousand square kilometers of the Amazon were destroyed for the development of roads.
Deforestation and fragmentation are caused by a range of human development activities. But they are also exacerbated by climate change, with increasing forest fires, hurricanes, droughts, and other extreme weather events, as well as invasive species and insect outbreaks upsetting forest ecosystems.
At the 2022 UN Biodiversity Conference (COP15) held in Montréal, nations across the world committed to the 30X30 plan, which called for the conservation of the world’s land and marine ecosystems by 2030. Alongside other commitments to end deforestation and grow the world’s canopies, there is still hope for the world’s forests.

This article was published as a part of Visual Capitalist's Creator Program, which features data-driven visuals from some of our favorite Creators around the world.


Green
Ranking the Top 15 Countries by Carbon Tax Revenue
This graphic highlights France and Canada as the global leaders when it comes to generating carbon tax revenue.


Top 15 Countries by Carbon Tax Revenue
This was originally posted on our Voronoi app. Download the app for free on iOS or Android and discover incredible data-driven charts from a variety of trusted sources.
Carbon taxes are designed to discourage CO2 emissions by increasing the cost of carbon-intensive activities and incentivizing the adoption of cleaner energy alternatives.
In this graphic we list the top 15 countries by carbon tax revenue as of 2022. The data is from the World Bank’s State and Trends of Carbon Pricing Report, published in April 2023.
France and Canada Lead in Global Carbon Tax Revenue
In 2022, the top 15 countries generated approximately $30 billion in revenue from carbon taxes.
France and Canada lead in this regard, accounting for over half of the total amount. Both countries have implemented comprehensive carbon pricing systems that cover a wide range of sectors, including transportation and industry, and they have set relatively high carbon tax rates.
| Country | Government revenue in 2022 ($ billions) |
|---|---|
| 🇫🇷 France | $8.9 |
| 🇨🇦 Canada | $7.8 |
| 🇸🇪 Sweden | $2.3 |
| 🇳🇴 Norway | $2.1 |
| 🇯🇵 Japan | $1.8 |
| 🇫🇮 Finland | $1.7 |
| 🇨🇭 Switzerland | $1.6 |
| 🇬🇧 United Kingdom | $0.9 |
| 🇮🇪 Ireland | $0.7 |
| 🇩🇰 Denmark | $0.5 |
| 🇵🇹 Portugal | $0.5 |
| 🇦🇷 Argentina | $0.3 |
| 🇲🇽 Mexico | $0.2 |
| 🇸🇬 Singapore | $0.1 |
| 🇿🇦 South Africa | $0.1 |
In Canada, the total carbon tax revenue includes both national and provincial taxes.
While carbon pricing has been recognized internationally as one of the more efficient mechanisms for reducing CO2 emissions, research is divided over what the global average carbon price should be to achieve the goals of the Paris Climate Agreement, which aims to limit global warming to 1.5–2°C by 2100 relative to pre-industrial levels.
A recent study has shown that carbon pricing must be supported by other policy measures and innovations. According to a report from Queen’s University, there is no feasible carbon pricing scenario that is high enough to limit emissions sufficiently to achieve anything below 2.4°C warming on its own.

-

 Real Estate2 weeks ago
Visualizing America’s Shortage of Affordable Homes
-

 Technology1 week ago
Ranked: Semiconductor Companies by Industry Revenue Share
-

 Money1 week ago
Which States Have the Highest Minimum Wage in America?
-

 Real Estate1 week ago
Ranked: The Most Valuable Housing Markets in America
-

 Business1 week ago
Charted: Big Four Market Share by S&P 500 Audits
-

 AI2 weeks ago
The Stock Performance of U.S. Chipmakers So Far in 2024
-

 Misc2 weeks ago
Almost Every EV Stock is Down After Q1 2024
-

 Money2 weeks ago
Where Does One U.S. Tax Dollar Go?