Maps
Mapping Airways: The World’s Flight Paths and Airports
Article/Editing:
Click to view a larger version of the graphic.
Mapping Airways: World’s Flight Paths and Airports
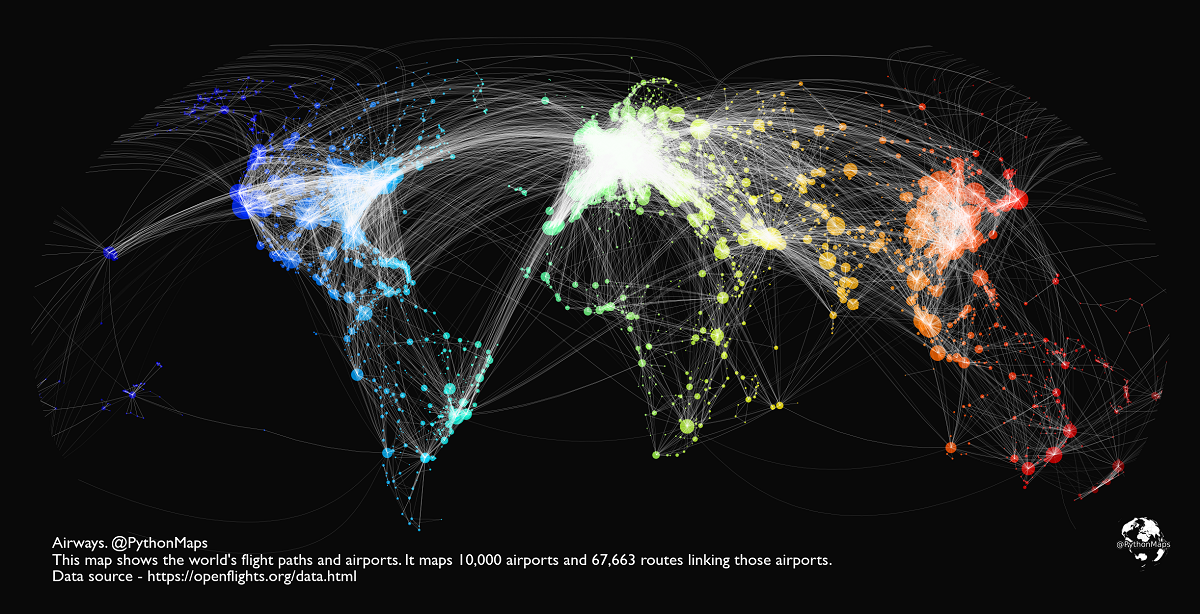
There are up to 8,755 commercial flights in the air at any given time of day. These flights transport thousands of people (and millions of dollars worth of goods) around the world.
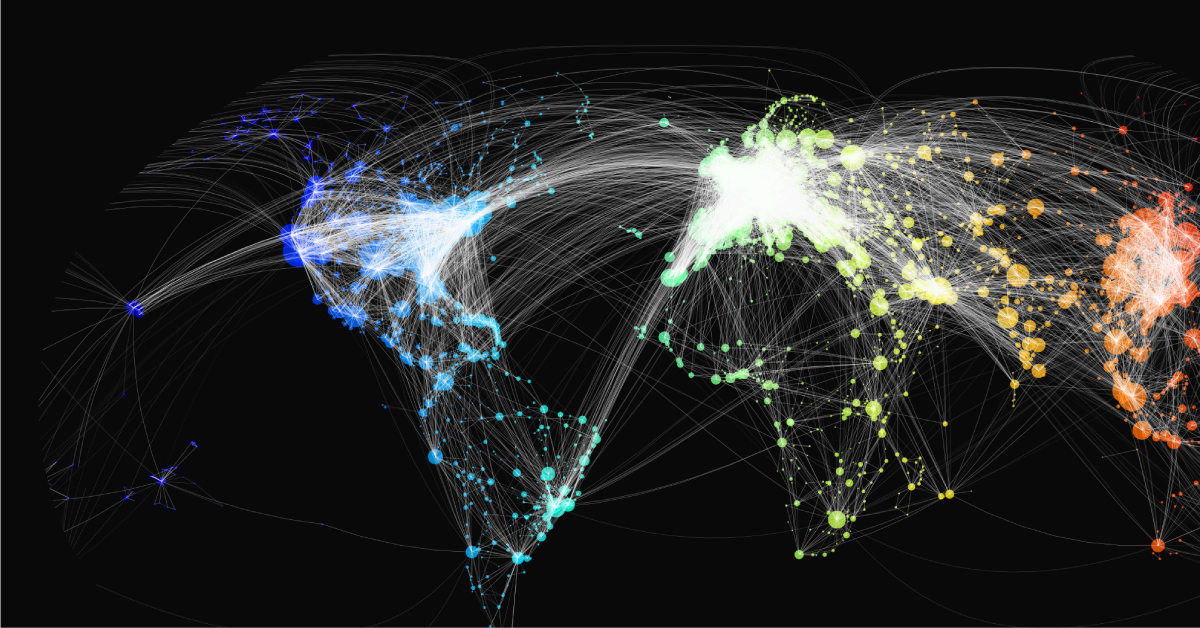
But where are these people and goods headed? This map from Adam Symington uses historical data from OpenFlights to visualize the world’s flight paths.
The graphic shows a comprehensive data set encompassing 67,663 different routes that connect 10,000 different airports across the globe.
A Note On the Data
The map uses an OpenFlights database provided by the third-party source that hasn’t been updated since June 2014.
Because of this, the data used for the graphic is of historical value only. However, this detailed map sparked our curiosity and got us wondering—what are some of the busiest aviation hubs around the world right now?
We did some digging, and here’s what we found.
Busiest Airports by Passengers
There are several ways to gauge an airport’s popularity. One way is to measure total passenger traffic throughout the year.
According to Airports Council International (ACI), eight of the top 10 busiest airports for passenger traffic in 2021 were in America. Here’s a look at the top 10 list, as of April 11, 2022:
| Rank | Airport | Country | Passenger Traffic (2021) |
|---|---|---|---|
| 1 | Atlanta GA (ATL) | 🇺🇸 US | 75,704,760 |
| 2 | Dallas/Fort Worth TX (DFW) | 🇺🇸 US | 62,465,756 |
| 3 | Denver CO (DEN) | 🇺🇸 US | 58,828,552 |
| 4 | Chicago IL (ORD) | 🇺🇸 US | 54,020,399 |
| 5 | Los Angeles CA (LAX) | 🇺🇸 US | 48,007,284 |
| 6 | Charlotte NC (CLT) | 🇺🇸 US | 43,302,230 |
| 7 | Orlando FL (MCO) | 🇺🇸 US | 40,351,068 |
| 8 | Guangzhou (CAN) | 🇨🇳 China | 40,259,401 |
| 9 | Chengdu (CTU) | 🇨🇳 China | 40,117,496 |
| 10 | Las Vegas NV (LAS) | 🇺🇸 US | 39,754,366 |
In 2021, the airport with the most passenger traffic was Hartsfield-Jackson Atlanta International Airport. It accommodated more than 75 million passengers last year—a 76.4% increase compared to 2020 figures.
Hartsfield-Jackson is well-known for being one of the busiest airports in the world. One reason for this is its convenient location—according to the airport’s official website, Atlanta is within a two-hour flight from 80% of the U.S. population.
Dallas/Forth Worth (DFW) came in second place, seeing 62.5 million passengers throughout 2021. DFW was one of the only airports to boost its service offerings throughout the pandemic, and is also the main hub for American Airlines, the world’s largest airline by fleet size.
Busiest Airports by Cargo
While the U.S. dominates the ranking when it comes to passenger traffic, the list is much more diverse when looking at air cargo volumes. Here’s a look at the ranking, based on loaded and unloaded freight and mail (including transit freight):
| Rank | Airport | Country | Cargo Traffic (Metric Tonnes, 2021) |
|---|---|---|---|
| 1 | Hong Kong SAR (HKG) | 🇭🇰 Hong Kong | 5,025,495 |
| 2 | Memphis TN (MEM) | 🇺🇸 US | 4,480,465 |
| 3 | Shanghai (PVG) | 🇨🇳 China | 3,982,616 |
| 4 | Anchorage AK (ANC) | 🇺🇸 US | 3,555,160 |
| 5 | Incheon (ICN) | 🇰🇷 South Korea | 3,329,292 |
| 6 | Louisville KY (SDF) | 🇺🇸 US | 3,052,269 |
| 7 | Taipei (TPE) | 🇹🇼 Taiwan | 2,812,065 |
| 8 | Los Angeles CA (LAX) | 🇺🇸 US | 2,691,830 |
| 9 | Tokyo (NRT) | 🇯🇵 Japan | 2,644,074 |
| 10 | Doha (DOH) | 🇶🇦 Qatar | 2,620,095 |
Hong Kong (HKG) takes the top spot since the airport processed more than 5.0 million metric tonnes of freight and mail throughout 2021.
Hong Kong has been known as one of the busiest air cargo hubs for over a decade and is able to maintain this reputation because of its strategic location, impressive infrastructure, efficient customs, and business-friendly trade regulations.
The COVID-19 Impact on Aviation
The global pandemic hit the aviation industry hard. At its lowest point, international travel was down 98% from normal levels.
While the aviation industry is starting to recover from its COVID-induced slump, things still haven’t fully bounced back yet, especially in places like Shanghai, where lockdowns are still being mandated.
But experts remain hopeful for the future. According to ACI World’s General Director Luis Felipe de Oliveira, last year’s recovery was just the beginning.
“With many countries taking steps towards the return of a certain normality, lifting almost all the health measures and travel restrictions as supported by science, we welcome the continuation of air travel demand’s recovery in 2022.”
-Luis Felipe de Oliveira, ACI World’s Director General

This article was published as a part of Visual Capitalist's Creator Program, which features data-driven visuals from some of our favorite Creators around the world.


Maps
The Largest Earthquakes in the New York Area (1970-2024)
The earthquake that shook buildings across New York in April 2024 was the third-largest quake in the Northeast U.S. over the past 50 years.


The Largest Earthquakes in the New York Area
This was originally posted on our Voronoi app. Download the app for free on Apple or Android and discover incredible data-driven charts from a variety of trusted sources.
The 4.8 magnitude earthquake that shook buildings across New York on Friday, April 5th, 2024 was the third-largest quake in the U.S. Northeast area over the past 50 years.
In this map, we illustrate earthquakes with a magnitude of 4.0 or greater recorded in the Northeastern U.S. since 1970, according to the United States Geological Survey (USGS).
Shallow Quakes and Older Buildings
The earthquake that struck the U.S. Northeast in April 2024 was felt by millions of people from Washington, D.C., to north of Boston. It even caused a full ground stop at Newark Airport.
The quake, occurring just 5 km beneath the Earth’s surface, was considered shallow, which is what contributed to more intense shaking at the surface.
According to the USGS, rocks in the eastern U.S. are significantly older, denser, and harder than those on the western side, compressed by time. This makes them more efficient conduits for seismic energy. Additionally, buildings in the Northeast tend to be older and may not adhere to the latest earthquake codes.
Despite disrupting work and school life, the earthquake was considered minor, according to the Michigan Technological University magnitude scale:
| Magnitude | Earthquake Effects | Estimated Number Each Year |
|---|---|---|
| 2.5 or less | Usually not felt, but can be recorded by seismograph. | Millions |
| 2.5 to 5.4 | Often felt, but only causes minor damage. | 500,000 |
| 5.5 to 6.0 | Slight damage to buildings and other structures. | 350 |
| 6.1 to 6.9 | May cause a lot of damage in very populated areas. | 100 |
| 7.0 to 7.9 | Major earthquake. Serious damage. | 10-15 |
| 8.0 or greater | Great earthquake. Can totally destroy communities near the epicenter. | One every year or two |
The largest earthquake felt in the area over the past 50 years was a 5.3 magnitude quake that occurred in Au Sable Forks, New York, in 2002. It damaged houses and cracked roads in a remote corner of the Adirondack Mountains, but caused no injuries.
| Date | Magnitude | Location | State |
|---|---|---|---|
| April 20, 2002 | 5.3 | Au Sable Forks | New York |
| October 7, 1983 | 5.1 | Newcomb | New York |
| April 5, 2024 | 4.8 | Whitehouse Station | New Jersey |
| October 16, 2012 | 4.7 | Hollis Center | Maine |
| January 16, 1994 | 4.6 | Sinking Spring | Pennsylvania |
| January 19, 1982 | 4.5 | Sanbornton | New Hampshire |
| September 25, 1998 | 4.5 | Adamsville | Pennsylvania |
| June 9, 1975 | 4.2 | Altona | New York |
| May 29, 1983 | 4.2 | Peru | Maine |
| April 23, 1984 | 4.2 | Conestoga | Pennsylvania |
| January 16, 1994 | 4.2 | Sinking Spring | Pennsylvania |
| November 3, 1975 | 4 | Long Lake | New York |
| June 17, 1991 | 4 | Worcester | New York |
The largest earthquake in U.S. history, however, was the 1964 Good Friday quake in Alaska, measuring 9.2 magnitude and killing 131 people.

-

 Mining2 weeks ago
Charted: The Value Gap Between the Gold Price and Gold Miners
-

 Real Estate1 week ago
Ranked: The Most Valuable Housing Markets in America
-

 Business1 week ago
Charted: Big Four Market Share by S&P 500 Audits
-

 AI1 week ago
The Stock Performance of U.S. Chipmakers So Far in 2024
-

 Misc1 week ago
Almost Every EV Stock is Down After Q1 2024
-

 Money2 weeks ago
Where Does One U.S. Tax Dollar Go?
-

 Green2 weeks ago
Ranked: Top Countries by Total Forest Loss Since 2001
-

 Real Estate2 weeks ago
Visualizing America’s Shortage of Affordable Homes