Markets
Mapped: The Top U.S. Imports by State
Article/Editing:
Click to view a larger version of the graphic.
Mapped: The Top U.S. Imports by State
In 2021, the U.S. brought in approximately $2.83 trillion worth of goods from its various international trading partners.
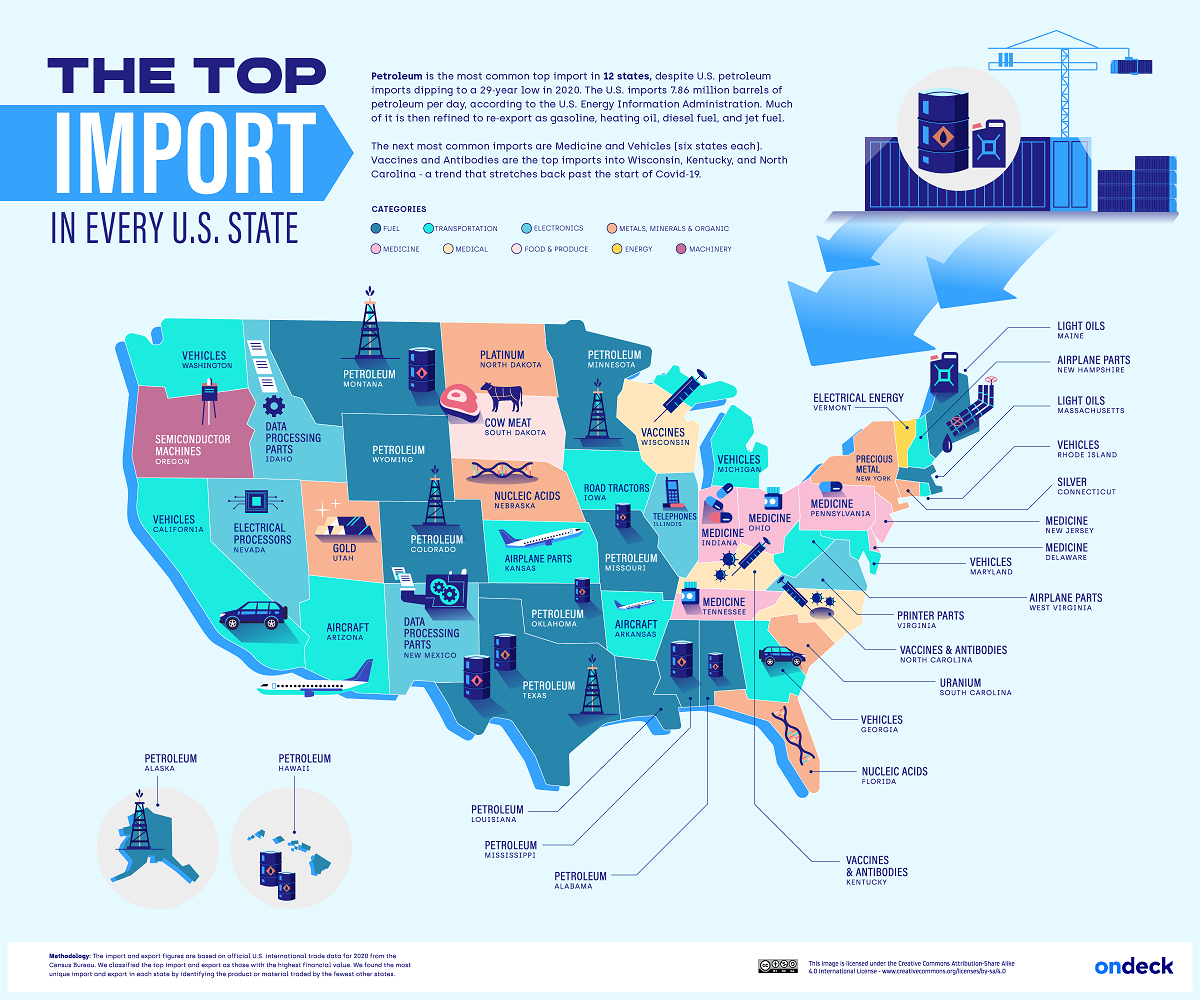
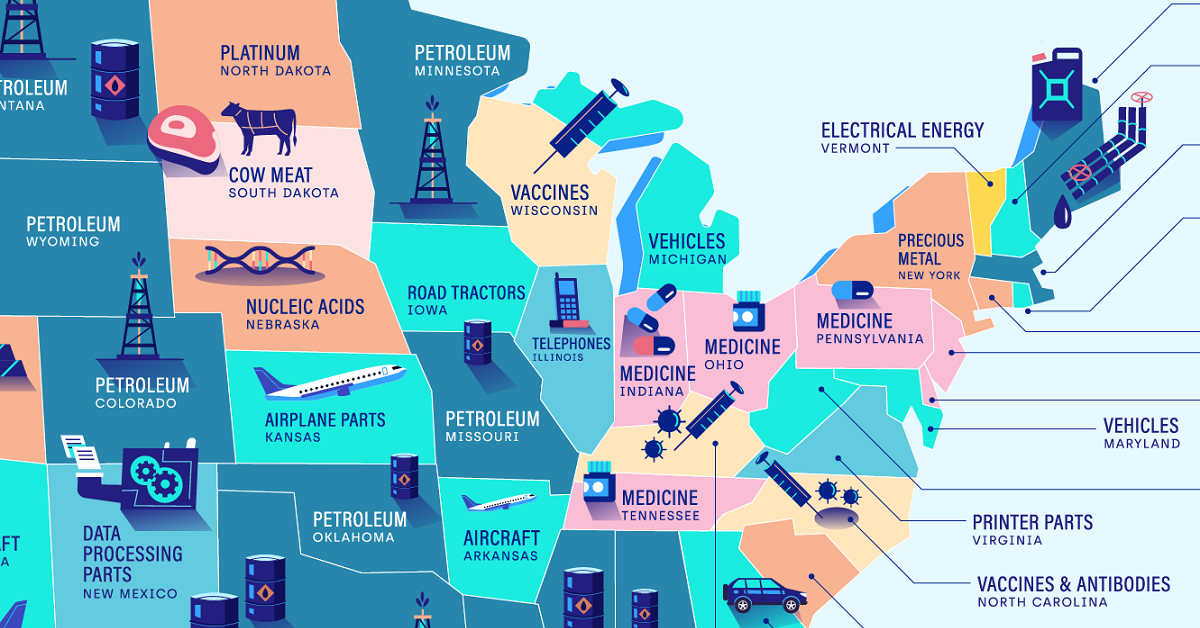
But what types of goods are most commonly imported throughout different parts of America? This graphic by OnDeck shows the top import in every U.S. state, using January 2022 data from the U.S. Census Bureau.
The Most Popular Categories of U.S. Imports
Petroleum is the most popular import in 12 states, making it the most common import across America. In 2021, about 72% of imported petroleum was crude oil, which was then domestically refined into products like gasoline, diesel, or jet fuel.
| State | Top Import |
|---|---|
| Alabama | Petroleum |
| Alaska | Petroleum |
| Arizona | Aircraft |
| Arkansas | Aircraft |
| California | Vehicles |
| Colorado | Petroleum |
| Connecticut | Silver |
| Delaware | Medicine |
| Florida | Nucleic Acids |
| Georgia | Vehicles |
| Hawaii | Petroleum |
| Idaho | Data Processing Parts |
| Illinois | Telephones |
| Indiana | Medicine |
| Iowa | Road Tractors |
| Kansas | Aircraft |
| Kentucky | Vaccines and Antibodies |
| Louisiana | Petroleum |
| Maine | Light Oils |
| Maryland | Vehicles |
| Massachusetts | Light Oils |
| Michigan | Vehicles |
| Minnesota | Petroleum |
| Mississippi | Petroleum |
| Missouri | Petroleum |
| Montana | Petroleum |
| Nebraska | Nucleic Acids |
| Nevada | Electrical Processors |
| New Hampshire | Aircraft |
| New Jersey | Medicine |
| New Mexico | Data Processing Parts |
| New York | Precious Metal |
| North Carolina | Vaccines and Antibodies |
| North Dakota | Platinum |
| Ohio | Medicine |
| Oklahoma | Petroleum |
| Oregon | Semiconductor Machines |
| Pennsylvania | Medicine |
| Rhode Island | Vehicles |
| South Carolina | Uranium |
| South Dakota | Cow Meat |
| Tennessee | Medicine |
| Texas | Petroleum |
| Utah | Gold |
| Vermont | Electrical Energy |
| Virginia | Printer Parts |
| Washington | Vehicles |
| West Virginia | Aircraft |
| Wisconsin | Vaccines |
| Wyoming | Petroleum |
A majority of that imported petroleum came from Canada, while roughly 11% was imported from OPEC countries, and 8% came from Russia. Of course, the latter figure will likely dip in 2022 because of the ban on Russian imports implemented by the Biden administration in response to the Russia-Ukraine conflict.
After petroleum, vehicles and medicine were tied for the second most-imported goods, with both categories being the most popular import in six states each.
Somewhat related to medicine are nucleic acids, which were the top imports in Florida and Nebraska. Nucleic acids are natural polymers that are used in biological processes like protein synthesis or messenger RNA (mRNA) translation. It’s worth noting that several COVID-19 vaccines, including those produced by Moderna and Pfizer-BioNTech, are mRNA vaccines.
The Most Unique U.S. Imports
In addition to outlining the most popular imports in each U.S. state, OnDeck highlights each state’s most unique import, visualized in the graphic below.
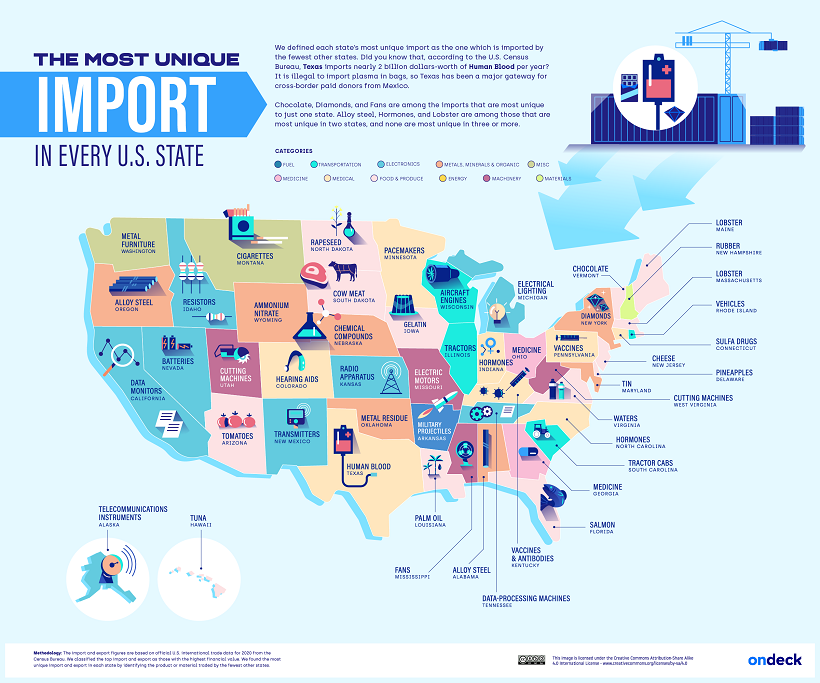
OnDeck defines each state’s “most unique” import as the category of goods that was imported by the fewest other states.
Salmon was Florida’s most unique import. This makes sense considering the Sunshine State is home to some of the country’s biggest seafood wholesalers, including North Star Seafood (owned by Sysco) and Tampa Bay Fisheries.
Another example is Delaware’s high imports of pineapples, totaling around $60.2 million in pineapples per year. This time, the culprit is Dole plc (formerly the Dole Food Company), the largest producer of fruit and vegetables in the world. Until 2021, the company’s headquarters were based in Delaware, and it still receives pineapple imports to the Port of Wilmington in the state’s largest city.

This article was published as a part of Visual Capitalist's Creator Program, which features data-driven visuals from some of our favorite Creators around the world.


Markets
U.S. Debt Interest Payments Reach $1 Trillion
U.S. debt interest payments have surged past the $1 trillion dollar mark, amid high interest rates and an ever-expanding debt burden.


U.S. Debt Interest Payments Reach $1 Trillion
This was originally posted on our Voronoi app. Download the app for free on iOS or Android and discover incredible data-driven charts from a variety of trusted sources.
The cost of paying for America’s national debt crossed the $1 trillion dollar mark in 2023, driven by high interest rates and a record $34 trillion mountain of debt.
Over the last decade, U.S. debt interest payments have more than doubled amid vast government spending during the pandemic crisis. As debt payments continue to soar, the Congressional Budget Office (CBO) reported that debt servicing costs surpassed defense spending for the first time ever this year.
This graphic shows the sharp rise in U.S. debt payments, based on data from the Federal Reserve.
A $1 Trillion Interest Bill, and Growing
Below, we show how U.S. debt interest payments have risen at a faster pace than at another time in modern history:
| Date | Interest Payments | U.S. National Debt |
|---|---|---|
| 2023 | $1.0T | $34.0T |
| 2022 | $830B | $31.4T |
| 2021 | $612B | $29.6T |
| 2020 | $518B | $27.7T |
| 2019 | $564B | $23.2T |
| 2018 | $571B | $22.0T |
| 2017 | $493B | $20.5T |
| 2016 | $460B | $20.0T |
| 2015 | $435B | $18.9T |
| 2014 | $442B | $18.1T |
| 2013 | $425B | $17.2T |
| 2012 | $417B | $16.4T |
| 2011 | $433B | $15.2T |
| 2010 | $400B | $14.0T |
| 2009 | $354B | $12.3T |
| 2008 | $380B | $10.7T |
| 2007 | $414B | $9.2T |
| 2006 | $387B | $8.7T |
| 2005 | $355B | $8.2T |
| 2004 | $318B | $7.6T |
| 2003 | $294B | $7.0T |
| 2002 | $298B | $6.4T |
| 2001 | $318B | $5.9T |
| 2000 | $353B | $5.7T |
| 1999 | $353B | $5.8T |
| 1998 | $360B | $5.6T |
| 1997 | $368B | $5.5T |
| 1996 | $362B | $5.3T |
| 1995 | $357B | $5.0T |
| 1994 | $334B | $4.8T |
| 1993 | $311B | $4.5T |
| 1992 | $306B | $4.2T |
| 1991 | $308B | $3.8T |
| 1990 | $298B | $3.4T |
| 1989 | $275B | $3.0T |
| 1988 | $254B | $2.7T |
| 1987 | $240B | $2.4T |
| 1986 | $225B | $2.2T |
| 1985 | $219B | $1.9T |
| 1984 | $205B | $1.7T |
| 1983 | $176B | $1.4T |
| 1982 | $157B | $1.2T |
| 1981 | $142B | $1.0T |
| 1980 | $113B | $930.2B |
| 1979 | $96B | $845.1B |
| 1978 | $84B | $789.2B |
| 1977 | $69B | $718.9B |
| 1976 | $61B | $653.5B |
| 1975 | $55B | $576.6B |
| 1974 | $50B | $492.7B |
| 1973 | $45B | $469.1B |
| 1972 | $39B | $448.5B |
| 1971 | $36B | $424.1B |
| 1970 | $35B | $389.2B |
| 1969 | $30B | $368.2B |
| 1968 | $25B | $358.0B |
| 1967 | $23B | $344.7B |
| 1966 | $21B | $329.3B |
Interest payments represent seasonally adjusted annual rate at the end of Q4.
At current rates, the U.S. national debt is growing by a remarkable $1 trillion about every 100 days, equal to roughly $3.6 trillion per year.
As the national debt has ballooned, debt payments even exceeded Medicaid outlays in 2023—one of the government’s largest expenditures. On average, the U.S. spent more than $2 billion per day on interest costs last year. Going further, the U.S. government is projected to spend a historic $12.4 trillion on interest payments over the next decade, averaging about $37,100 per American.
Exacerbating matters is that the U.S. is running a steep deficit, which stood at $1.1 trillion for the first six months of fiscal 2024. This has accelerated due to the 43% increase in debt servicing costs along with a $31 billion dollar increase in defense spending from a year earlier. Additionally, a $30 billion increase in funding for the Federal Deposit Insurance Corporation in light of the regional banking crisis last year was a major contributor to the deficit increase.
Overall, the CBO forecasts that roughly 75% of the federal deficit’s increase will be due to interest costs by 2034.

-

 Maps1 week ago
The Largest Earthquakes in the New York Area (1970-2024)
-

 Money2 weeks ago
Where Does One U.S. Tax Dollar Go?
-

 Automotive2 weeks ago
Almost Every EV Stock is Down After Q1 2024
-

 AI2 weeks ago
The Stock Performance of U.S. Chipmakers So Far in 2024
-

 Markets2 weeks ago
Charted: Big Four Market Share by S&P 500 Audits
-

 Real Estate2 weeks ago
Ranked: The Most Valuable Housing Markets in America
-

 Money2 weeks ago
Which States Have the Highest Minimum Wage in America?
-

 AI2 weeks ago
Ranked: Semiconductor Companies by Industry Revenue Share