United States
Mapped: Beer Consumption in the U.S.
Article/Editing:
var divElement = document.getElementById(‘viz1649807735677’); var vizElement = divElement.getElementsByTagName(‘object’)[0]; vizElement.style.width=’1200px’;vizElement.style.height=’1107px’; var scriptElement = document.createElement(‘script’); scriptElement.src = ‘https://public.tableau.com/javascripts/api/viz_v1.js’; vizElement.parentNode.insertBefore(scriptElement, vizElement);
Open the large interactive version here
Open the large interactive version here
Mapped: Beer Consumption in the U.S.
Beer consumption spans almost the entire world, and is a staple in much of the United States.
When stacked up next to other alcoholic beverages, beer is America’s preferred drink of choice, closely followed by wine and spirits. In fact, it is the fifth most-consumed drink overall in the country, behind coffee, water, soft drinks and tea.
At the end of 2021, beer in the U.S. was a $94.1 billion industry. Alongside massive multinational conglomerations, it is also driven by over 9,000 breweries of different types.
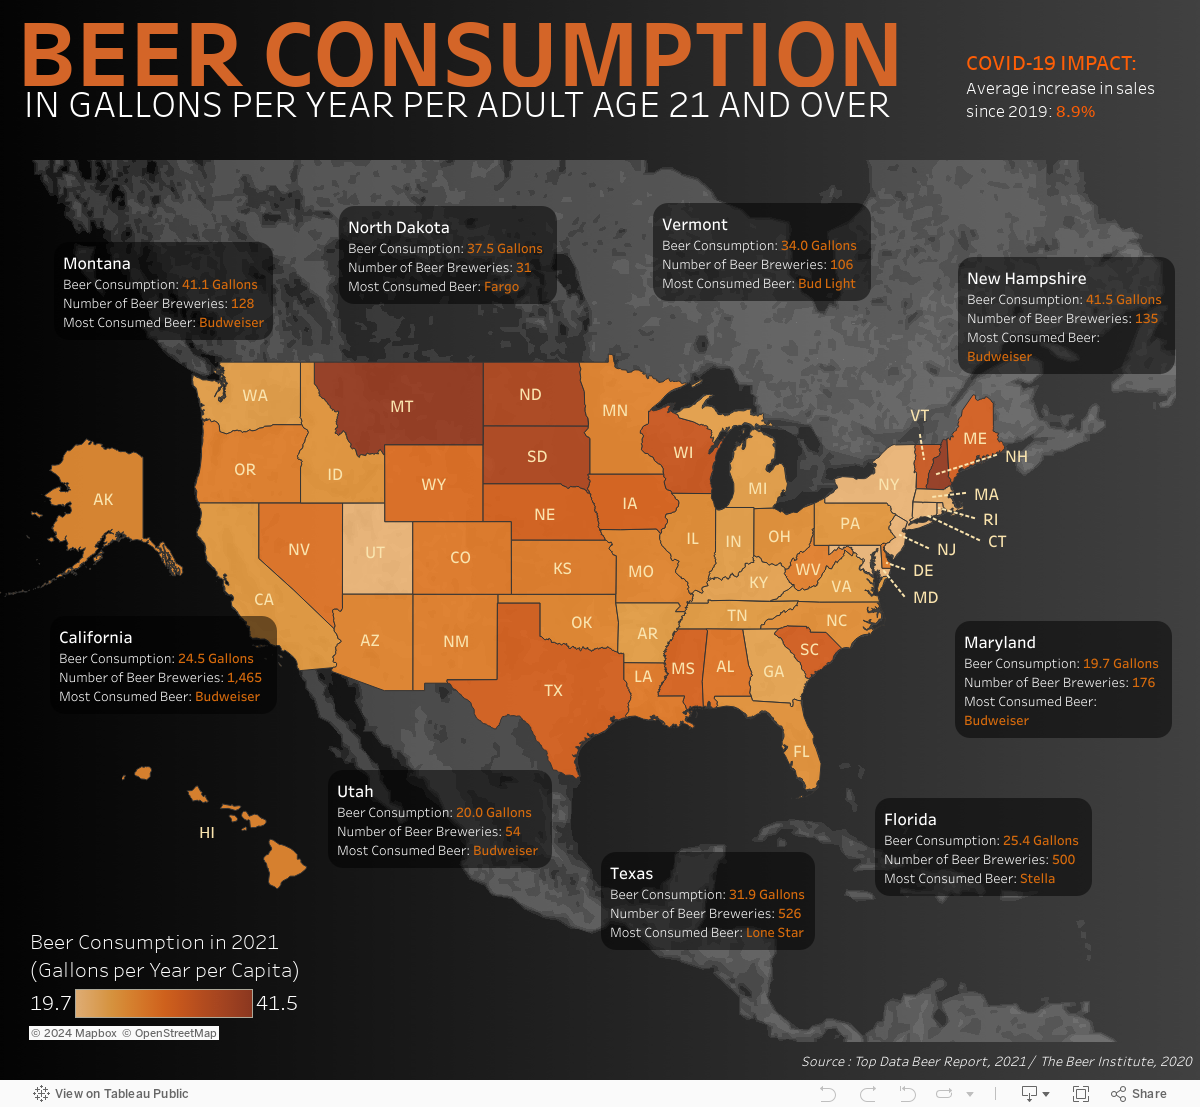
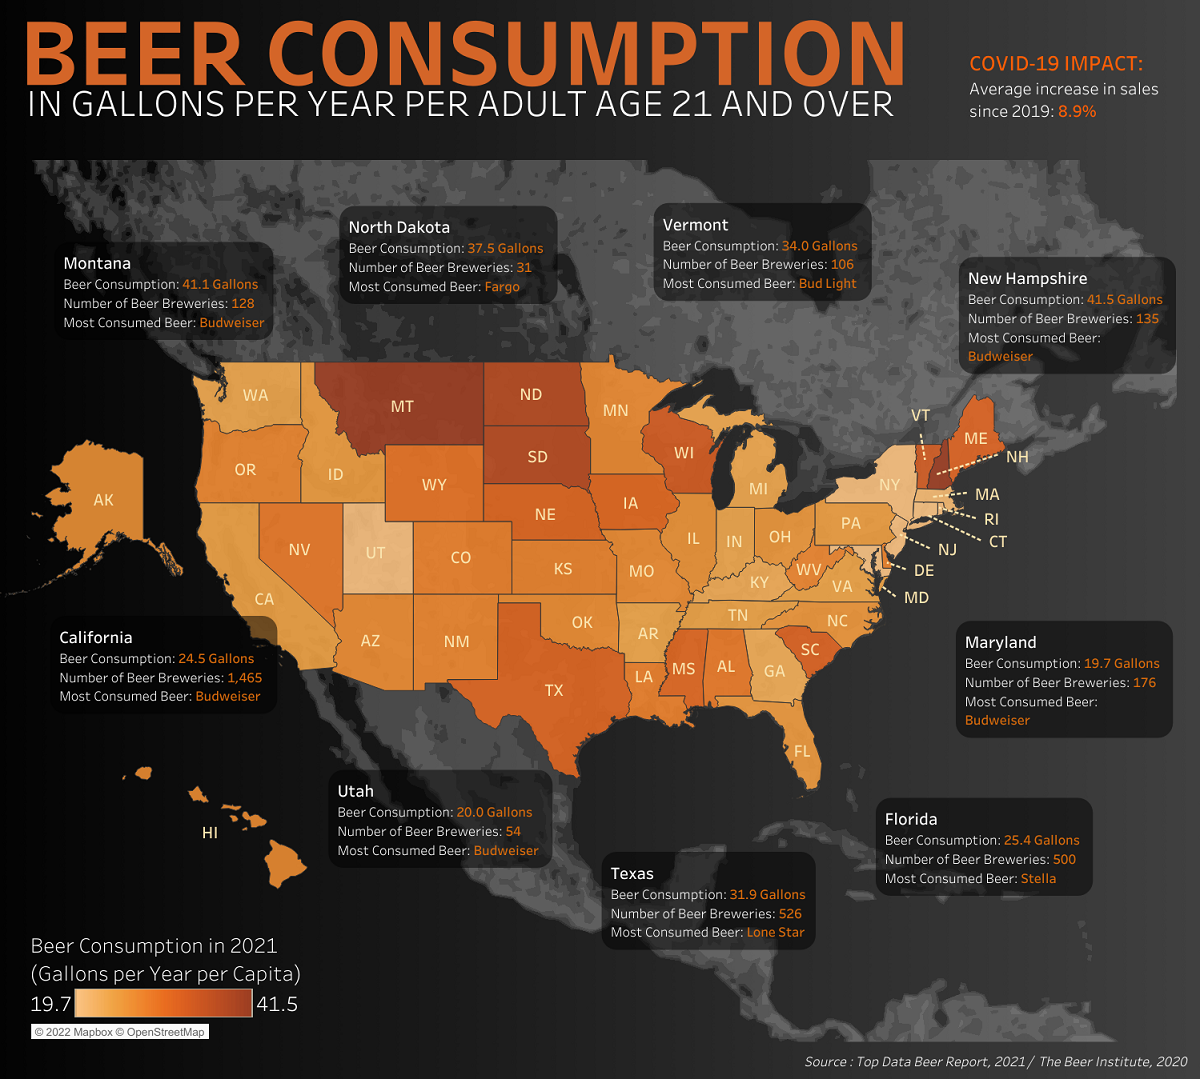
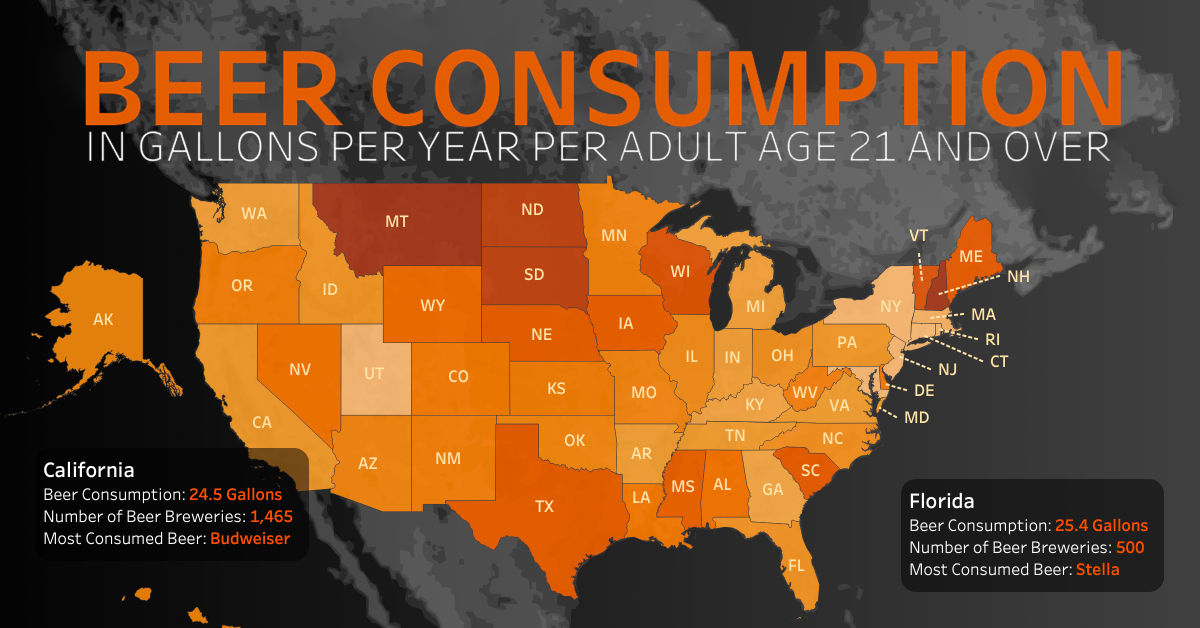
This visualization, created by Victor Dépré of Hypntic Data, maps the consumption of beer by gallons per capita across the U.S. using data from Top Agency and The Beer Institute.
What is Beer?
Beer is produced from the fermentation of combined water, malt, and yeast. It was first produced 12,000 years ago with the emergence of grain agriculture.
Today, beer is made from several different malted grains: wheat, corn, rice, oats, and most commonly, barley. Hops, a type of flower, are added for flavor, balancing out the malt’s sweetness with a bitter taste while also preserving the beer’s freshness and giving a good amount of foam.
American Beer Consumption By State
So which states drank the most beer, and what was their preferred brand?
The annual consumption stats come from the Beer Institute’s Brewer’s Almanac report, while the preferred beer of choice was compiled by Data Agency’s 2021 Beer Rankings report, which is based on a combination of surveys combined with Google search analysis from all over the country.
| Beer Consumption By State (2020) | Annual Gallons Per Capita | Preferred Beer |
|---|---|---|
| Alabama | 29.1 | Budweiser |
| Alaska | 26.1 | |
| Arizona | 27.0 | Dos Equis |
| Arkansas | 23.9 | Budweiser |
| California | 24.5 | Budweiser |
| Colorado | 28.1 | Denver Beer Co |
| Connecticut | 19.8 | Bud Light |
| Delaware | 27.9 | Dogfish Head |
| District of Columbia | 18.2 | |
| Florida | 25.4 | Stella |
| Georgia | 23.0 | Terrapin |
| Hawaii | 26.7 | |
| Idaho | 25.0 | Budweiser |
| Illinois | 25.9 | Goose Island |
| Indiana | 23.6 | Miller Light |
| Iowa | 31.0 | Budweiser |
| Kansas | 27.8 | Coors Light |
| Kentucky | 23.1 | Budweiser |
| Louisiana | 28.4 | Abita |
| Maine | 32.5 | Budweiser |
| Maryland | 19.7 | Budweiser |
| Massachusetts | 21.1 | Budweiser |
| Michigan | 23.6 | Budweiser |
| Minnesota | 27.1 | Budweiser |
| Mississippi | 31.6 | Lazy Magnolia |
| Missouri | 26.9 | Budweiser |
| Montana | 41.1 | Budweiser |
| Nebraska | 31.6 | Nebraska Black Betty |
| Nevada | 29.0 | Coors Light |
| New Hampshire | 41.5 | Budweiser |
| New Jersey | 20.0 | Miller Light |
| New Mexico | 27.7 | La Cumbre |
| New York | 20.2 | Budweiser |
| North Carolina | 25.8 | Bud Light |
| North Dakota | 37.5 | Fargo |
| Ohio | 25.5 | Heineken |
| Oklahoma | 26.8 | Budweiser |
| Oregon | 27.7 | Budweiser |
| Pennsylvania | 24.9 | Bud Light |
| Rhode Island | 20.1 | Narragansett |
| South Carolina | 32.5 | Budweiser |
| South Dakota | 37.3 | Budweiser |
| Tennessee | 24.2 | Budweiser |
| Texas | 31.9 | Lone Star |
| Utah | 20.0 | Budweiser |
| Vermont | 34.0 | Bud Light |
| Virginia | 24.2 | Budweiser |
| Washington | 23.7 | Bud Light |
| West Virginia | 27.8 | Budweiser |
| Wisconsin | 33.7 | Spotted Cow |
| Wyoming | 29.8 | Snake River |
New Hampshire took the top spot in 2020, outdrinking other states with 41.5 gallons of beer consumed annually per capita. In contrast, the lowest consuming state was Maryland which only consumed 19.7 gallons per capita, about half as much.
The most popular beer?
Despite the growing trend of craft breweries in some states, the most popular beer across the country was Budweiser of Anheuser-Busch, which took the top spot in 23 states.
Which State Has The Most Breweries?
Each state also has varying numbers of breweries operating within, and there are many different types.
Larger breweries, including those run by some of the world’s largest companies, are also called macrobreweries. They are usually defined as having an annual production greater than 6 million barrels of beer, compared to craft breweries and other types of microbreweries which have a lower annual production.
Craft breweries are also usually independently owned, and through both positioning and general perception, have come to be associated with specialties and originality, adding unique and interesting ingredients to traditional brews.
| Breweries By State (2020) | # of Breweries |
|---|---|
| Alabama | 70 |
| Alaska | 68 |
| Arizona | 170 |
| Arkansas | 73 |
| California | 1,466 |
| Colorado | 565 |
| Connecticut | 163 |
| Delaware | 49 |
| District of Columbia | 17 |
| Florida | 505 |
| Georgia | 191 |
| Hawaii | 46 |
| Idaho | 116 |
| Illinois | 406 |
| Indiana | 283 |
| Iowa | 151 |
| Kansas | 83 |
| Kentucky | 119 |
| Louisiana | 67 |
| Maine | 201 |
| Maryland | 177 |
| Massachusetts | 304 |
| Michigan | 611 |
| Minnesota | 291 |
| Mississippi | 26 |
| Missouri | 215 |
| Montana | 130 |
| Nebraska | 74 |
| Nevada | 73 |
| New Hampshire | 133 |
| New Jersey | 188 |
| New Mexico | 154 |
| New York | 680 |
| North Carolina | 514 |
| North Dakota | 31 |
| Ohio | 497 |
| Oklahoma | 91 |
| Oregon | 431 |
| Pennsylvania | 642 |
| Rhode Island | 50 |
| South Carolina | 135 |
| South Dakota | 59 |
| Tennessee | 196 |
| Texas | 532 |
| Utah | 54 |
| Vermont | 106 |
| Virginia | 425 |
| Washington | 633 |
| West Virginia | 37 |
| Wisconsin | 364 |
| Wyoming | 52 |
California has the highest number of breweries in the country, more than double any other state, at 1,466.
On the flip side, Mississippi has the fewest breweries, with the most recent Beer Institute’s 2021 almanac only listing 26 in the entire state.
Beer Sales During the Pandemic
Since the beginning of the COVID-19 pandemic in 2020, commonplace items saw massive spikes in sales across the world.
As lockdowns were implemented and people were forced to stay at home, household items like toilet paper, soap, and pastas began to disappear from store shelves at alarmingly fast rates. Beer was no exception, and sales have continued to increase, going up by 8.9% in the U.S. since 2020.
This is a worrisome fact to many researchers, as it could be a strong indicator that alcohol was used as a coping mechanism against anxiety and isolation felt during the pandemic. This rise could be a result of increased consumption, but may also indicate increased stockpiling.
Regardless of why beer sales increased, it will be interesting to see which way the trend swings with the lifting of COVID-19 restrictions and the attempted return to normalcy in the months to come.

This article was published as a part of Visual Capitalist's Creator Program, which features data-driven visuals from some of our favorite Creators around the world.


Markets
Ranked: The Largest U.S. Corporations by Number of Employees
We visualized the top U.S. companies by employees, revealing the massive scale of retailers like Walmart, Target, and Home Depot.


The Largest U.S. Corporations by Number of Employees
This was originally posted on our Voronoi app. Download the app for free on Apple or Android and discover incredible data-driven charts from a variety of trusted sources.
Revenue and profit are common measures for measuring the size of a business, but what about employee headcount?
To see how big companies have become from a human perspective, we’ve visualized the top U.S. companies by employees. These figures come from companiesmarketcap.com, and were accessed in March 2024. Note that this ranking includes publicly-traded companies only.
Data and Highlights
The data we used to create this list of largest U.S. corporations by number of employees can be found in the table below.
| Company | Sector | Number of Employees |
|---|---|---|
| Walmart | Consumer Staples | 2,100,000 |
| Amazon | Consumer Discretionary | 1,500,000 |
| UPS | Industrials | 500,000 |
| Home Depot | Consumer Discretionary | 470,000 |
| Concentrix | Information Technology | 440,000 |
| Target | Consumer Staples | 440,000 |
| Kroger | Consumer Staples | 430,000 |
| UnitedHealth | Health Care | 400,000 |
| Berkshire Hathaway | Financials | 383,000 |
| Starbucks | Consumer Discretionary | 381,000 |
| Marriott International | Consumer Discretionary | 377,000 |
| Cognizant | Information Technology | 346,600 |
Retail and Logistics Top the List
Companies like Walmart, Target, and Kroger have a massive headcount due to having many locations spread across the country, which require everything from cashiers to IT professionals.
Moving goods around the world is also highly labor intensive, explaining why UPS has half a million employees globally.
Below the Radar?
Two companies that rank among the largest U.S. corporations by employees which may be less familiar to the public include Concentrix and Cognizant. Both of these companies are B2B brands, meaning they primarily work with other companies rather than consumers. This contrasts with brands like Amazon or Home Depot, which are much more visible among average consumers.
A Note on Berkshire Hathaway
Warren Buffett’s company doesn’t directly employ 383,000 people. This headcount actually includes the employees of the firm’s many subsidiaries, such as GEICO (insurance), Dairy Queen (retail), and Duracell (batteries).
If you’re curious to see how Buffett’s empire has grown over the years, check out this animated graphic that visualizes the growth of Berkshire Hathaway’s portfolio from 1994 to 2022.

-

 Real Estate2 weeks ago
Visualizing America’s Shortage of Affordable Homes
-

 Technology1 week ago
Ranked: Semiconductor Companies by Industry Revenue Share
-

 Money1 week ago
Which States Have the Highest Minimum Wage in America?
-

 Real Estate1 week ago
Ranked: The Most Valuable Housing Markets in America
-

 Business2 weeks ago
Charted: Big Four Market Share by S&P 500 Audits
-

 AI2 weeks ago
The Stock Performance of U.S. Chipmakers So Far in 2024
-

 Misc2 weeks ago
Almost Every EV Stock is Down After Q1 2024
-

 Money2 weeks ago
Where Does One U.S. Tax Dollar Go?