Maps
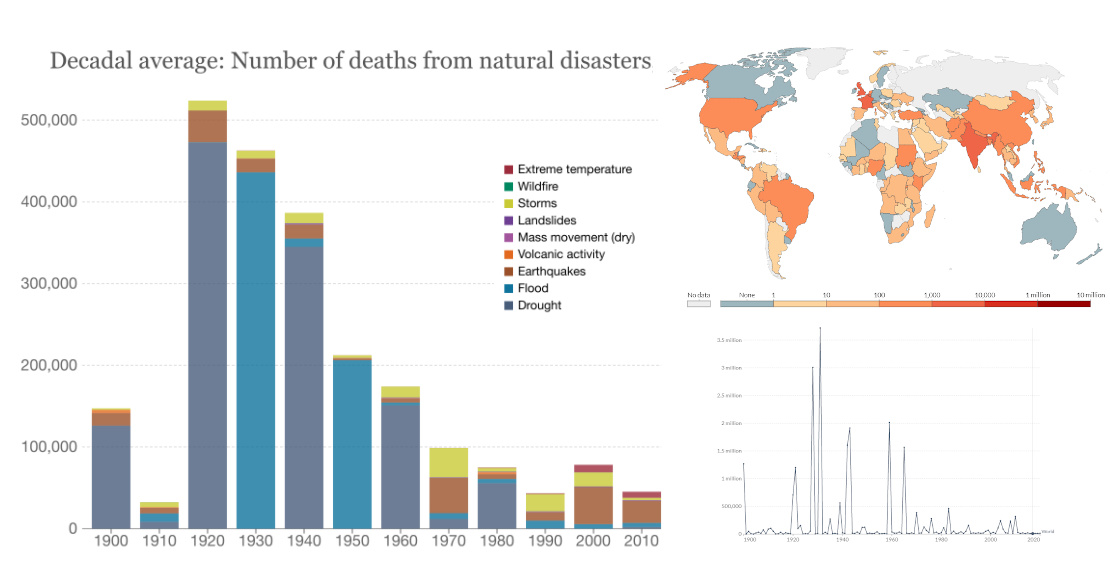
Interactive: Natural Disasters Around the World Since 1900
Article/Editing:
Interactive: Natural Disasters Around the World Since 1900
While natural disasters are inevitable and commonplace within the context of human history, that doesn’t lessen our collective shock when they occur.
Here are just a few of the natural disasters that made headlines last year:
- Haiti was rocked by a 7.2 magnitude earthquake that killed more than 2,000 people Tens of thousands of homes were damaged or destroyed.
- Super typhoon, Rai, killed 375 people in the Philippines. The storm brought winds as high as 120 mph (193 kph)
- Landslides in China’s Henan province kill more than 300 people
- Historic flooding results in more than 200 fatalities in Germany and Belgium
- Hurricane Ida battered the Gulf Coast, killing 91 people across nine U.S. states
And these are just some of the many events that rounded out a long list of disasters in 2021.
The interactive dashboard above was created by Our World in Data, using data came from EM-DAT, the International Disaster Database. The database aims to rationalize decision making for disaster preparedness and to provide an objective base for vulnerability assessment.
Total Deaths by Natural Disaster in the Last Decade (2010-2019)
In the past decade, approximately 60,000 people per year died from natural disasters. This represents 0.1% of total deaths worldwide.
The chart below breaks down the total deaths by type of natural disaster in the last decade.
| Type of Natural Disaster | Total Deaths (2010-2019) |
|---|---|
| Earthquakes | 267,480 |
| Extreme Temperatures | 74,244 |
| Floods | 50,673 |
| Storms | 27,632 |
| Droughts | 20,120 |
| Landslides | 10,109 |
| Volcanic Activity | 1,363 |
| Wildfires | 881 |
| Mass Movement | 100 |
| TOTAL | 452,602 |
Historically, droughts and floods were the most fatal natural disasters.
However, deaths from these events are relatively low now compared to earthquakes, which are by far the most deadly natural disaster in modern times. Over the past decade, earthquakes have killed 267,480 people worldwide, followed by extreme temperatures, which killed 74,244.
The Decline of Deaths from Natural Disasters
Is planet Earth really more dangerous than ever? Let’s take a look at what the data says:
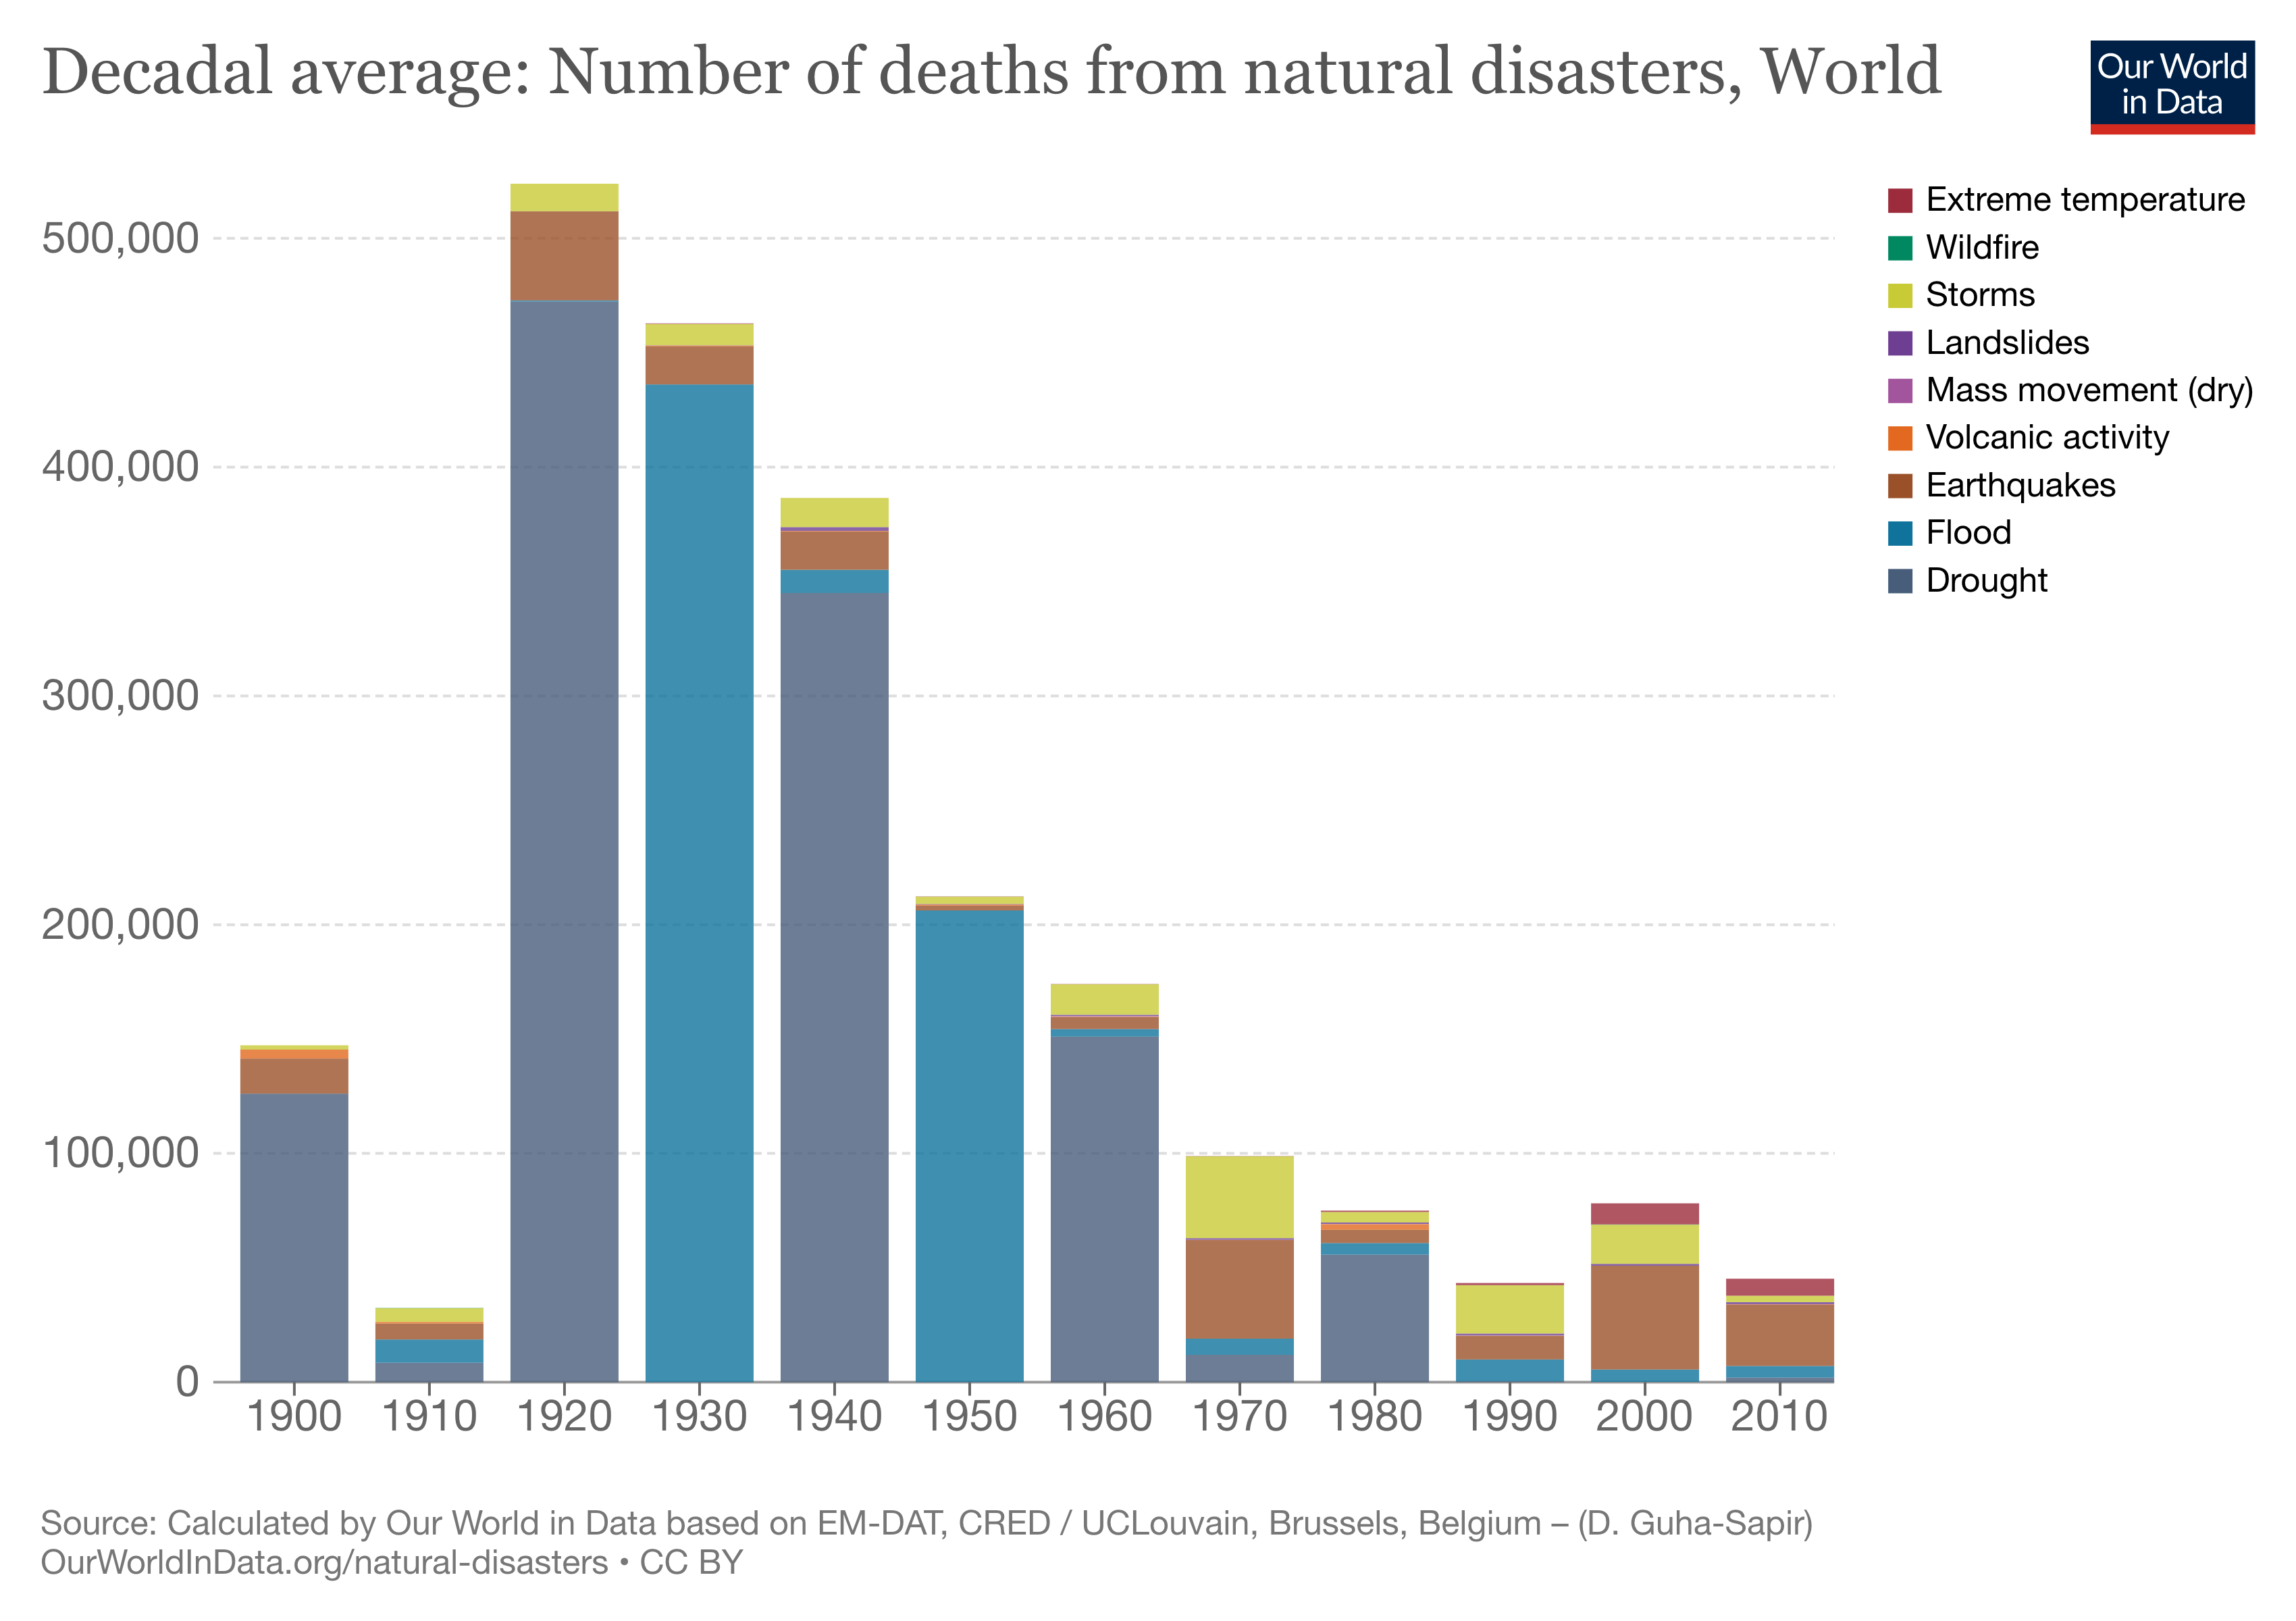
The chart above shows a sharp decline in deaths from natural disasters over the last 100 years.
In the 1920s, the world averaged over 500,000 deaths from natural disasters per year. These were caused by several outlier events: for example, a Tokyo earthquake in 1923 killed over 146,000 people, and drought and famine killed 3 million people in China between 1928 and 1930.
In the 1930s, the number dropped below the 500,000 deaths per year average, but a number of events still put their thumb on the scale. In 1931, floods in China killed over 3.7 million people, and in 1935, an earthquake killed up to 60,000 people in Pakistan, and so on.
But luckily over time, the decadal average has dropped to fewer than 100,000 deaths per year. And if we consider the rate of population growth, then the decline over the past century has been even more dramatic.
Our awareness of natural disasters has increased dramatically along with global access to real-time information, and thankfully, these occurrences are less deadly than they once were.
How to Navigate this Interactive Visualization
The dashboard above is packed with useful views and data. Some of the features to highlight are:
The Top Navigation
– Type of disaster: The options include: drought, earthquakes, floods, storms, volcanoes, extreme temperatures
– Impact: The impact of the natural disaster is measured in: deaths, injuries, affected, homeless, and more
– Timespan: The selection allows for average by decade and year
– Per capita: The impact is measured in per capita terms instead of total numbers
The Left Bar
– Filter the data by country and region
– Filter the data by type of disaster and related effects (e.g. deaths, economic impacts)
The Bottom Tabs
– Bar Chart: All data selected is displayed in a bar chart format
– Map: Data is shown by country in a heat map. Click “Play” at the bottom left to view data for different decades
– Table: The same data that is displayed in the visualization is shown in table format
– Sources: All the data sources and calculations are clearly displayed in this tab
– Download: This option allows downloading the image in PNG, SVG, and full data in CSV

This article was published as a part of Visual Capitalist's Creator Program, which features data-driven visuals from some of our favorite Creators around the world.


Maps
The Largest Earthquakes in the New York Area (1970-2024)
The earthquake that shook buildings across New York in April 2024 was the third-largest quake in the Northeast U.S. over the past 50 years.


The Largest Earthquakes in the New York Area
This was originally posted on our Voronoi app. Download the app for free on Apple or Android and discover incredible data-driven charts from a variety of trusted sources.
The 4.8 magnitude earthquake that shook buildings across New York on Friday, April 5th, 2024 was the third-largest quake in the U.S. Northeast area over the past 50 years.
In this map, we illustrate earthquakes with a magnitude of 4.0 or greater recorded in the Northeastern U.S. since 1970, according to the United States Geological Survey (USGS).
Shallow Quakes and Older Buildings
The earthquake that struck the U.S. Northeast in April 2024 was felt by millions of people from Washington, D.C., to north of Boston. It even caused a full ground stop at Newark Airport.
The quake, occurring just 5 km beneath the Earth’s surface, was considered shallow, which is what contributed to more intense shaking at the surface.
According to the USGS, rocks in the eastern U.S. are significantly older, denser, and harder than those on the western side, compressed by time. This makes them more efficient conduits for seismic energy. Additionally, buildings in the Northeast tend to be older and may not adhere to the latest earthquake codes.
Despite disrupting work and school life, the earthquake was considered minor, according to the Michigan Technological University magnitude scale:
| Magnitude | Earthquake Effects | Estimated Number Each Year |
|---|---|---|
| 2.5 or less | Usually not felt, but can be recorded by seismograph. | Millions |
| 2.5 to 5.4 | Often felt, but only causes minor damage. | 500,000 |
| 5.5 to 6.0 | Slight damage to buildings and other structures. | 350 |
| 6.1 to 6.9 | May cause a lot of damage in very populated areas. | 100 |
| 7.0 to 7.9 | Major earthquake. Serious damage. | 10-15 |
| 8.0 or greater | Great earthquake. Can totally destroy communities near the epicenter. | One every year or two |
The largest earthquake felt in the area over the past 50 years was a 5.3 magnitude quake that occurred in Au Sable Forks, New York, in 2002. It damaged houses and cracked roads in a remote corner of the Adirondack Mountains, but caused no injuries.
| Date | Magnitude | Location | State |
|---|---|---|---|
| April 20, 2002 | 5.3 | Au Sable Forks | New York |
| October 7, 1983 | 5.1 | Newcomb | New York |
| April 5, 2024 | 4.8 | Whitehouse Station | New Jersey |
| October 16, 2012 | 4.7 | Hollis Center | Maine |
| January 16, 1994 | 4.6 | Sinking Spring | Pennsylvania |
| January 19, 1982 | 4.5 | Sanbornton | New Hampshire |
| September 25, 1998 | 4.5 | Adamsville | Pennsylvania |
| June 9, 1975 | 4.2 | Altona | New York |
| May 29, 1983 | 4.2 | Peru | Maine |
| April 23, 1984 | 4.2 | Conestoga | Pennsylvania |
| January 16, 1994 | 4.2 | Sinking Spring | Pennsylvania |
| November 3, 1975 | 4 | Long Lake | New York |
| June 17, 1991 | 4 | Worcester | New York |
The largest earthquake in U.S. history, however, was the 1964 Good Friday quake in Alaska, measuring 9.2 magnitude and killing 131 people.

-

 Real Estate2 weeks ago
Visualizing America’s Shortage of Affordable Homes
-

 Technology1 week ago
Ranked: Semiconductor Companies by Industry Revenue Share
-

 Money1 week ago
Which States Have the Highest Minimum Wage in America?
-

 Real Estate1 week ago
Ranked: The Most Valuable Housing Markets in America
-

 Business2 weeks ago
Charted: Big Four Market Share by S&P 500 Audits
-

 AI2 weeks ago
The Stock Performance of U.S. Chipmakers So Far in 2024
-

 Misc2 weeks ago
Almost Every EV Stock is Down After Q1 2024
-

 Money2 weeks ago
Where Does One U.S. Tax Dollar Go?